Neutron scattering study of ferroelectric Sn2P2S6 under pressure
Abstract
Ferroelectric phase transition in the semiconductor Sn2P2S6 single crystal has been studied by means of neutron scattering in the pressure-temperature range adjacent to the anticipated tricritical Lifshitz point ( GPa, K). The observations reveal a direct ferroelectric-paraelectric phase transition in the whole investigated pressure range ( GPa). These results are in a clear disagreement with phase diagrams assumed in numerous earlier works, according to which a hypothetical intermediate incommensurate phase extends over several or even tens of degrees in the 0.5 GPa pressure range. Temperature dependence of the anisotropic quasielastic diffuse scattering suggests that polarization fluctuations present above are strongly reduced in the ordered phase. Still, the temperature dependence of the (00) Bragg reflection intensity at GPa can be remarkably well modeled assuming the order-parameter amplitude growth according to the power law with logarithmic corrections predicted for a uniaxial ferroelectric transition at the tricritical Lifshitz point.
I Introduction
Ferroelectric substances with a narrow electronic band gap have recently attracted considerable attention due to their potentially interesting thermoelectric,lees12 photovoltaic,seid10 ; seid12 and other photoactive properties.benn12A ; dand12 ; imla11 ; tiwa09 Uniaxial ferroelectric chalcogenides represent one of the best known families of ferroelectric semiconductors.benn12B In particular, solid solutions of Sn2P2S6 and Sn2P2Se6 have been recognized as extremely interesting model systems. book ; Levanyuk ; EijtSnPS ; Diehl ; moro10 ; Kosta07 ; Oleaga ; Kohutych ; Korda ; AsiGom All of them have an identical parent paraelectric structure at high temperatures () and the same ferroelectric phase at low temperatures ().Carpentier ; Barsamian86 ; Israel At ambient pressure, crystals with low Se/S concentration ratio show a direct ferroelectric-paraelectric phase transition, while those of high Se/S concentration exhibit an intermediate incommensurate (IC) phase (see Fig. 1). The IC phase evidenced in Se-rich solutionsbook ; Barsamian86 resembles a periodic array of anti-parallel ferroelectric layers with thickness of about 4 nm ( Å-1). The lower-temperature phase transition in Sn2P2Se6 could be thus narrated as a discontinuous transformation from a strictly regular ”ferroelectric nanodomain” arrangement to a structure with usual, macroscopic ferroelectric domains. This situation is known from many other so-called type-II IC ferroelectric systems, such as thiourea, BCCD, NaNO2, etc.Levanyuk The peculiarity of the Sn2P2(SexS1-x)6 solid solution is that here with decreasing value of Se/S concentration , the temperature range of the intermediate IC phase continuously decreases and finally the paraelectric-IC and IC-ferroelectric phase transition lines join near the so-called Lifshitz point (LP, see Fig. 1) at and K. Theoretically, the modulation period should diverge there.Folk93 ; Folk99 ; VysochJETFbis
Later, it was predicted that a similar LP could also occur in the temperature-pressure () phase diagram of the pure Sn2P2S6 crystal. Several experiments indeed confirmed that the phase transition line splits into two lines after crossing the point with coordinates around GPa, K. The pure Sn2P2S6 system is obviously even more attractive than the compound where, in principle, the LP-related phenomena could be obscured by compositional fluctuations inherent to solid solutions. In addition, thermodynamic analysis of various physical quantities indicated that the Landau free-energy expansion coefficient of the fourth-order term in polarization strongly decreases with pressure in Sn2P2S6.book In fact, the thermodynamic coordinates of the tricritical point (TCP), at which this quadratic term vanishes, were predicted to fall in the vicinity of the above discussed LP. This suggests that the fortunate intersection of two special lines - the line of the TCPs and the line of LPs, known also as a tricritical Lifshitz point (TCLP) - might be reached in Sn2P2S6 under hydrostatic pressure.TCLP

However, several conflicting statements were reported about the nature of the high-pressure phase transition of Sn2P2S6. In particular, recent analysis of the specific heat anomaliesAnderson09 supports the earlier guessSli90 that the conditions for the LP are met at lower pressure than the conditions for the TCP. This means that only the LP is realized in the pressure-temperature phase diagram of Sn2P2S6. This scenario was repeatedly assumed in Refs. Sli99, ; Guranich01, ; Guranich05, ; Gerzanich08, ; look, and implies that the special point with coordinates around GPa, K is of the same nature as the LP in the temperature – concentration diagram of Sn2P2(SexS1-x)6 solid solution (see Fig. 1). On the contrary, other recent measurements, such as birefringence measurements of Ref. Zapeka11, were used to support the original scenario of the canonical theory of Ref. Vysoch89, : That the observed special point in the diagram of Sn2P2S6 is merely a TCP but surely not a LP.Zapeka11 Moreover, the absence of the LP in the phase diagram of Sn2P2S6 was also inferred from the comparisons with the Blume-Emery-Griffith’s model.Vysoch10 On the top of that, there is a considerable disagreement about the domain of stability of the high-pressure intermediate phase of Sn2P2S6 among various sources.Sli99 ; Tyagur ; Anderson09 ; Say
Despite these challenging issues, diffraction investigations of the intermediate phase of Sn2P2S6 were not reported so far and there is no direct evidence of its IC nature. The aim of this work is to bring at least a partial answer to the above raised issues by discussion of new results from high-pressure investigations of Sn2P2S6 by means of neutron scattering.
II Experimental details
The neutron scattering experiment was performed at the Laboratoire Léon Brillouin (Saclay, France) on the 2T1 thermal neutron beam and 4F2 cold neutron beam three-axis spectrometers (TASs). Spectrometers were operated with PG(002) analyzer set to the neutron wave number 2.662 Å-1 and 1.48 Å-1, respectively. The energy resolution at zero-energy transfer was 0.2 and 0.05 THz, the Q resolution about 0.01 Å-1 and 0.005 Å-1 on the 2T1 and 4F2 TASs, respectively.
The Sn2P2S6 single crystal used in this experiment was grown from melt by the Bridgeman method at Uzhgorod University. The sample ( cm3) was placed in a special helium pressure cell designed for neutron scattering experiments in a temperature range of K and under hydrostatic pressures up to about 0.6 GPa.
The crystal was mounted so that the scattering plane matched its crystallographic mirror plane (throughout the paper, we stick to the pseudo-orthorhombic unit cell defined by Å, Å, Å, and , as in Ref. ferro, ). This horizontal plane thus also contains ferroelectric polarization direction (at about out of the axis). A reasonably accessible part of the reciprocal space in such a scattering geometry is shown in Fig. 2. A rough survey of uncorrected neutron diffraction intensities of main Bragg reflections in Sn2P2S6, as detected at K and GPa in our experiment, is indicated by variably sized symbols in Fig. 2(a). Results agree fairly well with the neutron diffraction intensities calculated from structural data of the ambient-pressure paraelectric phase of Sn2P2S6 [Fig. 2(b), data at K of Ref. para, ].
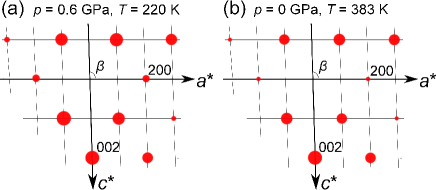
The plane of Fig. 2 is the same plane within which the satellite reflections with a modulation wave vector , demonstrating the IC phase, were observed in the Sn2P2Se6 crystal.Barsamian86 Independent x-ray and neutron scattering experimentsEijtSnPSe ; Barsamian93 agree that satellite reflections of Sn2P2Se6 are particularly strong for large momentum transfers , roughly parallel to the spontaneous polarization (). This is a consequence of the usual situation caused by the transverse character of the frozen polarization wave (), and the same can be anticipated for the supposed Sn2P2S6 satellite reflections. Clearly, detection of satellites with a very small modulation wave vector, comparable to the tails of the resolution of the instrument, could be problematic in the vicinity of a strong Bragg reflection. Unfortunately, systematic absences are common to both main and satellite reflections, that is, the satellites are expected only around the allowed reflections in the plane. For this reason, most of our measurements were taken in the vicinity of the Bragg reflection. This is an allowed reflection, but rather a weak one, and at the same time the corresponding scattering vector is almost parallel to .
III Results
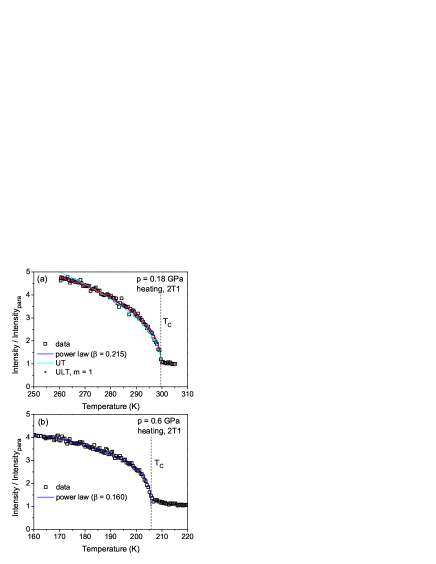
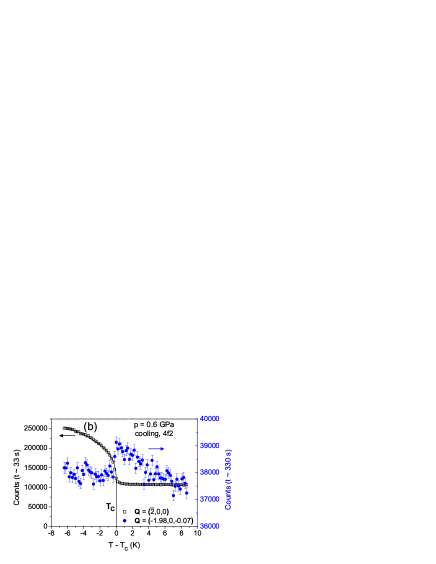
In agreement with our anticipation, the neutron diffraction intensity of the Bragg reflection in the paraelectric phase was several times smaller than in the ferroelectric phase at ambient conditions. In fact, monitoring of the reflection allowed us to probe quite accurately the ferroelectric order parameter. As an example, the temperature dependence of the Bragg reflection intensity at 0.18 GPa and 0.6 GPa is shown in Figs. 3(a) and 3(b). The intensity visibly starts to rise at a well defined temperature that can be associated with the ferroelectric phase transition. The temperatures thus obtained are given in Table I and within the possible experimental error in the pressure and temperature determination they correspond well to those derived from the compressibility anomalies reported in Ref. Sli99, .
In the vicinity of these transition temperatures, we have searched for possible indications of a satellite reflection. The pressure of 0.18 GPa is supposedly that of the TCLP, while the measurements at 0.3 GPa and 0.6 GPa are taken in the region where finite temperature range of the IC phase was anticipated. For example, we have recorded intensity maps in a 2D area around the Bragg reflection, extending up to r.l.u. along both and at 0.6 GPa and temperatures of 205.5, 206, and 206.5 K (at 0.2, 0.7, and 1.2 K above K) and similar maps were recorded also at 0.3 GPa and temperatures 267, 270, 273, and 276 K ( K). However, no obvious satellite peaks have been seen.
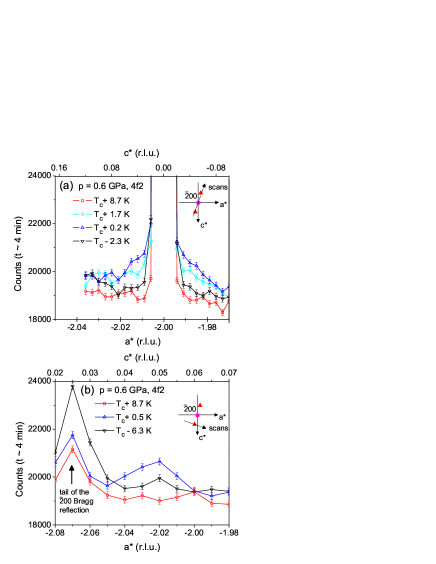
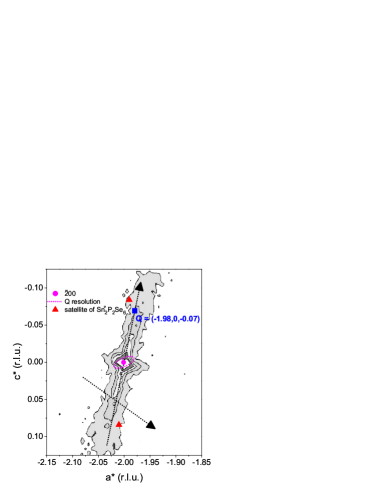
At the same time, our observations disclosed traces of weak and broad diffuse scattering ridges, extending over the ”soft” direction, roughly perpendicular to the direction along which the spontaneous polarization is formed. Figure 4(a) shows an example of a scan taken along this diffuse scattering ridge at several temperatures. Examples of transverse scans are shown in Fig. 4(b). Trajectories of these scans are schematically shown in Fig. 5, along with the contour plots of the ambient-pressure diffuse scattering topography taken from Ref. Hlinka05, . Note that the diffuse scattering ridge corresponds to the smaller peak in Fig. 4(b), while the larger intensity peak is merely a spurious leakage of Bragg reflection scattering due to the strongly anisotropic tails of the instrumental resolution function.
Some of the scans displayed in Fig. 4(a) show a non-monotonic intensity decay with the distance from the Brillouin zone center. However, due to the considerable background intensity caused by high-pressure-cell environment, this can hardly be considered as a significant indication of incommensurate satellite reflections. Rather, the anisotropy of this diffuse scattering is obvious and strikingly similar to the critical fluctuations previously seen by x-ray scattering at ambient pressure conditions.Hlinka05 The assignment of the diffuse scattering to the order-parameter fluctuations is further corroborated by the observed increase in its intensity as the transition is approached from above and by its rather abrupt reduction just below the phase transition point [see full points in Fig. 6(b)]. Moreover, few constant- spectra taken at selected positions in the high-temperature phase [Fig. 6(a)] suggest that this diffuse scattering is quasielastic in its nature, with FWHM of the order of 0.2 THz. It will be shown in the next section that several important conclusions can be drawn from such measurements, even though the high elastic and inelastic scattering background did not allow their more quantitative analysis.
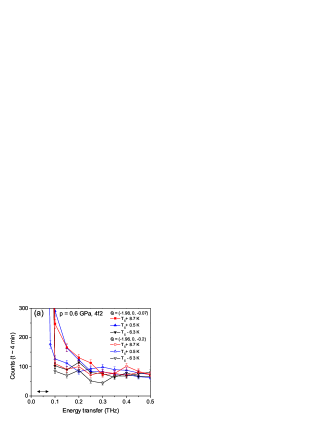
(a) selected constant-Q scans for several temperatures, (b) principal Bragg reflection intensity at q and elastic diffuse scattering at q .
IV Discussion
Absence of the TCLP, three alternative scenarios. Summarizing, our results do not provide any support for the LP in the phase diagram of Sn2P2S6 up to the hydrostatic pressure values of about 0.6 GPa. Thus, the most natural conclusion seems to be that there is no IC phase in this region at all (”scenario A”). The absence of any clear evidence for the LP in the above displayed observations led us nevertheless to perform detailed and careful comparisons of our results with those of previously reported experiments, which did confirm the presence of the LP. In particular, we have traced the phase diagram of Sn2P2S6 (see Fig. 7) according to the reported anomalies in the compressibility data (Ref. Sli99, , circles in Fig. 7) and in the dielectric permittivity data (Ref. Tyagur, , triangles in Fig. 7). Both these measurements suggest splitting of the phase transition in Sn2P2S6 () at around GPa, K, which was naturally interpreted as the expected LP. At the same time, the stability range of the anticipated intermediate phase is markedly different in these two measurements: It opens at the rate of about K/GPa according to Ref. Tyagur, (”scenario B”), while there is only about K/GPa opening rate deduced from measurements of Ref. Sli99, (”scenario C”).
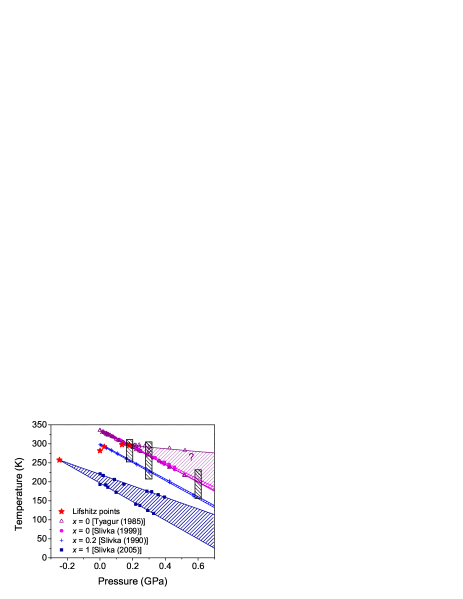
It is also instructive to compare these data with the phase diagram of the Sn2P2Se6 crystal, in which the IC phase was firmly established at least at ambient pressure. In fact, the temperature range of the IC phase of Sn2P2Se6 (limited by pairs of square symbols in Fig. 7) opens at a rate of about K/GPa, which is just an intermediate value between the two visibly conflicting values given for Sn2P2S6 (20 and 190 K/GPa, respectively). Let us note that the similar data for the solid solution crystals (cross symbols, Ref. Sli90, ) and the solid solution crystals (Ref. Sli90, , not included in Fig. 7), suggest already a quite narrow range of the IC phase, which seems to be much more consistent with the narrow IC phase for Sn2P2S6 (scenario C). The latter tendency could be also easily associated with the fact that the IC phase temperature range width is strongly decreasing with the S/Se ratio at ambient pressure (see Fig. 1). Nevertheless, the phase stability of the IC phase is a strongly nonlinear function of the Se concentration at ambient pressure (see Fig. 1) and so it could be a non-monotonous function of the Se concentration at higher pressures.
In spite of these disagreements about the temperature range of the IC phase in Sn2P2S6, results of Ref. Sli99, (scenario C) and Refs. Tyagur, , Anderson11, (scenario B) agree well about its onset at about GPa, K. This location of the LP appears to be fairly well consistent with coordinates of LPs reported for the several solid solutions with different Se concentrations (LPs are denoted by star symbols in Fig. 7). Likewise, the ”theoretical” LP of the Sn2P2Se6 compound, obtained by extrapolating of the experimental paraelectric-IC and the IC-ferroelectic phase transition temperatures towards negative pressure values (see Fig. 7), seems to lie on a more or less straight line in the projected diagram.
Elimination of the scenario B by continuity arguments. So how credible is the outcome of the present result with respect to the previous experiments? Perhaps the most significant advantage of the present experiment is that here we employed a scattering technique, which allows us to appreciate the amplitude of the order parameter as well as its wave vector. In particular, it is important that our experiments positively prove that the zone-center ferroelectric order parameter vanishes at temperatures given in Table I in a fairly continuous manner. It is well known that virtually all displacement-type IC dielectrics obey the standard continuity paradigm supported by the Landau theoryLevanyuk : (i) the phase transition from the paraelectric to the IC phase is a continuous transition, and (ii) the modulated-ferroelectric ”lock-in” transition is a first-order phase transition but with a relatively moderate jump of the modulation amplitude. Thus, already from these results, there is no space for an IC phase above temperatures given in Table I. Based on this argument, we can safely refute the phase diagram with a broadly opened IC phaseAnderson11 ; Tyagur (scenario B).
In order to make our conclusion even more convincing, let us recall that the atomic positions in the vicinity of the ferroelectric structural transition can be approximately expressed through the paraelectric reference ones () by means of the frozen order-parameter amplitude and corresponding eigenvector as
| (1) |
Inserting this into the standard expression for the elastic neutron scattering structure factor
| (2) |
where is the neutron scattering length, is the Debye -Waller factor of the th atom, and is the scattering vector and keeping the leading term in , one obtains the reliable and frequently exploited relation
| (3) |
This expression implies that the order parameter is modifying the elastic coherent neutron scattering intensity as
| (4) | |||||
Thus, the extraneous contribution to the Bragg reflection intensity is proportional to the square of the ferroelectric order-parameter amplitude (). Moreover, it can be shown, that for a long-wavelength IC phase of type II, the second term in the above expression also quite well approximates the satellite reflection intensity. Consequently, the intensity by which the principal reflection is increased just below the lock-in transition should be comparable to the intensity of the satellite reflection just above the lock-in transition.
In other words, one may expect that above the lock-in phase transition, the satellite reflection in the vicinity of the Bragg reflection should have about the same intensity as the order-parameter-related part of the Bragg reflection intensity itself. Here in our measurements (see Fig. 3) the anomalous intensity of the Bragg reflection decreases considerably and continuously as the temperature approaches the transition temperature (given in Table I). from below, and thus we know that the order parameter vanishes there completely. This suggests that such transition cannot be a lock-in transition, and a modulated phase persisting above this temperature as proposed from the diagram of Refs. Anderson11, ; Tyagur, (scenario B) can hardly be expected.
Comparison of scenarios of A and C. Therefore, the only possibility on how to reconcile our observation with a hypothesis of an IC phase is to assume that it exists below the transition temperatures of Table I. This could happen for a modulation wave vector smaller than the momentum resolution, as then the satellite reflection intensity would be integrated into the Bragg reflection scattering. Since a systematic broadening of the Bragg reflection was not noticed in our experiments, it would mean that the modulation period is of the order of 100 nm. The phase transition temperature of Table I would correspond to a paraelectric-IC phase transition . This is in an acceptable agreement with phase transition temperatures given by Ref. Sli99, (scenario C).
From the same work,Sli99 one may infer that the lock-in transitions would fall at about 3 K (5 K) below at 0.3 GPa (at 0.6 GPa). Obviously, a small jump of the order-parameter amplitude at these temperatures can hardly be identified in our data. In principle, this scenario seems to be compatible also with the birefringence data in Ref. Say, . There are indeed tiny jumps in the temperature dependence of the anomalous part of the birefringence of Sn2P2S6 at high pressures, even though the data alone were not considered as significant.Say At the same time, very similar jumps were observed at the well established temperature in the temperature dependence of the birefringence data of Sn2P2Se6, and they are also quite small,UFZ1 ; UFZ2 ; UFZ3 despite a much broader range of the IC phase there and presumably more abrupt lock-in transition. Let us note that in contrast, the compressibility data of Ref. Sli99, show a larger anomaly at the presumed transition, while is barely noticeable. The compressibility anomalies, however, do not directly scale with the order-parameter amplitude. On the contrary, it is likely that the compressibility anomalies are sensitive to the modulation period, similarly as it was demonstrated for example in the case of modulated phases of BCCD.HlinkaBCCD Therefore, the large compressibility anomaly at might be compatible with scenario C as well.
Several possible experimental problems that might be at the origin of the contradictory reports on the splitting of the phase transition in Sn2P2S6 have been recently discussed for example in Ref. Say, . Perhaps the most serious is the peculiar sensitivity of Sn2P2(SexS1-x)6 solid solutions to the absorption of light. It was reported that an crystal irradiated by 0.5 W krypton (647 nm) laser radiation shows two close anomalies in the temperature dependence of the light transmission even though the crystal with this composition has nominally a single continuous phase transition.VysochJETF We speculate that this partly understood photovoltaic or photoelastic phenomenon could be responsible for the extraneous anomalies that are behind ”scenario B” (experiments reported in Ref. Tyagur, ). However, strictly speaking, same worries apply to the experiments supporting the narrow IC phase (scenario C).
| (GPa) | (K) | heating rate (K/min) | |
|---|---|---|---|
| 0.18 | |||
| 0.3 | |||
| 0.6 |
| system | du | |||||
|---|---|---|---|---|---|---|
| U | 3 | 0* | * | 1* | ||
| T | 3 | * | * | 1* | ||
| UT | 1 | - | ||||
| ULT, | 3 | * | * | 1* |
Order-Parameter fluctuations. Additional support for scenario A can be derived from the observations of the temperature dependence of the critical fluctuations of the order parameter. In displacive ferroelectrics, the intensity of the associated quasielastic diffuse scattering is typically proportional to , where is the soft mode frequency at a given wavevector. Therefore, the increase of the critical scattering in the vicinity of the phase transition is directly associated with soft branch frequency lowering. In the incommensurate phase, the soft mode branch is split into two branches, called phason branch and amplitudon branch, respectively.Levanyuk ; Currat Obviously, the diffuse scattering is mainly determined by the lower frequency phason branch.thiourea Since for small modulation amplitudes the phason gap remains zero, the phason branch and the diffuse scattering does not show much temperature evolution within the range of incommensurate phase.thiourea ; Levanyuk ; Currat
The critical quasielastic diffuse scattering observed within a few degrees above the phase transition in present experiments (at 0.6 GPa, see Figs. 4 and 6) can be indeed well understood as due to an overdamped soft mode branch. In particular, the pronounced temperature dependence of the diffuse scattering intensity shown in Fig. 6(b) (data corresponding to the right-hand side scale) suggests soft mode frequency lowering upon approaching the nominal transition temperature from above. Such temperature dependence is typical for a paraelectric phase, but not for an incommensurate phase. At the same time, the steep intensity drop below suggests marked stiffening of the soft mode frequency. This can be indeed expected for a ferroelectric phase transition with a partial order-disorder character (see discussion in Refs. Dvorak, ; Padlewski, ) and it is in agreement with direct measurements of both the static dielectric permittivity temperature dependence and the soft-mode frequency temperature dependence (Ref. Volkov, ) near ambient-pressure phase transition of Sn2P2S6.
As already mentioned, the quasielastic, that is, dynamical nature of this diffuse scattering intensity is apparent from Fig. 6(a). Spectra taken in the immediate vicinity of suggest a bell-shaped quasi-elastic intensity component with FWHM of the order of 0.2 THz, that is, visibly exceeding the instrumental energy resolution. Dynamic critical fluctuations with relaxational frequencies of the order of 0.2 THz would fit quite well with typical relaxation frequencies expected for soft mode fluctuations in the system (for an overdamped soft phonon mode, the relaxational frequency is about , where is the damping of the soft phonon mode.) Moreover, the quasielastic signal which for temperatures near would reach the values of the order of 1000 counts at zero energy transfer in Fig. 6(a) (extrapolation of full symbols to zero-energy) does match quite nicely the 200 counts per minute of the q-dependent and T-dependent diffuse signal apparent from Figs. 4 and 6(b). Thus, in brief, all the observations considered here are in a rather good agreement with the scenario of a simple paraelectric- ferroelectric phase transition (scenario A).
Critical behavior of the order parameter. There has been considerable interest in theoretical understanding of the critical behavior of uniaxial ferroelectrics near the TCLP and many previous studies analyzed phase transition anomalies of Sn2P2S6 and derived solid solutions with the hope to determine the critical exponents relevant to its unconventional universality class. Since the phase diagram itself is far from being established, we did not try to enter into the problem of the critical phenomena. Nevertheless, for the sake of comparison with other studies, we have analyzed our order-parameter data with the usually assumed power law dependence on the reduced temperature . Interestingly, the critical exponent obtained from the adjustment of the formula (4) with to the experimental data (see Fig. 3) was substantially lower than the mean-field value of 0.5. This result is in contradiction with the analysis of Refs. Guranich01, and Guranich05, . On the other hand, our values of measured above = 0.18 GPa are nicely joining those obtained below from the spontaneous polarization (respectively pyroelectric coefficient) data of Sn2P2(Se0.04S0.96)6.Sli90 Moreover, by far the best fit [see Fig. 3(a)] was obtained for adjustment to the expected logarithm-corrected power lawLarkin69 ; Folk93 ; Aharony73
| (5) |
with and , that is, values imposed according to the predictions for the critical behavior in the vicinity of a TCLP of an uniaxial ferroelectricFolk93 (see Table II.).
V Conclusion
In conclusion, this paper clarifies the nature of the ferroelectric phase transition in the Sn2P2S6 single crystal under a moderate hydrostatic pressure (up to 0.6 GPa). The neutron diffraction experiments indicate clearly that the ferroelectric order parameter vanishes in a fairly continuous manner at a well-resolved transition temperature. In spite of considerable efforts, no evidence of an intermediate incommensurate phase was obtained. While we cannot fully exclude the existence of an extremely long-wavelength modulation below the phase transition temperature, the most simple explanation of our observations is that at least up to 0.6 GPa, there is only a simple paraelectric-ferroelectric phase transition in Sn2P2S6. Still, the temperature dependence of the order parameter happens to be best reproduced by the logarithm-corrected power law expected for a uniaxial ferroelectric system in the vicinity of a TCLP. Thus, it is quite possible that the thermodynamical properties of the Sn2P2S6 compound and derived solid solutions may reflect the theoretical closeness to the ideal TCLP behavior and so it should be taken into account in analysis of the data.
Acknowledgments
The work was partly supported by the Grant Agency of the Czech Republic (Project No. P204/10/0616 and No. 202/09/H041) and by project No. SVV-2012-265307. Y.V. is grateful for the support during the visit to LLB, and all authors thank François Maignen, Stéphane Pailhès and Patrick Baroni for technical supports at LLB. K.Z.R. gratefully acknowledges past support from the Alexander von Humboldt Foundation, Germany, and current support from the Young Investigators Group Programme of the Helmholtz Association, Germany, contract VH-NG-409.
References
- (1) S. Lee, J. A. Bock, S. Trolier-McKinstry and C. A. Randall, J. Eur. Ceram. Soc. 32, 3971 (2012).
- (2) S. Y. Yang, J. Seidel, S. J. Byrnes, P. Shafer, C.-H. Yang, M. D. Rossell, P. Yu, Y.-H. Chu, J. F. Scott, J. W. Ager III, L. W. Martin and R. Ramesh, Nat. Nanotechnol. 5, 143 (2010).
- (3) J. Seidel, D. Fu, S.-Y. Yang, E. Alarcón-Lladó, J. Wu, R. Ramesh and J. W. Ager III, Phys. Rev. Lett. 107, 126805 (2011).
- (4) J. W. Bennett, K. F. Garrity, K. M. Rabe and D. Vanderbilt, Phys. Rev. Lett. 109, 167602 (2012).
- (5) D. Daranciang, M. J. Highland, H. Wen, S. M. Young, N. C. Brandt, H. Y. Hwang, M. Vattilana, M. Nicoul, F. Quirin, J. Goodfellow, T. Qi, I. Grinberg, D. M. Fritz, M. Cammarata, D. Zhu, H. T. Lemke, D. A. Walko, E. M. Dufresne, Y. Li, J. Larsson, D. A. Reis, K. Sokolowski-Tinten, K. A. Nelson, A. M. Rappe, P. H. Fuoss, G. B. Stephenson and A. M. Lindenberg, Phys. Rev. Lett. 108, 087601 (2012).
- (6) M. Imlau, V. Dieckmann, H. Badorreck and A. Shumelyuk, Opt. Mater. Express 1, 953 (2011).
- (7) D. Tiwari and S. Dunn, J. Mater.Sci. 44, 5063 (2009).
- (8) J. W. Bennett and K. M. Rabe, J. Solid State Chem. 195, 21 (2012).
- (9) Yu. M. Vysochanskii, T. Janssen, R. Currat, R. Folk, J. Banys, J. Grigas and V. Samulionis, Phase Transitions in Phosphorous Chalcogenide Ferroelectrics (Vilnius University, Vilnius, 2006).
- (10) R. Blinc and A. P. Levanyuk, Incommensurate Phases in Dielectrics, Vol. 1 (Amsterdam: North-Holand, 1986).
- (11) S. W. H. Eijt, R. Currat, J. E. Lorenzo, P. Saint-Gregoire, B. Hennion and Yu. M. Vysochanskii, Eur. Phys. J. B 5, 169 (1998).
- (12) H. W. Diehl, M. A. Shpot and R. K. P. Zia, Phys. Rev. B 68, 224415 (2003).
- (13) K. Z. Rushchanskii, Yu. M. Vysochanskii and D. Strauch, Phys. Rev. Lett. 99, 207601 (2007).
- (14) A. Kohutych, R. Yevych, S. Perechinskii, V. Samulionis, J. Banys and Yu. M. Vysochanskii, Phys. Rev. B 82, 054101 (2010).
- (15) A. Oleaga, A. Salazar, A. A. Kohutych and Yu. M. Vysochanskii, J. Phys.: Condens. Matter 23, 025902 (2011).
- (16) V. Yu. Korda, S. V. Berezovsky, A. S. Molev, L. P. Korda and V. F. Klepikov, Physica B 407, 3388 (2012).
- (17) A. N. Morozovska, E. A. Eliseev, J. J. Wang, G. S. Svechnikov, Yu. M. Vysochanskii, V. Gopalan and L.-Q. Chen, Phys. Rev. B 81, 195437 (2010).
- (18) A. V. Gomonnai, A. A. Grabar, Y. M. Vysochanskii, A. D. Belyayev, V. F. Machulin, M. I. Gurzan and V. Y. Slivka, Fiz. Tverd. Tela (Leningrad) 23, 3602 (1981), in Russian.
- (19) C. D. Carpentier and R. Nitsche, Mater. Res. Bull. 9, 1097 (1974).
- (20) T. K. Barsamian, S. S. Khasanov, V. Sh. Shekhtman, Yu. M. Vysochanskii and V. Yu. Slivka, Ferroelectrics 67, 47 (1986).
- (21) R. Israel, R. de Gelder, J. M. M. Smits, P. T. Beurskens, S. W. H. Eijt, Th. Rasing, H. van Kempen, M. M. Maior and S. F. Motrija, Z. Kristall. 213, 34 (1998).
- (22) R. Folk and G. Moser, Phys. Rev. B 47, 13992 (1993).
- (23) R. Folk, Phase Trans. 67, 645 (1999).
- (24) Yu. M. Vysochanskii, V. G. Furtsev, M. M. Khoma, A. A. Grabar, M. I. Gurzan, M. M. Mayor, S. I. Perechinskii, V. M. Rizak and V. Yu. Slivka, Zh. Eksp. Teor. Fiz. 91, 1384 (1986) [Sov. Phys. JETP 64, 816 (1986)].
- (25) Yu. M. Vysochanskii and V. Yu. Slivka, Sov. Phys. Usp. 35, 123 (1992).
- (26) O. Andersson, O. Chobal, I. Rizak and V. Rizak, Phys. Rev. B 80, 174107 (2009).
- (27) A. G. Slivka, E. I. Gerzanich, P. P. Guranich and V. S. Shusta, Ferroelectrics 103, 71 (1990).
- (28) A. G. Slivka, E. I. Gerzanich, P. P. Guranich, V. S. Shusta and V. M. Kedyulich, Condens. Matter Phys. 2, 415 (1999).
- (29) P. P. Guranich, R. V. Kabal, A. G. Slivka and E. I. Gerzanich, Ukr. J. Phys. Opt. 2, 179 (2001).
- (30) P. P. Guranich, A. G. Slivka, V. S. Shusta, O. I. Gerzanich and I. Yu. Kuritsa, Ferroelectrics 316, 177 (2005).
- (31) E. I. Gerzanich, Ukr. J. Phys. Opt. 9, 129 (2008).
- (32) See Fig. 1. in Ref. Sli90, .
- (33) B. Zapeka, O. Mys and R. Vlokh, Ferroelectrics 418, 143 (2011).
- (34) Yu. M. Vysochanskii, M. M. Mayor, V. M. Rizak, V. Yu. Slivka and M. M. Khoma, Zh. Eksp. Teor. Fiz. 95, 1355 (1989) [Sov. Phys. JETP 68, 782 (1989)].
- (35) Yu. M. Vysochanskii, A. A. Kohutych, A. V. Kityk, A. V. Zadorozhna, M. M. Khoma and A. A. Grabar, Ferroelectrics 399, 83 (2010).
- (36) G. Dittmar and H. Schafer, Z. Naturforsch. B 29, 312 (1974).
- (37) B. Scott, M. Pressprich, R. D. Willet and D. A. Cleary, J. Solid State Chem. 96, 294 (1992).
- (38) S. W. H. Eijt, R. Currat, J. E. Lorenzo, P. Saint-Gregoire, S. Katano, T. Janssen, B. Hennion and Yu. M. Vysochanskii, J. Phys.: Condens. Matter 10, 4811 (1998).
- (39) T. K. Barsamian, S. S. Khasanov and V. Sh. Shekhtman, Ferroelectrics 138, 63 (1993).
- (40) V. Petricek, M. Dusek and L. Palatinus, Jana2006, the crystallographic computing system. Institute of Physics AS CR, Prague, Czech Republic (2006).
- (41) J. Hlinka, R. Currat, M. de Boissieu, F. Livet and Yu. M. Vysochanskii, Phys. Rev. B 71, 052102 (2005).
- (42) A. G. Slivka, V. M. Kedyulich and E. I. Gerzanich, Ferroelectrics 317, 89 (2005).
- (43) Yu. Tyagur, E. I. Gerzanich and A. G. Slivka, Sov. Phys. J. 28, 739 (1985).
- (44) O. Andersson, O. Chobal, I. Rizak, V. Rizak and V. Sabadosh, Phys. Rev. B 83, 134121 (2011).
- (45) A. Say, O. Mys, D. Adamenko, A. Grabar, Y. Vysochanskii, A. Kityk and R. Vlokh, Phase Trans. 83, 123 (2010).
- (46) Yu. M. Vysochanskii, S. F. Motrja, S. I. Perechinskii, V. M. Rizak, I. M. Rizak and V. Yu. Slivka, Ukr. fiz. Zh. 36, 728 (1991).
- (47) See Ref. book, , Fig. 3.25, page 167.
- (48) I. M. Rizak, V. M. Rizak, S. I. Perechinskii, Yu. M. Vysochanskii and V. Yu. Slivka, Ferroelectrics 143, 67 (1993).
- (49) J. Hlinka, M. Iwata and Y. Ishibashi, J. Phys. Soc. Jpn. 68, 126 (1999).
- (50) Yu. M. Vysochanskii, V. G. Furtsev, M. M. Khoma, M. I. Gurzan and V. Yu. Slivka, Zh. Eksp. Teor. Fiz. 89, 939 (1985) [Sov. Phys. JETP 62, 540 (1985)].
- (51) A. I. Larkin and D. E. Khmel nitskii, Zh. Eksp. Teor. Fiz. 56, 2087 (1969) [ Sov. Phys. JETP 29, 1123 (1969)].
- (52) A. Aharony, Phys. Rev. B 8, 3363 (1973).
- (53) J. Hlinka, J. Petzelt, B. Brezina and R. Currat, Phys. Rev. B 66, 132302 (2002).
- (54) R. Currat and T. Janssen, Solid State Phys. 41, 201 (1988).
- (55) J. Hlinka, T. Janssen and V. Dvorak, J. Phys.: Condens. Matter 11, 3209 (1999).
- (56) S. Padlewski, A. K. Evans, C. Ayling and V. Heine, J. Phys.: Condens. Matter 4, 4895 (1992).
- (57) A. A. Volkov, G. V. Kozlov, N. I. Afanas’eva, Yu. M. Vysochanskii, A. A. Grabar and V. Yu. Slivka, Sov. Phys. Solid State 25, 1482 (1983).