Diffusion of Small Molecules in Metal Organic Framework Materials
Abstract
Ab initio simulations are combined with in situ infrared spectroscopy to unveil the molecular transport of H2, CO2, and H2O in the metal organic framework MOF-74-Mg. Our study uncovers—at the atomistic level—the major factors governing the transport mechanism of these small molecules. In particular, we identify four key diffusion mechanisms and calculate the corresponding diffusion barriers, which are nicely confirmed by time-resolved infrared experiments. We also answer a long-standing question about the existence of secondary adsorption sites for the guest molecules, and we show how those sites affect the macroscopic diffusion properties. Our findings are important to gain a fundamental understanding of the diffusion processes in these nano-porous materials, with direct implications for the usability of MOFs in gas sequestration and storage applications.
pacs:
68.43.Bc, 68.43.Mn, 84.60.-h, 84.60.VeDistressing scenarios of fossil-fuel shortages and greenhouse effects have intensified scientific efforts in seeking innovative materials for energy storage and capture of greenhouse gases. Due to their vast range of tunable properties, metal organic framework (MOF) materials are outstanding candidates to address both issues. They can have large hydrogen-storage capacities, surpassing the US DOE storage targets Furukawa07 ; Murray09 ; new_targets , and have even been declared DOE’s top priority at its 2012 Hydrogen and Fuel Cells Program Annual Review Meeting ARM . On the other hand, due to their large CO2 uptakes Bao11 ; Britt09 , MOFs are also interesting for carbon-capture applications. These qualities, combined with their low production cost, have made MOFs the target of many studies, focusing mostly on their adsorption properties Yang10 ; new_targets ; Murray09 ; Li09 ; Li11 . However, their performance for practical storage and capture applications also critically depends on the diffusion and interaction of gases (e.g. with water) in the MOF environment, which are currently poorly understood Britt08 ; Britt09 ; Glover11 .
To address this issue and elucidate the diffusion process of small molecules in the nano-pores of MOFs, we use a combination of ab initio simulations and in situ infrared (IR) spectroscopy. Specifically, we study the diffusion of H2, CO2, and H2O in MOF-74-Mg and investigate the role of water on diffusion of small molecules. We focus on this particular MOF, as it has attracted a lot of attention due to its enhanced reactivity with small molecules, caused by the exposure of open metal sites in its nano-pores. Britt et al. Britt09 have shown that MOF-74-Mg is extremely efficient in capturing CO2, compared to iso-structural MOFs with other metal sites such as Zn, Mn, Fe, Co, Ni, and Cu.
To model the molecular diffusion in the MOF structure, we use climbing-image nudged elastic band Henkelman00 (NEB) simulations coupled with density functional theory (DFT), as implemented in QuantumEspresso Giannozzi09 . To correctly capture the weak van der Waals forces—which are critical in this study—we use the truly non-local functional vdW-DF Dion07 ; Thonhauser07 ; Langreth09 , which has already been successfully applied to a number of related studies Yao12 ; Kong09 ; Kong09B ; Kong11 ; Perez10 . We use ultrasoft pseudopotentials with wave-function and density cutoffs of eV and eV, respectively. Tests show that -point calculations are sufficient and yield total energies converged to within 5 meV with respect to denser k-point meshes; however, energy differences—important for our diffusion barriers—are converged to within less than 1 meV. The self-consistency tolerance was set to eV and during optimizations the total forces were relaxed to less than eV/Å. We started from the experimental MOF-74-Mg structure, optimizing the internal parameters and keeping the lattice constants fixed to the hexagonal structure with space group and Å and Å Wu09 .
We begin by revisiting the binding characteristics of H2, CO2, and H2O in the MOF framework, which serves here as background for explaining the molecular transport—recent theoretical Valenzano10 ; Valenzano11 ; Nijem12 and experimental Valenzano10 ; Nijem12 ; Nijem10 ; Zhou08 ; Queen11 work has fully explored and clarified both origin and nature of the “static” adsorption interactions of H2 and CO2 in MOF-74. Our calculated adsorption energies are given in Table 1 for two different loadings: (i) low-loading, one molecule per cell, and (ii) high-loading, six molecules per cell completely saturating all available metal sites (see Fig. 1a and Fig. 1a’ for a graphical representation of these loadings). From the computed vibrational frequencies (see below) we obtain the thermal and zero-point energy (ZPE) corrections to the adsorption energy, allowing for a more accurate comparison to measured adsorption heats. But, we find that neither of these corrections has a large effect in our case. Overall, we find very good agreement with the experimental adsorption energies of –0.11 0.003 eV for H2 Zhou08 and –0.49 0.010 eV for CO2 Valenzano10 , attesting to the importance of correctly including van der Waals interactions in these simulations. The 0.03 eV decrease of for H2O in the high-loading situation is linked to the intermolecular repulsions between hydrogen atoms of H2O adsorbed on adjacent Mg sites. This is also evident from the intermolecular distance , which increases from 2.197 Å for the low-loading case to 2.232 Å for the high-loading case. As a result of the large dipole moment of water (1.9 Debye), it binds very strongly Murray09 . Thus, water is thermodynamically much more likely to occupy metal sites, significantly reducing the MOF’s adsorption capabilities towards H2 and CO2, with tremendous importance for storage and capture applications.
| Molecule | Loading | |||
|---|---|---|---|---|
| H2 | 1 | –0.15 | –0.15 | –0.15 |
| 6 | –0.16 | –0.16 | –0.16 | |
| CO2 | 1 | –0.50 | –0.49 | –0.50 |
| 6 | –0.50 | –0.49 | –0.50 | |
| H2O | 1 | –0.79 | –0.76 | –0.76 |
| 6 | –0.76 | –0.73 | –0.73 |
While the uncoordinated Mg sites are the most attractive sites, secondary binding sites also exist, which only become occupied at lower temperatures (or high pressures). Recent neutron diffraction experiments isolated such a secondary binding site for CO2 in MOF-74-Mg Queen11 , where the CO2 binds to the carboxylate group of the linker. The experimental geometry of this site is well reproduced by our vdW-DF calculations Nijem12 . For very high loading, i.e. 12 CO2 molecules per unit cell (occupying the primary and secondary sites) the inter-molecular repulsions decrease the average to –0.48 eV.
Vibrational frequencies are a prerequisite to estimate the pre-exponential factor in the Arrhenius transport equation. We report here the calculated change in IR frequency between the gas-phase molecules and the molecules adsorbed in the MOF. In the mono-adsorbed cases we find = –30 cm-1, = –13 cm-1, and = –103 cm-1, in excellent agreement with our experimental observations of –36 cm-1, –8 cm-1 and –99 cm-1. Experimentally, there is a small difference in frequency change between low and high loading, resulting in a red-shift of –3 cm-1 and –15 cm-1 for the asymmetric stretch mode of CO2 and H2O (see supplementary material). Computationally, we find = –1 cm-1 and = –18 cm-1, in excellent agreement with experiment.
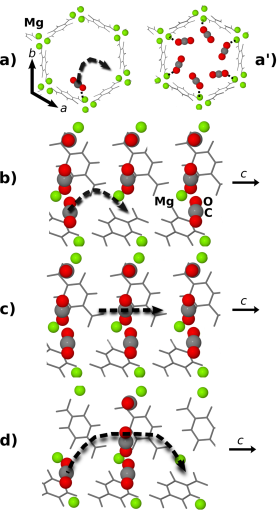
We now move our discussion to the key results of this letter: The molecular transport in MOF-74-Mg. To study this aspect, we consider the four diffusion mechanisms depicted in Fig. 1. In mechanism a), a molecule hops circularly from one Mg2+ site to its adjacent one. Note that this mechanism is not responsible for molecular transport into the MOF, but nevertheless it is an important process for redistributing the load. In mechanism b), one molecule hops longitudinally (along the c-axis) from one Mg2+ to the equivalent one in the next unit cell. In mechanism c), one molecule moves longitudinally through MOF-74 fully loaded with the same type of molecule. And finally, in mechanism d), one molecule pre-adsorbed on a Mg2+ site moves through a barrier made by six molecules and then binds again at the equivalent site two unit cells further down. We consider those the fundamental diffusion mechanisms that control the macroscopic molecular transport in MOF-74-Mg. Other paths by good approximation are superpositions of the ones discussed here. Mechanism c) simulates real diffusion and is responsible for penetration deep into the MOF, once the surface is fully saturated. Mechanism d) simulates the kinetic barrier that a pre-adsorbed molecule must overcome when the adjacent available metals sites have already been saturated, i.e. obstructing the flux of an incoming molecule. Note that co-diffusion cases are not considered here. For the study of mechanism a) we used the hexagonal primitive cell with 54 atoms. For mechanism b), c), and d)—requiring a longitudinal displacement of the molecule along the -axis—we employed a supercell containing 108 atoms, expanded along the -axis, making these calculations very challenging.
| diffusion mechanism | ||||
|---|---|---|---|---|
| a) | b) | c) | d) | |
| H2 | 0.07 (0.07) | 0.15 (0.15) | 0.005 (0.004) | 0.16 (0.16) |
| CO2 | 0.27 (0.26) | 0.29 (0.28) | 0.04 (0.03) | 0.45 (0.44) |
| H2O | 0.67 (0.64) | 0.61 (0.58) | 0.06 (0.04) | 0.73 (0.70) |
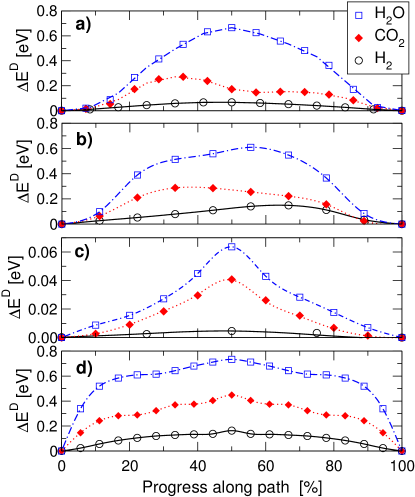
Figure 2, consistently labeled with Fig. 1, shows the calculated diffusion barriers for H2, CO2, and H2O. The barrier heights of all curves, i.e. their maxima, will be referred to as and are collected in Table 2. Not surprisingly, looking at the circular hopping mechanism a), we see that the molecules experience diffusion barriers similar in magnitudes to the adsorption energies at the metal site. For both H2 and H2O the diffusion barriers look alike and are found very symmetric. This is not the case for CO2, which shows a second minimum located at 58% (see Fig. 2a). The local geometry of this minimum is that of the secondary adsorption site detected by neutron diffraction in Ref. Queen11, . Figure 2a) shows that the secondary adsorption site becomes only activated when all the six Mg2+ sites are fully occupied, as the local minimum (5 meV) is too shallow to trap molecules even at very low temperatures. In other words, the secondary binding site only gets occupied under very high loading/pressure. Barriers calculated for mechanism b) are similar in magnitude to those of mechanism a), however, they are slightly more asymmetric. We considered mechanism b) also for situations of low-loading (not shown in Fig. 2), i.e. only one molecule occupies the unit cell and hops along the -axis. In this case, all barriers remain similar with the exception of that for water, which increases by approximately 10%, suggesting that the crowded environment helps the molecule extraction via an expulsion mechanism. Not coincidentally, the maximum of the H2O barrier of Fig. 2b) corresponds to the formation-breaking of a lateral hydrogen-bond with an oxygen nearby the Mg sites (OOHO–MOF), which decreases its strength passing from low ( = 2.077 Å) to high loadings ( = 2.138 Å). It follows that H2O experiences the largest diffusion barriers and has the highest adsorption affinity to metal sites (see Table 1).
Although not immediately obvious from Fig. 2b), for H2 there is a small secondary minimum near the 50% mark, which is off the optimized pathway and thus does not show up in the NEB calculation. With the help of additional optimizations near that point, we confirm the presence of a secondary binding site with an adsorption energy of eV, which is 0.04 eV above the primary binding site (see Table 1). The binding pocket is relatively shallow with a depth of approximately 2 meV and the H2 is clearly “docked” on the “oxygen triangle” formed by the linkers coordinating the Mg sites. Evidence of this binding site was also found in MOF-74-Zn both theoretically Kong09 and with neutron diffraction experiments Liu08 . Our calculations thus confirm and quantify the schematic kinetic model (based on experimental evidences) proposed in Fig. 12 of Ref. Nijem10 , where the gas-phase H2 molecules first condense on the metastable second binding site, followed by a gradual migration to the more stable Mg site. Also note that the asymmetric profile for this mechanism suggests that the release of a H2 molecule from the Mg site is a direct process without intermediate steps. From this analysis we learn that at high pressure and temperature the existence of secondary binding sites assists in the quick redistribution of the molecular load, as molecules entrapped in these sites need less energy to escape from their minima. These sites thus play a crucial role in the load redistribution, affecting the final diffusion properties of incoming molecules. For example, when water is adsorbed at the primary and secondary sites, we can imagine scenarios of high hydrogen bonding reticulation, severely limiting the molecular transport of H2 and CO2.
Next, we focus on mechanism c) and d), which aim to simulate the molecular flow in the MOF. In mechanism c), we calculate the barrier for diffusion of a single molecule through a MOF fully loaded with the same type of molecule. Again, water suffers the largest impediment to flow (0.06 eV), while H2 for this mechanism is almost barrier-free (5 meV). Just recently, Bao et al. Bao11 measured for CO2 and found 0.03 eV, based on experimental CO2 adsorption isotherms. This is in perfect agreement with our computed values of 0.04 eV and 0.03 eV (ZPE corrected). Mechanism d) considers a situation where an adsorbed molecule tries to diffuse further into the MOF, hampered by the presence of a molecular barrier due to other pre-adsorbed molecules. In this case, the strong electrostatic interaction established by water with the Mg sites imposes a larger diffusion barrier for H2O when compared to CO2 and H2.
We now correlate our diffusion mechanisms at the atomistic level discussed above with our in situ time-resolved IR diffusion experiments, which provide information about the macroscopic diffusion of molecules within the MOF scaffold. To this end, we performed IR measurements with diffuse reflectance geometry using a liquid-N2 cooled Indium Antimonide detector. Approximately 12 mg of sample was mixed with 0.02 g of KBr and inserted into an atmospheric cell from Thermo scientific. The sample was heated in situ at 450 K in vacuum for complete de-solvation. The pressure was kept constant and changes were monitored as a function of time, while temperature was set to 298 K. IR spectra were recorded every 10 seconds.
By measuring the asymmetric stretch modes of both CO2 and H2O with time, we find that typical MOF loading occurs in two consecutive steps. At the beginning, the guest molecules condense in nano-pores on the surface of the MOF, leading to very high-loading in those nano-pores. From our experiments we conclude that this corresponds to approximately 9 molecules per unit cell, effectively clogging the pathways and limiting diffusion of new approaching molecules Nijem12 . This results in a red-shift (see supplementary materials), explained by increasing lateral interactions between adsorbed molecules Nijem12 . Our own calculations of the frequency shift between low and high loading from above confirm that this shift corresponds to high loading. As time progresses, molecules diffuse from highly-loaded pores to low-loading pores deeper inside the bulk of the MOF. As a result, the asymmetric mode returns (with a blue-shift, see supplementary material) to its original location. This peculiar fluctuation in frequency-shifts is a clear signal of a two-states molecular transport mechanism. In particular, the time it takes to return to the original shift—i.e. to get from high to low loading—is characteristic for the guest molecules and provides insight into the diffusion process.
We have performed the above described diffusion experiment for CO2 and H2O, and find that it takes approximately 2 hour for water to diffuse to the low-loading situation, while it takes only 22 minutes for CO2 (due to the difficulties of the experiments, we report these times with a large error bar of approximately 25%). More importantly, the ratio of those two times is 5.45. The described experimental situation clearly corresponds to diffusion through mechanism c) and we can calculate the corresponding ratio using the Arrhenius equation. To this end, we estimated the pre-exponential diffusion factor using the harmonic transition-state theory (see supplementary material) Vineyard57 . Using our barrier heights from Table 2 for CO2 and H2O for mechanism c), we find for the same ratio a value of 5.43, in excellent agreement with experiment. This confirms that we have successfully uncovered transport processes at the atomistic level, that govern the transport processes at the experimentally measured macroscopic level. Ideally, we would like to report other ratios, e.g. for H2/CO2, but the corresponding IR experiments involving H2 are very difficult and results will be published in a longer, forthcoming article.
The fact that water diffuses so much slower than H2 and CO2 is to be expected, but of paramount importance for practical applications of MOFs. While the presence of water does not hinder the initial diffusion of other gasses such as H2 and CO2 in the non-contaminated MOF structure, high pressure or temperature can affect the delicate thermodynamic equilibrium as incoming H2O molecules displace pre-adsorbed H2 and CO2 molecules.
In summary, we demonstrate that state of the art ab initio NEB simulations, coupled with time-resolved in situ IR spectroscopy, provide a complete atomistic understanding of the diffusion processes of three important molecules in MOF-74-Mg for the purpose of hydrogen storage and gas separation. Our theoretical atomistic model for the molecular transport explains experimental IR macroscopic evidences. Furthermore, our calculations clarify the two-state mechanism, observed experimentally, which controls the macroscopic diffusion of these molecules. While the present study only focuses on MOF-74-Mg, it is our belief that the same methodology can be successfully applied to unveil the molecular transport in other MOFs and nano-porous materials, providing further insight into the important question of diffusion as well as a robust theoretical foundation to guide the interpretation of challenging diffusion experiments.
This work was entirely supported by the Department of Energy Grant No. DE-FG02-08ER46491.
References
- (1) H. Furukawa, M. A. Miller, and O. M. Yaghi, J. Mater. Chem. 17, 3197 (2007).
- (2) L. J. Murray, M. Dincă, and J. R. Long, Chem. Soc. Rev. 38, 1294 (2009).
- (3) http://www.eere.energy.gov/hydrogenandfuelcells/storage/pdfs/targets_onboard_hydro_storage.pdf.
- (4) http://www.hydrogen.energy.gov/annual_review12_proceedings.html.
- (5) Z. Bao, L. Yu, Q. Ren, X. Lu, and S. Deng, J. Colloid Iterf. Sci. 353, 549 (2011).
- (6) D. K. Britt, H. Furukawa, B. Wang, T. G. Glover, and O. M. Yaghi, Proc. Nat. Acad. Sci. USA 106, 20637 (2009).
- (7) J. Yang, A. Sudik, C. Wolverton, and D. J. Siegel, Chem. Soc. Rev. 39, 656 (2010).
- (8) J.-R. Li, R. J. Kuppler, and H.-C. Zhou, Chem. Soc. Rev. 38, 1477 (2009).
- (9) J.-R. Li, Y. Ma, M. C. McCarthy, J. Sculley, J. Yu, H.-K. Jeong, P. B. Balbuena, and H.-C. Zhou, Coord. Chem. Rev. 255, 1791 (2011).
- (10) D. K. Britt, D. Tranchemontagne, and O. M. Yaghi, Proc. Nat. Acad. Sci. USA, 105, 11623 (2008).
- (11) T. G. Golver, G. W. Peterson, B. J. Schindler, D. Britt, and O. M. Yaghi, Chem. Eng. Sci. 66, 163 (2011).
- (12) G. Henkelman, B. P. Uberuaga, and H. Jónsson, J. Chem. Phys. 113, 9901 (2000).
- (13) P. Giannozzi, S. Baroni, N. Bonini, M. Calandra, R. Car, C. Cavazzoni, D. Ceresoli, G. L. Chiarotti, M. Cococcioni, I. Dabo, A. Dal Corso, S. Fabris, G. Fratesi, S. de Gironcoli, R. Gebauer, U. Gerstmann, C. Gougoussis, A. Kokalj, M. Lazzeri, L. Martin-Samos, N. Marzari, F. Mauri, R. Mazzarello, S. Paolini, A. Pasquarello, L. Paulatto, C. Sbraccia, S. Scandolo, G. Sclauzero, A. P. Seitsonen, A. Smogunov P. Umari, and R. M. Wentzcovitch, J. Phys.: Cond. Mat. 39, 395502 (2009).
- (14) M. Dion, H. Rydberg, E. Schröder, D. C. Langreth, and B. I. Lundqvist, Phys. Rev. Lett. 92, 246401 (2004).
- (15) T. Thonhauser, V. R. Cooper, S. Li, A. Puzder, P. Hyldgaard, and D. C. Langreth, Phys. Rev. B 76, 125112 (2007).
- (16) D. C. Langreth, B. I. Lundqvist, S. D. Chakarova-Käck, V. R. Cooper, M. Dion, P. Hyldgaard, A. Kelkkanen, J. Kleis, L. Kong, S. Li, P. G. Moses, E. Murray, A. Puzder, H. Rydberg, E. Schröder, and T. Thonhauser, J. Phys.: Cond. Mat. 21, 084203 (2009).
- (17) L. Kong, G. Román-Pérez, J. M. Soler, and D. C. Langreth, Phys. Rev. Lett. 103, 096103 (2009).
- (18) Y. Yao, N. Nijem, J. Li, Y. J. Chabal, D. C. Langreth, and T. Thonhauser, Phys. Rev. B 85, 064302 (2012).
- (19) L. Kong, V. R. Cooper, N. Nijem, K. Li, J. Li, Y. J. Chabal, and D. C. Langreth Phys. Rev. B 79, 081407 (R) (2009).
- (20) L. Kong, Y. J. Chabal, and D. C. Langreth Phys. Rev. B 83, 121402 (R) (2011).
- (21) G. Román-Pérez, M. Moaied, J. M. Soler, and F. Yndurain Phys. Rev. Lett. 105, 145901 (2010).
- (22) H. Wu, W. Zhou, and T. Yildirim, J. Am. Chem. Soc. 131, 4995 (2009).
- (23) L. Valenzano, B. Civalleri, K. Sillar, J. Sauer, J. Phys. Chem. C 115, 21777 (2011).
- (24) L. Valenzano, B. Civalleri, S. Chavan, G. T. Palomino, C. O. Areán, and S. Bordiga, J. Phys. Chem. C 114, 11185 (2010).
- (25) N. Nijem, P. Canepa, L. Kong, H. Wu, J. Li, T. Thonhauser, and Y. J. Chabal, J. Phys.: Cond. Mat. 24, 424203 (2012).
- (26) N. Nijem, J.-F. Veyan, L. Kong, H. Wu, Y. Zhao, J. Li, D. C. Langreth, and Y. J. Chabal, J. Am. Chem. Soc. 132, 14846 (2010).
- (27) W. Zhou, H. Wu, and T. J. Yildirim, J. Am. Chem. Soc. 130, 15268 (2008).
- (28) W. L. Queen, C. M. Brown, D. K. Britt, P. Zajdel, M. R. Hudson, and O. M. Yaghi, J. Phys. Chem. C 115, 24915 (2011).
- (29) Y. Liu, H. Kabbour, C. M. Brown, D. A. Neumann, and C. C. Ahn, Langmuir 24, 4772 (2008).
- (30) G. H. Vineyard, J. Phys. Chem. Solids 3, 121 (1957).