Translocation and encapsulation of siRNA inside carbon nanotubes
Abstract
We report spontaneous translocation of small interfering RNA (siRNA) inside carbon nanotubes (CNTs) of various diameters and chirality using all atom molecular dynamics (MD) simulations with explicit solvent. We use Umbrella sampling method to calculate the free energy landscape of the siRNA entry and translocation event. Free energy profiles shows that siRNA gains free energy while translocating inside CNT and barrier for siRNA exit from CNT ranges from 40 to 110 kcal/mol depending on CNT chirality and salt concentration. The translocation time decreases with the increase of CNT diameter with a critical diameter of 24 Å for the translocation. In contrast, double strand DNA (dsDNA) of the same sequence does not translocate inside CNT due to large free energy barrier for the translocation. This study helps in understanding the nucleic acid transport through nanopores at microscopic level and may help designing carbon nanotube based sensor for siRNA.
I Introduction
Small interfering RNA (siRNA) is 21-23 nucleotides
long double stranded RNA (dsRNA) which has been
demonstrated to treat diseases like cancer and
hepatitis. For such medical applications, siRNA
has to be delivered inside the cell without degradation
by complexing it with delivering vectors.
However, efficient method for the delivery
of siRNA to the target cell is lacking.
Carbon nanotubes (CNTs) are cylindrical
rolled graphene sheets
which have emerged as new nano material to be
used for biomedical applications due to their
potential strengths liu1 ; liu3 ; kam ; zhang .
CNTs have ultrahigh surface area
which make them suitable drug delivery vectors
through specific binding of biomolecules, drugs on
their outer surface. This unique feature along
with the other physical, thermal and optical
properties enable high throughput drug delivery
and medical imaging liu3 .
CNTs are not soluble in many solvents and also
known to be toxic to the cell.
This problem has been addressed by covalent
or non-covalent surface functionalization of CNTs
liu1 ; liu3 ; kam ; zhang . Delivery of RNA by
translocating RNA-CNT hybrid through membranes
of MCF7 breast cancer cells has also been studied lu2004 .
siRNA delivery through pristine and functionalized
CNT have been investigated by several groups in
recent years. In this delivery approach siRNA is
adsorbed on the CNT. After transfecting
siRNA-CNT hybrid inside cells, the siRNA
dissociates from the CNT. Recently we have shown that
siRNA can adsorb onto the surface of the CNT and graphene
by unzipping its base-pairs and binds strongly with
high stability which can be used to deliver siRNA santoshjcp ; santoshgraphene .
All these studies are concerned with
siRNA adsorption/binding on CNT surface only.
In this paper, we propose encapsulation of siRNA
inside CNT as a possible delivery mechanisms.
Transport of biomolecules across cell membranes
and nanopores is an important process in living
organisms hemant_softmatter .
Single stranded DNA (ssDNA) transport in biologically
occurred nanometer scale-hemolysin ion channel has been
observed by Kasianowicz et. al. kasianowicz1996
in 1996. They observed that the translocation of ssDNA
depends on the DNA concentration, applied voltage
and structure of the nanopore. Since then, biomolecular
transport in nanopores has become a major research
activity both from fundamental and application point
of view henrickson ; lubenskinelson1999 ; meller2001 .
Polymer translocation through membranes sung1996
and nanopores muthukumar1999 ; lubenskinelson1999 ; muthukumar2001 has been studied theoretically as a
diffusion process across free energy barrier that
arises due the chemical potential gradients.
It has been found that the translocation time
is proportional to the polymer length.
Sophisticated nanopore based DNA sequencing techniques
are now-a-days feasible to determine the
sequence of DNA by measuring ionic currents
as ssDNA translocates through the nanopore
ceesdekker2007 ; branton2008 .
However, microscopic level details are necessary
for the better understanding of the
DNA sequencing at the single base-pair level
which is the
ultimate goal of DNA sequencing technology.
Translocation of ions, nucleic acids through solid state
nanopores have been studied by Dekker and co-workers
ceesdekker2006 ; ceesdekker2007 ; ceesdekker2009 .
Translocation of oligonucleotides inside CNT
have been reported as well gao2003 ; fan2005nl ; gao2007 ; gao2008 ; lim2008 ; liuscience2010 .
Recently, translocation of DNA through nanopores
in suspended graphene sheets have also been studied
experimentally that finds applications in DNA
sequencing garaj ; schneider ; christopher ; venkatesan2011 .
Based on our MD simulation studies, we propose two different methods of siRNA delivery using CNTs and graphene. The first mechanism is based on the strong adsorption of siRNA on the CNT/graphene surface santoshjcp ; santoshgraphene and the second one is by encapsulation of siRNA through translocation inside the CNT. The translocation of siRNA inside a CNT has not been studied earlier. In this paper, we report for the first time, the translocation studies of siRNA inside CNT. This translocation is driven by the favorable van der Waals (vdW) interaction between the siRNA and CNT. To understand the free energy landscape of siRNA translocation inside CNT, we have also calculated the free energy profile using Umbrella sampling method torrie ; roux ; ums for CNTs of different chirality and at different salt concentrations. The free energy profile indicates that siRNA gains energy inside CNT and faces a large energy barrier to escape from the interior of CNT. Insights into siRNA-CNT interaction and structural changes will help in understanding the microscopic picture of the siRNA delivery mechanism by CNTs. The translocation time of siRNA is decreasing with increasing the diameter of the CNT. Our simulation results can guide experimental approach for siRNA translocation inside CNT for sequencing and drug delivery applications as well. The rest of the of the paper is organized as follows: in the section II, we give the details of the simulation methods, followed by the discussion on the results of spontaneous translocation. In section III, we discuss the results on free energy landscapes using MM-GBSA as well as Umbrella sampling method. Finally in section IV, we give a summary of the main results and conclude.
II Methods
We have built single walled CNT (SWCNT) of different chiralities and diameters of length approximately 87 Å. The diameters of the built SWCNTs are 27.01 Å, 26.74 Å, 25.40 Å, 24.06 Å and 22.73 Å for (25, 15), (20, 20), (19, 19), (18, 18) and (17, 17) nanotubes respectively. We study several systems for nucleic acid translocation inside CNTs: (i) siRNA translocation mechanism inside (20, 20) CNT at 0 and 107 mM NaCl concentration to investigate the effect of salt concentration (ii) siRNA translocation inside (19, 19), (18, 18) and (17, 17) CNTs to study the effect of diameter (iii) siRNA translocation mechanism inside (25, 15) to study the effect of chirality and finally (v) dsDNA (of identical sequence except adenine instead of uracil of siRNA) translocation mechanism inside (20, 20) CNT to understand the difference between the interaction of siRNA and dsDNA with CNT. For all these cases, the siRNA/dsDNA was placed close to one of the open ends of CNT such that the CNT axis and the siRNA axis are parallel. We have used the same siRNA sequence and structure as described in our earlier publication santoshjcp ; santoshgraphene . We have used ff99 force field duan for all the simulations reported in this paper. The siRNA-CNT system is solvated with water and counterions. To make a charge neutral system for different salt concentration, appropriate number of Na+ and Cl- ions were added. The system was then subjected to standard simulation protocol maiti2004 ; maiti2006bj with periodic boundary conditions applied in all three directions. Non-bonded interactions are truncated at 9 Å and the long range electrostatic interactions were calculated with the Particle Mesh Ewald (PME) method darden . Finally for trajectory analysis, simulations are performed in constant volume-constant temperature (NVT) ensemble up to 100 ns depending on the diameter of CNT. For the Umbrella sampling method, 120-130 ns of NVT simulations are performed for each system. Full system details such as number of NaCl ions, water residues, box dimensions and total number of atoms are summarized in Table 1. To check the effect of force field, we have also performed the simulation with (20, 20) CNT and siRNA using ff10 force field yildirim .
III Results and Discussion
III.1 Translocation of siRNA inside CNTs
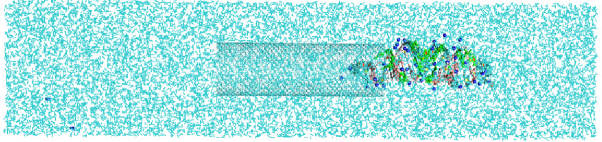
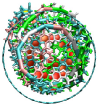
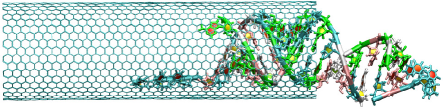
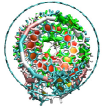
Snapshots shown in Figure 1 represent the
translocation process of siRNA inside (20, 20) CNT
at various instants of time. To present the details
of the system studied, we show the initial
siRNA-(20, 20) CNT system with counterions and water
in Figure 1(a). In Figures 1(b) to
1, we show the instantaneous snapshots
of the system in few ns interval. For clarity, water
and counterions are not shown.
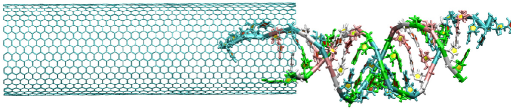
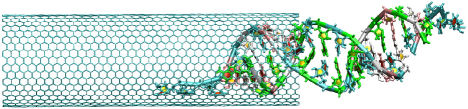
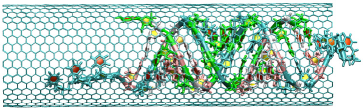
From the snapshots and subsequent analysis, we observe that
the siRNA translocates into the interior of (20, 20) CNT
from the initial configuration. The translocation
of siRNA inside (20, 20) CNT is very fast and
happens in 17.4 ns. After the translocation,
siRNA stays inside CNT with least positional
fluctuations during the remaining simulation period of 30-40 ns.
We have also observed the translocation
of siRNA at 107 mM, inside (19, 19), (18, 18) and (25, 15) CNTs.
The siRNA inside (20, 20) CNT at 0 mM has least
structural deformations compared to all other CNTs of
different diameter and chirality studied in this work.
Similar results are observed at 107 mM NaCl concentration also.
In all these cases, the siRNA is very
stable inside CNT without any further movement
after the translocation. This siRNA-CNT hybrid
can serve as siRNA delivery vector for the
delivery of siRNA for RNAi therapy.
For the siRNA release after delivery, functionalizing
siRNA with nanoparticles or application of electric
field can be used.
To understand the energetics of siRNA as it translocates inside (20, 20) CNT, we have calculated the van der Waals (vdW) interaction energy between siRNA and CNT at various instants of time. We plot as a function of the siRNA spatial position at various instants of time in Figure 2. Figure 2 shows how different parts of siRNA interact with CNT and also the interaction strength along CNT axis . In Figure 2, corresponds to the center of mass (COM) position of siRNA. For the calculation of , siRNA has been divided into 4 parts along its helix axis. The data shown in Figure 2 represents how the COM of these 4 parts of siRNA interact with CNT as it translocates. It can be seen from the Figure 2 that has different shapes at = 0 ns, 10 ns, 15 ns, 25 ns and 40 ns. Initially siRNA is outside CNT with only two sticky-ends (these are un-paired nucleobases in a nucleic acid) and one intact Watson-Crick (WC) base-pair lying inside CNT. Hence the interaction of siRNA with CNT is very less which are far apart from each other (see ns curve in Figure 2). As increases, these sticky-ends interact strongly with CNT as shown in Figure 2 at = 10 ns, 15 ns, 25 ns and 40 ns. The siRNA strongly interacts with CNT after complete translocation for ; where is the translocation time. The increase of after complete translocation is about 407 kcal/mol or 690.8 .
III.2 Free energy landscape during translocation
III.2.1 Free energy using equilibrium simulation: MM-GBSA and 2PT method
In general, the binding free energy for the non-covalent association of two molecules A and B may be written as . For any species on the right hand side , where is the enthalpy, is the absolute temperature and is the entropy of the molecule. Therefore the binding energy at constant temperature can be written as
| (1) |
The calculation of enthalpy difference () and entropy difference () contributions to the binding free energy in Eqn. 1 are done using molecular mechanics - generalized Born surface area (MM-GBSA) method and 2 phase thermodynamic (2PT) method lin2003 ; lin2010 ; pascal2011 , respectively. The change in enthalpy can be decomposed into the gas-phase energy and solvation free energy ; i.e., . For any species or complex , the gas-phase energy, is calculated from molecular mechanics using , where, is the electrostatic energy calculated from the Coulomb potential, is the non-bonded van der Waals energy and is the internal energy contribution arising from bond stretching, angle bending and dihedrals. On the other hand, the solvation free energy, can be further decomposed as electrostatic and non-electrostatic contributions; i.e., . The electrostatic energy, is calculated from Generalized Born (GB) method which assumes that the atoms in a molecule are spheres of radius (called Born radius) and have an effective charge (called Born charge). The molecule is assumed to be surrounded by a solvent of dielectric constant (80 for water at 300 K) and the solute atoms have a dielectric constant of 1. The analytic expression for the in the GB model still1990 ; srinivasan1999 is given by
| (2) |
where
| (3) |
where is the distance between atoms , and are effective Born radii and is the Debye-Hückel screening parameter. The non-electrostatic energy, is calculated as ; where is the surface tension parameter ( = 0.0072 kcal/mol-Å2; = 0 kcal/mol) and is the solvent-accessible surface area of the molecule. The entropy contribution appearing in Eqn. 1 is carried out using 2 phase thermodynamic approach proposed by Lin et. al. lin2003 ; lin2010 ; pascal2011 which is motivated by the observation that the density of states () of a liquid can be decomposed into a gas component and a solid component lin2003 ; lin2010 ; pascal2011 . The density of states function can be calculated from the Fourier transform of velocity auto-correlation function; i.e.,
| (4) |
where is the velocity auto-correlation function which is given by
| (5) |
The entropy is then calculated from the knowledge of using
| (6) |
where the partition function is given by
| (7) |
The decomposition of into
gas-phase and solid-phase is performed to get the entropy of
molecular species , or complex to get finally
the change in free energy .
The 2PT method has found successful application in several related
problems lin2003 ; maitinl ; lin2010 ; pascal2011 ; hemant ; nandy2011 .
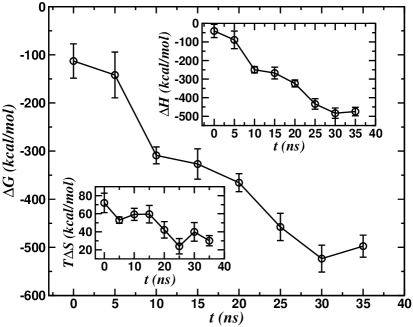
The binding free energy () as function of time is shown in Figure 3. Entropy () and enthalpy () contributions to are shown in the inset. decreases with time since the fluctuations in siRNA nucleobases are suppressed by CNT making less microstates available for siRNA as translocation progresses. However, is increasing with time and attains constant value after complete translocation. also follows similar trend since the entropy contribution is very small compared to enthalpy contribution. We plot the vdW contribution to the total binding energy in Figure 3. When siRNA and CNT are far apart in the initial stage, is very less but increases as siRNA translocates inside CNT. We also show instantaneous snapshots of the siRNA-CNT hybrid at various instants of time in Figure 3. is -900 kcal/mol after complete translocation of siRNA compared to -85 kcal/mol at the initial stage. The interaction between siRNA and CNT is driven mainly by vdW interaction (Figure 3). This is similar to our earlier results that the unzipping and adsorption of siRNA on CNT/graphene is also driven by the vdW interaction santoshjcp ; santoshgraphene . The conversion of time into distance between CNT and siRNA while plotting has been discussed in the supplementary materials supplementary .
III.2.2 Free energy using Umbrella sampling method
In the un-biased MD simulations discussed so far, siRNA has
translational motion in 1-D along nanotube axis
in order to translocate into the interior of CNT.
The free energy landscape of the siRNA
translocation process along such suitable
reaction coordinate will help in understanding
the stable and unstable states for siRNA
with respect to the CNT. In the previous
section we have described the free energy calculation
from the equilibrium un-biased MD simulation
using a combination of MM-GBSA and 2PT methods.
Such methods in equilibrium MD cannot properly
account for the sampling of high energy
states. For this reason, we use Umbrella sampling
method torrie to sample the entire phase
space along chosen reaction coordinate and calculate the free
energy profile for siRNA translocation inside CNT.
The basic idea implemented in constructing the
free energy is to add a biasing potential
to obtain sampling of less probable states
for siRNA translocation process and record
the biased histograms. This is done for a
series of biasing potentials at various values of chosen
reaction coordinate that span the entire
translocation path of interest. We make
sure that the successive histograms
have enough overlap in order to reconstruct
the un-biased free energy from biased histograms.
Below we give a brief overview of the Umbrella
sampling method. For further details, readers
are refereed to the excellent text book by
Frenkel and Smit ums .
With the unperturbed potential , we have added a biasing harmonic potential , resulting in the perturbed potential ; where is the restrained distance between the center of masses of ‘far end’ of CNT and first two Watson-Crick hydrogen bonded base-pairs of siRNA close to the CNT for window. The values of and should be chosen optimally such that the phase space is properly sampled within reasonable time scales. Therefore, we have optimized the force constant of , and equilibration time before performing the Umbrella sampling. The optimized values are = 4 kcal/mol-Å2, = 1 Å and equilibration time of 1 ns to ensure proper sampling and overlapping of successive histograms, . The values of is changed from 130 Å to 10 Å until the complete translocation happens in steps of 1 Å totaling = 120 Umbrella simulations (windows) of each 1 nano second duration. The probability distribution of the reaction coordinate separating CNT and siRNA is,
Similarly the probability distribution in the presence of is
Re-arranging this gives,
| (8) |
here, is a Dirac delta function, is the number of atoms, denotes the set of atom coordinates, , where is the Boltzmann constant, is the absolute temperature, is the potential energy and , are the partition functions of un-biased and biased systems, respectively. Here problem arises due to the fact that becomes exceedingly small for values of which give significant contribution to the free energy. Umbrella sampling makes use of a biasing potential to sample the region of phase space for which is exceedingly small. Thus, the distribution function can be obtained using Eqn. 8 (to within a multiplicative constant) from the measurement of the biased distribution . The un-biased free energy () was constructed self-consistently using the weighted histogram analysis method (WHAM) torrie ; roux ; ums with the following Eqns. 9 and 10.
| (9) |
where is given by
| (10) |
where is the number of data points in
window. By piecing together the relative free energies measured using a
number of biasing potentials, we construct
over the chosen range of = 10 Å to 130 Å.
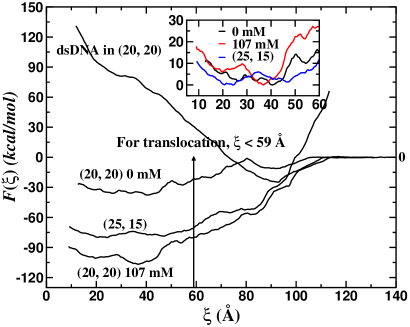
Figure 4 shows the free energy for siRNA
in (20, 20) CNT at 0 mM NaCl concentration.
We find that when siRNA is outside (20, 20)
CNT, the free energy is zero since there is
no interaction between siRNA and (20, 20) CNT.
The snapshots at various time instants show the translocation
process as is decreasing from 130 Å to 10 Å.
For 105 Å, siRNA is outside (20, 20) CNT and
does not interact with it. As the value of is
decreased from 105 Å, decreases to
minima at 92 Å at which siRNA is in a local
stable state. At this stage siRNA rotates inside
CNT and two unpaired bases of siRNA and one WC
base-pair unzips to interact with (20, 20) CNT
as can be seen in Figure 4.
Further decrease in results in increasing
having an energy barrier for siRNA to
translocate inside CNT. reaches maximum
at = 80 Å with an energy barrier
of = 9 kcal/mol.
The energy barrier for further translocation
arises due to strong vdW interaction between
unpaired nucleobases of siRNA and CNT.
Thermal fluctuations help siRNA
to overcome this barrier. Note that, once it overcomes
this barrier, favorable vdW interaction between
nucleobases and CNT helps siRNA to translocate inside.
From = 80 Å, siRNA goes inside (20, 20) CNT
easily and decreases until complete siRNA
translocation at = 42 Å.
This is the most stable position for siRNA inside (20, 20) CNT
where siRNA stays for the rest of the simulation time.
Figure 4 presents free energy
for siRNA in CNTs for (20, 20), (25, 15) chiralities
at 0 mM NaCl concentration, for (20, 20) CNT
at 107 mM NaCl concentration and for dsDNA in
(20, 20) CNT at 0 mM NaCl concentration.
In the un-biased simulation, we have observed
the translocation of siRNA in CNTs but no translocation
of dsDNA is observed. The dsDNA has favorable
state only outside the (20, 20) CNT as can be
seen in Figure 4. This might be due
to the less favorable interaction of thymidine
nucleobase with nanotube compared to the uridine
nucleobase interaction with nanotube santoshjcp ; santoshgraphene .
For , where is the length
of the CNT, is constantly increasing
which means dsDNA encounters unfavorable free
energy landscape when translocated inside
(20, 20) CNT. This dramatic difference of
interaction between CNT and siRNA and CNT
and dsDNA may be due to the relatively
weaker interaction strength of thymidine
with CNT than that of uridine with CNT santoshjcp ; santoshgraphene .
Moreover, the stronger WC base-pairing interaction
energy of A-T compared to A-U sponer2004 ; santoshjcp ; santoshgraphene ; huang2011 makes
dsDNA difficult to get unzipped. Earlier we
have shown that unzipped base-pairs facilitate
binding with CNT/graphene santoshjcp ; santoshgraphene . dsDNA
requires more than 100 kcal/mol energy to
overcome a free energy barrier to translocate
inside (20, 20) CNT which is not possible
without any external force. However, possibility
of the translocation of dsDNA in CNT of large
diameter has not been studied in our simulation.
In experiments of dsDNA translocation inside
CNT, the diameter of CNT is 50-100 nm
ito2003 ; fan2005nl .
In the experiments of ssDNA translocation
through -hemolysin ion
channel kasianowicz1996 , the diameter of
-hemolysin is 26 Å and the polymer is
single stranded. Diameter of (20, 20) CNT is 26.74
Å which is close to the diameter of -hemolysin
ion channel and so the channel diameter is not sufficient
for dsDNA translocation. We have observed the
translocation of ssDNA through CNT of diameter 26.74 Å
santoshjbs . Our results on ssDNA and dsDNA
translocation are consistent with experiments kasianowicz1996 .
for dsDNA has global minimum only outside
the (20, 20) CNT. When dsDNA is forced to translocate
inside (20, 20) CNT with an external Umbrella
potential, dsDNA deforms largely by breaking
most of the WC base-pairs due to the large external
force by Umbrella potential. To have further
confirmation that siRNA translocate inside CNT
and dsDNA does not, we have performed two
separate simulations of siRNA and dsDNA by
keeping them initially inside the (20, 20) CNT.
As expected, siRNA stays inside the CNT for
long time where as dsDNA comes out of the CNT
within 500 ps. These results confirm that
siRNA spontaneously translocates inside a
(20, 20) CNT without any external force
where as dsDNA requires an external force
in order to be translocated inside (20, 20) CNT.
To test the effect of chirality as well as salt concentration on the translocation event, we have calculated the free energy profile of siRNA translocation inside (25, 15) CNT at 0 mM NaCl concentration and for (20, 20) CNT at 107 mM NaCl concentration using Umbrella sampling method. The free energy profile for these cases are shown in Figure 4. In both these cases, the free energy minima is lower compared to the case of siRNA in (20, 20) CNT at 0 mM concentration of NaCl. So for these cases we expect translocation to happen faster compared to the case for siRNA in (20, 20) CNT at 0 mM NaCl concentration. Translocation time for various cases has been discussed in section III.3. The inset of Figure 4 shows the minima of . We observe that = 37 Å at 107 mM as compared to = 42 Å at 0 mM. However, = 21 Å for siRNA in (25, 15) CNT. The origin for this observation is discussed in the next section by analyzing un-biased simulations.
III.3 Translocation time ()
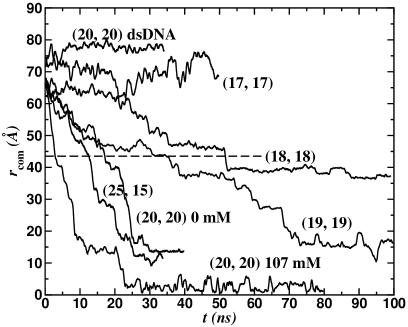
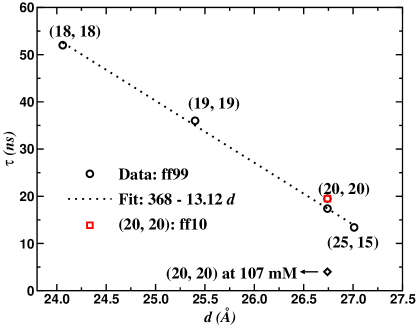
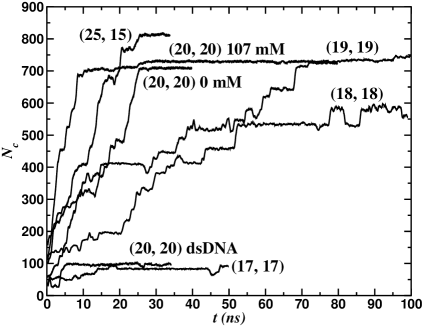
The translocation of siRNA strongly depends on the diameter of CNT since the vdW interaction between siRNA and CNT increases as is decreased (nearly comparable to siRNA diameter). The translocation time, is defined as the time required for at least half of the siRNA base-pairs to enter inside the CNT; i.e., which corresponds to Å or Å, where = 87 Å is the length of the CNT. We plot and in Figures 5 and 5, respectively for various diameters of CNT. In Figure 5, we see that is decreasing with time as siRNA moves towards the interior of the CNT. However, the sticky-ends and unzipped nucleobases of siRNA interact with CNT in the course of translocation, and these give rise to very rugged free energy profile of siRNA during the translocation. We have calculated by tracking as a function of time as shown in Figure 5. The dashed horizontal curve drawn at serves as the reference for translocation criteria. We find that is linearly decreasing with CNT diameter . Similar dependence was observed for DNA transport through graphene nanopore garaj where the ionic conductance was found to be proportional to the pore diameter. We note that our results on are very sensitive to the initial model building. To see the effect of initial relative positioning of siRNA with respect to CNT, we simulated the translocation process for three different initial conditions for (20, 20) CNT. We find to be 18 ns, 14 ns and 17.4 ns and see a strong dependence of on the initial conditions. Hence our results on can only serve as qualitative understanding of the systems under investigation in this study. To understand the origin of this diameter dependence, we have calculated the number of contacts between the siRNA and CNTs and have shown them in Figure 5. of siRNA is calculated within 5 Å from the inner surface of CNT that mostly represents the effective vdW interaction range. As shown in Figure 5, of siRNA are 110 at = 0 ns and rapidly increases to a constant value after complete translocation. The maximum value of increases with ranging from 520 inside the (18, 18) CNT to 815 inside the (25, 15) CNT. siRNA translocation happens above a critical CNT diameter of 24.0 Å which corresponds to (18, 18) CNT, below which no translocation is observed. For siRNA in (17, 17) CNT and dsDNA in (20, 20) CNT, the value of is constant and very less indicating no translocation in the simulated time scale. Since we have not observed the translocation of siRNA in (17, 17) CNT and dsDNA in (20, 20) CNT, is assumed to be very large. For the translocation of siRNA inside CNT, the minimum diameter of CNT, should be greater than or equal to the diameter of siRNA + effective vdW radius of CNT and siRNA; i.e., . The diameter of (17, 17) CNT is 22.73 Å which is very close to siRNA diameter and hence cannot accommodate siRNA unless siRNA is severely stretched. As expected, with decreasing CNT diameter, the deformation in siRNA is more due to strong vdW interaction between siRNA and CNT. The structural aspects of siRNA during translocation are discussed in section III.4. Interestingly, when the salt concentration is increased to 107 mM, decreases drastically to 4 ns compared to 17.4 ns at 0 mM salt concentration. High salt provides better counterion condensation around phosphate atoms in siRNA backbone compared to 0 mM case. The electrostatic screening increases as salt is increased from 0 to 107 mM which reduces phosphate-phosphate electrostatic repulsion in the backbone of siRNA. Therefore, the stability to siRNA increases with increasing salt concentration which reduces the propensity of siRNA unzipping santoshjcp . As a result, at 107 mM NaCl concentration, there is less binding of the siRNA with the CNT. So the translocation is faster at 107 mM salt concentration and hence is small. At 107 mM of NaCl concentration, the maximum value of is 730 which is 20 more in number than that of at 0 mM.
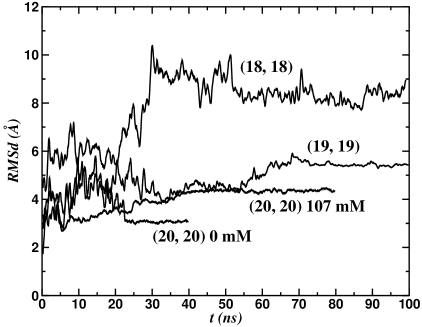
III.4 Structural aspects of siRNA during translocation inside CNT
In order to translocate, siRNA has to cross
the free energy barrier arising due to loss of
entropy of siRNA. In this process, many structural
deformations occurs in siRNA. We have calculated
several quantities that quantify the degree of structural
deformations in siRNA. In Figure 6, we
we plot the root mean square deviation (RMSd) as
a function of time as siRNA translocates in the
interior of CNT for various CNT diameters as
well as for different salt concentrations. The
RMSd was calculated with respect to the initial
minimized structure of siRNA. The RMSd
of the siRNA which is inside of a thinner CNT
is larger than that of the siRNA which is inside
a fatter CNT. This difference is due to the
large structural deformation of siRNA inside
CNT of smaller diameter. The average RMSd of
siRNA is 3.0 Å, 5.4 Å and 8.2 Å inside
(20, 20), (19, 19) and (18, 18) CNT, respectively.
Also RMSd for siRNA in (20, 20) CNT is higher
at 107 mM salt concentration compared to 0 mM
concentration. Among all the cases, siRNA in
(20, 20) CNT at 0 mM has least RMSd after
translocation with small fluctuations.
In the delivery application, the translocation
method is more appropriate and diameter of the
CNT can be appropriately chosen to have minimum
deformation of siRNA structure.
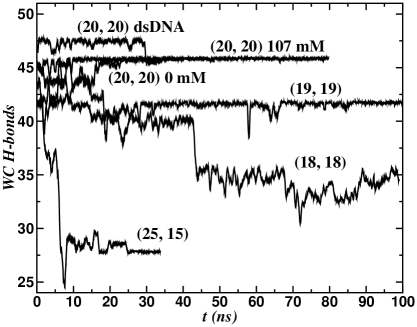
To translocate inside smaller diameter CNTs,
siRNA has to get unzipped. To quantify the
amount of unzipping of siRNA inside CNT, we
have calculated the number of WC H-bonds
based on geometry criteria. WC H-bonds play
a crucial role in maintaining the double
stranded form of nucleic acids
and their function voet ; santoshjpcm ; santoshbj . For WC
H-bond calculation, we have used geometry based
criteria wherein for H-bond, donor-acceptor (D-A)
distance 2.7 Å and angle .
We have plotted the WC H-bonds of siRNA in
various CNTs in Figure 6. There are
only three broken H-bonds out of total 48
possible H-bonds for siRNA in the case of
(20, 20) CNT at 0 and 107 mM salt concentrations and dsDNA in
the case of (20, 20) CNT at 0 mM salt concentration. As is decreasing,
more H-bonds are broken in siRNA due to stronger
vdW interaction between siRNA and CNT.
Interestingly, large number of H-bonds of
siRNA are broken inside (25, 15) CNT.
The aromatic rings of (25, 15) CNT are oriented
differently with respect to CNT axis .
Hence nucleobases try to orient along the aromatic
ring direction due to vdW interaction resulting
in large number of broken H-bonds.
The larger number of broken H-bonds for
smaller diameter is also reflected in the
larger RMSd of siRNA in case of smaller diameter
as shown in Figure 6.
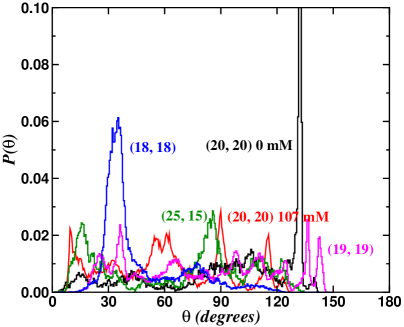
Another very interesting observation is the rotation of siRNA to optimize the nucleobase orientation with respect to the aromatic rings of CNT while translocating inside CNT. We have calculated the distribution of rotation angle, of siRNA where is the average rotation angle of siRNA as it translocates inside nanotube with respect to the structure outside nanotube. The rotation angle is calculated using
| (11) |
where is the vector joining phosphate-phosphate atoms of base-pair for = 4, 5 …17 at time . The angular brackets denote average over base-pairs. Since sticky-ends and base-pairs near to both the ends of siRNA have large fluctuations compared to the middle part of siRNA, they are omitted for the calculation of . for siRNA while translocation inside various CNTs is plotted in Figure 6. We find that siRNA has to rotate in order to translocate inside CNT. Several mechanisms of DNA packaging propose the rotation of DNA during translocation hendrix ; nummela ; hugel . By rotating, siRNA get reoriented with respect to the CNT inner surface which helps in overcoming local free energy barriers and helps in the translocation. Rotation is large for siRNA inside (20, 20) CNT at 0 mM salt concentration and is least for siRNA inside (18, 18) CNT with having very strong peak at 132∘ and 35∘, respectively. In the case of other CNTs, has more than one peak with comparable magnitudes indicating that those rotations are equally likely to be observed. Hence, the local free energy barriers are escaped by rotation of siRNA in order to translocate inside CNTs.
IV Conclusion
To conclude, all atom molecular dynamics simulations with explicit solvent are used to investigate the translocation and encapsulation of siRNA inside CNTs of various diameters, chiralities at various salt concentrations. After the translocation, the siRNA stays inside without any further movement. Free energy calculation using Umbrella sampling shows that siRNA gains in free energy while translocating inside CNT and has to overcome large free energy barrier to exit from the interior of the nanotube. There is no translocation of siRNA inside (17, 17) CNT which has a diameter of 22.73 Å. We find that the diameter of the (18, 18) CNT is the critical diameter for the translocation. Interestingly, siRNA translocates inside (20, 20) CNT but dsDNA cannot. This difference is due to (i) more interaction strength of uridine with CNT inner surface than that of thymidine santoshjcp ; santoshgraphene and (ii) strong A-T base-pairing energy sponer2004 ; santoshjcp ; santoshgraphene ; huang2011 compared to A-U base-pairing energy. The translocation time is decreasing with increasing diameter of the CNT with a critical diameter of 24 Å. Inside CNTs of smaller diameters, vdW repulsion is larger which causes more structural deformations in siRNA. Free energy barrier for exit as well as translocation time strongly depends on the chirality of the nanotube. The aromatic ring orientation in (25, 15) CNT also induces large structural deformations in siRNA and makes the siRNA and CNT interaction stronger than the (20, 20) CNT having same diameter. This makes the translocation in (25, 15) CNT faster compared to (20, 20) CNT. Among all the systems studied, siRNA has least deformations when translocated inside (20, 20) CNT. The stable siRNA-CNT hybrid can be used to deliver siRNA in RNAi applications. The kinetics and other thermodynamic analysis presented in this work allow us to get a microscopic understanding of the translocation process. By means of rotation, siRNA escapes from the local free energy barriers and translocate inside nanotubes. Modeling CNT with partial atomic charges on carbon atoms, functionalizing siRNA with polar nanoparticles for the efficient drug delivery systems are among exciting future perspectives in this emerging area.
V Acknowledgements
We thank department of biotechnology (DBT), India for the financial support.
| (m, n) CNT | siRNA | Box Dimensions | Na+ | Cl- | WAT | Total Atoms | |
|---|---|---|---|---|---|---|---|
| (20, 20) 2880 | 1396 | 44 | 0 | 0 [NaCl] | 47619 | 147177 | |
| (20, 20) 2880 | 1396 | 157 | 113 | 107 [NaCl] | 47395 | 146731 | |
| (19, 19) 2736 | 1396 | 44 | 0 | 0 [NaCl] | 45897 | 141867 | |
| (18, 18) 2592 | 1396 | 44 | 0 | 0 [NaCl] | 44393 | 137211 | |
| (17, 17) 2448 | 1396 | 44 | 0 | 0 [NaCl] | 42690 | 131958 | |
| (25, 15) 2940 | 1396 | 44 | 0 | 0 [NaCl] | 47358 | 146454 | |
| (20, 20) 2880 | 1398 | 42 | 0 | 0 dsDNA [NaCl] | 47849 | 147867 |
References
- (1) Z. Liu, M. Winters, M. Holodniy, and H. Dai. Angew. Chem. Int. Ed., 46(12):2023–2027, (2007).
- (2) Z. Liu, S. Tabakman, K. Welsher, and H. Dai. Nano Research, 2(2):85–120, (2009).
- (3) N. Kam, Z. Liu, and H. Dai. Angew. Chem. Int. Ed., 45(4):577–581, (2006).
- (4) Z. Zhang, X. Yang, Y. Zhang, B. Zeng, Z. Wang, T. Zhu, R. B. S. Roden, Y. Chen, and R. Yang. Clin. Cancer. Res., 12(16):4933–4939, (2006).
- (5) Q. Lu, J. Moore, G. Huang, A. Mount, A. Rao, L. Larcom, and P. Ke. Nano Lett., 4(12):2473–2477, (2004).
- (6) M. Santosh, S. Panigrahi, D. Bhattacharyya, A. K. Sood, and P. K. Maiti. J. Chem. Phys., 136(24):065106, (2012).
- (7) S. Mogurampelly, S. Panigrahi, D. Bhattacharyya, A. K. Sood, and P. K. Maiti. J. Chem. Phys., 137(5):054903, (2012).
- (8) H. Kumar, Y. Lansac, M. A. Glaser, and P. K. Maiti. Soft Matter, 7(13):5898–5907, (2011).
- (9) J. Kasianowicz, E. Brandin, D. Branton, and D. Deamer. Proc. Natl. Acad. Sci. USA., 93(24):13770–13773, (1996).
- (10) S. Henrickson, M. Misakian, B. Robertson, and J. Kasianowicz. Phys. Rev. Lett., 85(14):3057–3060, (2000).
- (11) D. Lubensky and D. Nelson. Biophys. J., 77(4):1824–1838, (1999).
- (12) A. Meller, L. Nivon, and D. Branton. Phys. Rev. Lett., 86(15):3435–3438, (2001).
- (13) W. Sung and P. Park. Phys. Rev. Lett., 77(4):783–786, (1996).
- (14) M. Muthukumar. J. Chem. Phys., 111(22):10371–10374, (1999).
- (15) M. Muthukumar. Phys. Rev. Lett., 86(14):3188–3191, (2001).
- (16) C. Dekker. Nature Nanotechnol., 2(4):209–215, (2007).
- (17) D. Branton, D. W. Deamer, A. Marziali, H. Bayley, S. A. Benner, T. Butler, M. Di Ventra, S. Garaj, A. Hibbs, X. Huang, S. B. Jovanovich, P. S. Krstic, S. Lindsay, X. S. Ling, C. H. Mastrangelo, A. Meller, J. S. Oliver, Y. V. Pershin, J. M. Ramsey, R. Riehn, G. V. Soni, V. Tabard-Cossa, M. Wanunu, M. Wiggin, and J. A. Schloss. Nature Biotechnol., 26(10):1146–1153, (2008).
- (18) R. Smeets, U. Keyser, D. Krapf, M. Wu, N. Dekker, and C. Dekker. Nano Lett., 6(1):89–95, (2006).
- (19) S. van Dorp, U. F. Keyser, N. H. Dekker, C. Dekker, and S. G. Lemay. Nature Phys., 5(5):347–351, (2009).
- (20) H. Gao, Y. Kong, D. Cui, and C. Ozkan. Nano Lett., 3(4):471–473, (2003).
- (21) R. Fan, R. Karnik, M. Yue, D. Li, A. Majumdar, and P. Yang. Nano Lett., 5(9):1633–1637, (2005).
- (22) Y. Xie, Y. Kong, A. K. Soh, and H. Gao. J. Chem. Phys., 127(22):225101, (2007).
- (23) Q. X. Pei, C. G. Lim, Y. Cheng, and H. Gao. J. Chem. Phys., 129(12):125101, (2008).
- (24) M. C. G. Lim, Q. Pei, and Z. W. Zhong. Physica A, 387(13):3111–3120, (2008).
- (25) H. Liu, J. He, J. Tang, H. Liu, P. Pang, D. Cao, P. Krstic, S. Joseph, S. Lindsay, and C. Nuckolls. Science, 327(5961):64–67, (2010).
- (26) S. Garaj, W. Hubbard, A. Reina, J. Kong, D. Branton, and J. A. Golovchenko. Nature, 467(7312):190–193, (2010).
- (27) G. F. Schneider, S. W. Kowalczyk, V. E. Calado, G. Pandraud, H. W. Zandbergen, L. M. K. Vandersypen, and C. Dekker. Nano Lett., 10(8):3163–3167, (2010).
- (28) C. A. Merchant, K. Healy, M. Wanunu, V. Ray, N. Peterman, J. Bartel, M. D. Fischbein, K. Venta, Z. Luo, A. T. C. Johnson, and M. Drndic. Nano Lett., 10(8):2915–2921, (2010).
- (29) B. M. Venkatesan and R. Bashir. Nature Nanotechnol., 6(10):615–624, (2011).
- (30) G. Torrie and J. Valleau. J. Comput. Phys., 23(2):187–199, (1977).
- (31) B. Roux. Comput. Phys. Commun., 91(1-3):275–282, (1995).
- (32) D. Frenkel, and B. Smit. 2 ed.; Academic Press, (2001).
- (33) Y. Duan, C. Wu, S. Chowdhury, M. Lee, G. Xiong, W. Zhang, R. Yang, P. Cieplak, R. Luo, T. Lee, J. Caldwell, J. Wang, and P. Kollman. J. Comput. Chem., 24(16):1999–2012, (2003).
- (34) P. K. Maiti, T. A. Pascal, N. Vaidehi, and W. A. Goddard, III. Nuc. Acids Res., 32(20):6047–6056, (2004).
- (35) P. K. Maiti, T. A. Pascal, N. Vaidehi, J. Heo, and W. A. Goddard, III. Biophys. J., 90(5):1463–1479, (2006).
- (36) T. Darden, D. York, and L. Pedersen. J. Chem. Phys., 98(12):10089–10092, (1993).
- (37) I. Yildirim, H. A. Stern, S. D. Kennedy, J. D. Tubbs, and D. H. Turner. J. Chem. Theory Comput., 6(5):1520–1531, (2010).
- (38) S.-T. Lin, M. Blanco, and W. A. Goddard, III. J. Chem. Phys., 119(22):11792–11805, (2003).
- (39) S.-T. Lin, P. K. Maiti, and W. A. Goddard, III. J. Phys. Chem. B, 114(24):8191–8198, (2010).
- (40) T. A. Pascal, W. A. Goddard, III, and Y. Jung. Proc. Natl. Acad. Sci. USA., 108(29):11794–11798, (2011).
- (41) W. C. Still, A. Tempczyk, R. C. Hawley, and T. Hendrickson. J. Am. Chem. Soc., 112(16):6127–6129, (1990).
- (42) J. Srinivasan, M. W. Trevathan, P. Beroza, and D. A. Case. Theor. Chem. Acc., 101(6):426–434, (1999).
- (43) P. K. Maiti, and B. Bagchi. Nano Lett., 6:2478–2485, (2006).
- (44) H. Kumar, B. Mukherjee, S.-T. Lin, C. Dasgupta, A. K. Sood, and P. K. Maiti. J. Chem. Phys., 134(12):124105, (2011).
- (45) B. Nandy, and P. K. Maiti. J. Phys. Chem. B, 115:217–230, (2011).
- (46) See Supplementary Material Document No. — for the details of non-equilibrium versus equilibrium free energy methods and for more snapshots.
- (47) Sponer, J.; Jurecka, P.; Hobza, P. J. Am. Chem. Soc., 126:10142–10151, (2004).
- (48) Y. Huang, X. Weng, and I. M. Russu. Biochemistry, 50(11):1857–1863, (2011).
- (49) T. Ito, L. Sun, and R. Crooks. Chem. Commun., (13):1482–1483, (2003).
- (50) B. Nandy, M. Santosh, and P. K. Maiti. J. Biosci., 37(3):457–474, (2012).
- (51) D. Voet and J. G. Voet. John Wiley & Sons. Inc.,, 3 edition, (2005).
- (52) M. Santosh and P. K. Maiti. J. Phys.: Condens. Matter, 21(3):034113, (2009).
- (53) M. Santosh and P. K. Maiti. Biophys. J., 101(6):1393–1402, (2011).
- (54) R. Hendrix. Proc. Natl. Acad. Sci. USA., 75(10):4779–4783, (1978).
- (55) J. Nummela and I. Andricioaei. Biophys. J., 96(4):L29–L31, (2009).
- (56) T. Hugel, J. Michaelis, C. L. Hetherington, P. J. Jardine, S. Grimes, J. M. Walter, W. Faik, D. L. Anderson, and C. Bustamante. PLoS Biol, 5(3):558–567, (2007).
- (57) W. Humphrey, A. Dalke, and K. Schulten. J. Mol. Graph., 14(1):33–&, (1996).