Swift publication statistics: a comparison with other major observatories
Abstract
Swift is a satellite equipped with -ray, X-ray, and optical-UV instruments aimed at discovering, localizing and collecting data from gamma-ray bursts (GRBs). Launched at the end of 2004, this small-size mission finds about a hundred GRBs per year, totaling more than 700 events as of 2012. In addition to GRBs, Swift observes other energetic events, such as AGNs, novae, and supernovae. Here we look at its success using bibliometric tools; that is the number of papers using Swift data and their impact (i.e., number of citations to those papers). We derived these for the publication years 2005 to 2011, and compared them with the same numbers for other major observatories. Swift provided data for 1101 papers in the interval 2005-2011, with 24 in the first year, to 287 in the last year. In 2011, Swift had more than double the number of publications as Subaru, it overcame Gemini by a large fraction, and reached Keck. It is getting closer to the publications of the successful high-energy missions XMM-Newton and Chandra, but is still far from the most productive telescopes VLT (over 500) and HST (almost 800). The overall average number of citations per paper, as of November 2012, is 28.3, which is comparable to the others, but lower than Keck (41.8). The science topics covered by Swift publications have changed from the first year, when over 80% of the papers were about GRBs, while in 2011 it was less than 30%.
1 Introduction
The scientific impact in its fullest sense of individual scientists, research institutes, or universities is rather hard to quantify and may take a long time to become apparent. One of the several approaches commonly used, in the absence of a better metric, is bibliometrics, which measures publication and citation numbers. Bibliometrics applies statistical methods to scientific publications, and, as generally done for all subject areas, in astronomy it also measures the impact of a given entity through the total number of citations to its papers. It is used nowadays by all major astronomical observatories, including HST, VLT, Keck, Chandra, and is generally well documented. HST, ESO telescopes (e.g., VLT), Keck, and VLA have made available their bibliometric statistics beginning in the nineties. The space missions Chandra and XMM-Newton (the high-energy space missions) started their publication statistics more recently, as they were launched later.
All of the mentioned observatories are medium to large-size projects, with budgets above half a billion USD, whose well-proven successful publication statistics are instrumental in advocating support from major space agencies or national and international institutions. Here we present the first complete bibliometric investigation for the years 2005-2011 of the gamma-ray burst (GRB) small-size mission (budget million USD) Swift (Gehrels et al. 2004). The impact of Swift in the astronomical community has already been shown by Madrid & Macchetto (2009). In their list of the most successful observatories for the year 2006, small projects, including SDSS and Swift, are competing and performing even better than big ‘monster telescopes’ such as HST or VLT.
To perform a meaningful comparison with other observatories in our analysis of publication statistics, Swift papers are selected by following the same strict criteria that other major observatories use. First, only peer-reviewed publications are considered. Next, a paper is considered as a Swift paper if Swift data are used. No theoretical papers (i.e., with no use of data) are included, even if Swift-based results from other publications are mentioned. Papers not considered Swift papers include those which only mention an object discovered by Swift, use the coordinates of an object discovered with Swift, or if the work was triggered by a Swift discovery. Our work is organized as follows: a short description of the mission is given in §2. The details of the methodology used are provided in §3. In §4, we describe the results, in §5 we discuss the science topics covered by Swift publications, and in the final §6, we draw the conclusions of our survey.
2 The Swift mission
Swift is a dedicated satellite primarily intended and designed to detect, localize and observe GRBs. Built by NASA and an international consortium from the United States, United Kingdom, and Italy, it was launched in November 2004 and has been operating ever since. It carries three instruments: the Burst Alert Telescope (BAT; Barthelmy et al. 2005) is a -ray instrument which detects GRB events and localizes them to arcmin precision; the X-ray Telescope (XRT; Burrows et al. 2005) provides a more precise position with an error radius arcsec in 90% of the cases (Evans et al. 2009); the 0.3 meter Ultraviolet/Optical Telescope (UVOT; Roming et al. 2005) provides sub-arcsec localization when the GRB is optically bright.
The position is communicated within one minute via the Tracking and Data Relay Satellite System (TDRSS) to the Mission Operations Center at Penn State University (Pennsylvania) and the Gamma-ray Coordinates Network (GCN) at the Goddard Space Flight Center (GSFC, near Washington, D.C.). The scientific community is publicly alerted for rapid follow up with ground-based telescopes or orbiting satellites, before the blast becomes too faint. Data, which are made public as soon as they are taken, are stored and analyzed at the Swift Science Data Center (at GSFC), at the University of Leicester (UK), and at the ASI Data Center (near Rome).
Swift is operated by scientists working on-line simultaneously, rotating from a team of people. The satellite reached routine observations early on. Considering that BAT has triggers disabled for 18% of the time due to the South Atlantic Anomaly and during slews, which is an additional 17% of the time, Swift works at a very high efficiency of 98%. It detects about 100 GRBs every year and, as of end of 2012, has produced data for more than 700 GRBs. The total budget covering launch and the first eight years of operation ( million USD per year) has been about 300 million USD, including contributions from outside the US. The costs also include about 1.5 million USD per year awarded as grants to US scientists through a Guest Investigator Program. Thanks to its recognized success, NASA has recently granted financial support until 2014.
| Year | #papers | #citations | Cites/paper |
|---|---|---|---|
| 2005 | 24 | 2165 | 90.2 |
| 2006 | 81 | 4976 | 61.4 |
| 2007 | 152 | 6204 | 40.8 |
| 2008 | 143 | 4070 | 28.5 |
| 2009 | 190 | 5846 | 30.8 |
| 2010 | 224 | 4020 | 17.9 |
| 2011 | 287 | 3860 | 13.4 |
| All | 1101 | 31141 | 28.3 |
3 Methodology
The methodology we applied to identify Swift papers consists of two parts. First, we use a Full-Text-Search tool (FUSE) to spot papers that mention the word ’Swift’ in the text, then we visually inspect each paper to classify it. The peer-reviewed journals we screened are A&A, A&ARv, AJ, ApJ, ApJS, AN, ARA&A, EM&P, Icarus, MNRAS, Nature, NewA, NewAR, PASJ, PASP, P&SS and Science.
3.1 FUSE
FUSE is a program developed and maintained by the European Southern Observatory (ESO) Library. A description can be found in Erdmann & Grothkopf (2010) and Meakins & Grothkopf (2012). FUSE is used by telescope bibliography compilers of several major observatories, including HST, Gemini, and Subaru.
The program relies heavily on the NASA Astrophysics Data System (ADS) Abstract Service. FUSE converts PDFs of specific journals into text files, scans them for user-defined keywords, and provides highlighted results in context. The sole keyword searched for in our study was Swift.
3.2 Visual inspection and classification
Papers selected with FUSE that contain the term Swift anywhere in the text were inspected visually to determine whether Swift data were actually used for the research or whether the term was mentioned in another context (e.g., future observations with Swift). Papers which use Swift coordinates as finding charts or as the basis for observations with other facilities are not included. Likewise, papers which merely quote results presented in other papers are excluded. Finally, papers discussing Swift instruments and calibrations (we found 8 in total) are excluded too. About % of the examined papers from 2005 to 2011 are included in the Swift bibliography. When we identify a Swift data paper, we also check which instruments were used and keep track of the scientific subject covered. An overview of the number of Swift papers, along with the total and average citations (as of 14 November 2012), is given in Table 1.
3.3 Other observatories
For ground-based optical/NIR publication statistics, we included those provided for Gemini111www.gemini.edu/science/publications, Keck222www2.keck.hawaii.edu/library/keck_papers.html, Subaru333www.naoj.org/Observing/Proposals/Publish, and VLT444www.eso.org/libraries/telbib_pubstats_overview.html. For UV and X-ray satellites, we used HST555archive.stsci.edu/hst/bibliography, Chandra666cxc.harvard.edu/cda/bibstats/bibstats.html and XMM-Newton777heasarc.gsfc.nasa.gov/docs/xmm/xmmbib.html. Number of publications per year have been provided by Norbert Schartel, ESA, Madrid, Spain. publication statistics. For more details, see Apai et al. (2010) on HST bibliometrics, Rots et al. (2012) on Chandra, and Grothkopf & Meakins (2012) on ESO telescopes (including VLT). For the ground-based telescopes and HST, statistics are obtained using the same rigorous method described in §3.2, therefore results can be considered comparable with Swift’s. For Chandra and XMM-Newton, a different methodology is used, giving generally higher numbers. For example, a paper could describe models or a theory which are based on Chandra results published in another paper. According to Chandra publication statistics, both papers are Chandra papers, whereas, according to our method, only the original paper would qualify. For Swift, HST and all ground-based telescopes, publication statistics are limited to data use only.
| Journal | 2005 | 2006 | 2007 | 2008 | 2009 | 2010 | 2011 | Total | % |
|---|---|---|---|---|---|---|---|---|---|
| ApJ/ApJS | 14 | 46 | 78 | 74 | 90 | 103 | 127 | 532 | 48.3 |
| A&A | 2 | 19 | 49 | 37 | 37 | 41 | 67 | 252 | 22.9 |
| MNRAS | 1 | 9 | 18 | 20 | 53 | 70 | 75 | 246 | 22.3 |
| AJ | 0 | 1 | 4 | 4 | 6 | 4 | 3 | 22 | 2.0 |
| PASP | 0 | 0 | 1 | 0 | 0 | 1 | 0 | 2 | 0.2 |
| Nature | 6 | 6 | 0 | 5 | 3 | 0 | 5 | 25 | 2.3 |
| Science | 1 | 0 | 0 | 1 | 0 | 2 | 4 | 8 | 0.7 |
| Others | 0 | 0 | 2 | 2 | 1 | 3 | 6 | 14 | 1.3 |
| Swift | VLTaaObtained from ESO Telescope Bibliography (http://telbib.eso.org) |
HSTbbObtained from HST Bibliography
(http://archive.stsci.edu/hst/bibliography/). |
||||||
|---|---|---|---|---|---|---|---|---|
| Journal | Tot | % | Tot | % | Tot | % | ||
| ApJ/ApJS | 532 | 48.3 | 824 | 25.1 | 2407 | 48.3 | ||
| A&A | 252 | 22.9 | 1623 | 49.4 | 755 | 15.1 | ||
| MNRAS | 246 | 22.3 | 591 | 18.0 | 775 | 15.5 | ||
| AJ | 22 | 2.0 | 91 | 2.8 | 493 | 9.9 | ||
| PASP | 2 | 0.2 | 16 | 0.5 | 72 | 1.4 | ||
| Nature | 25 | 2.3 | 42 | 1.3 | 52 | 1.0 | ||
| Science | 8 | 0.7 | 14 | 0.4 | 24 | 0.5 | ||
| Others | 14 | 1.3 | 86 | 2.6 | 406 | 8.1 | ||
| All | 1101 | – | 3287 | – | 4984 | – | ||
4 Results
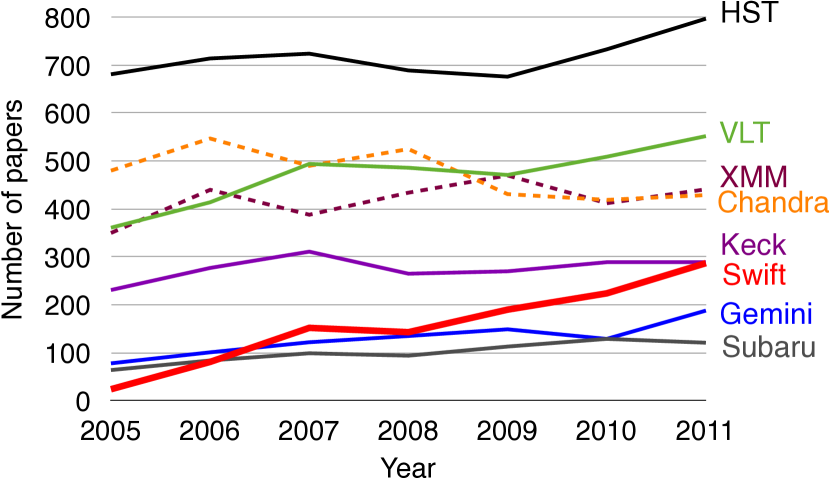
In Fig. 1, we compare Swift papers to publications of major observatories for the years 2005-2011. First Swift publications appeared in 2005. All other observatories in this study started earlier, e.g., HST in 1992 and VLT in 1999. Fig. 2 shows publication statistics for early years for all considered observatories. One way to measure the impact of Swift is by counting the number of papers which use Swift data, and the related number of citations. We did this for the years 2005 to 2011, and compare these numbers with all major observatories listed in §3.3.
4.1 Number of publications
Swift started successful operations right away, after its launch in September 2004. The first GRB was detected December 17 2004, called GRB 041217. The first Swift papers appeared in 2005, the year following its launch, due to the normal delay for the publication process. The number of publications shows an almost steady increase (Fig. 1), starting with 24 papers in 2005, and increasing to 287 in 2011. In the last year, Swift publications were more than those for Gemini, twice those for Subaru, and equalled those of one of the most successful observatories ever, Keck. The total number of Swift publications in 2005-2011 is 1101. Details are reported in Table 1, whereas Fig. 1 shows the comparison with major observatories. The distribution of journals where these papers were published is shown in Table 2, and the comparison with VLT and HST in Table 3. Almost half of the Swift papers appeared in the American journal ApJ, while 45% were equally distributed in the two European journals A&A and MNRAS. This reflects the multi-national aspect of the mission. The fraction of VLT publications in European (A&A and MNRAS) and American (ApJ, AJ, PASP) core astronomy journals is 67% and 28%, respectively (Table 3). The situation for HST is reversed, European and American publications are 31% and 60%, respectively. The journals with particularly high impact factors, Science and Nature, together published 3% of all Swift papers, more than what is typically found for other more mature observatories (1.7% and 1.5% for VLT and HST, respectively).
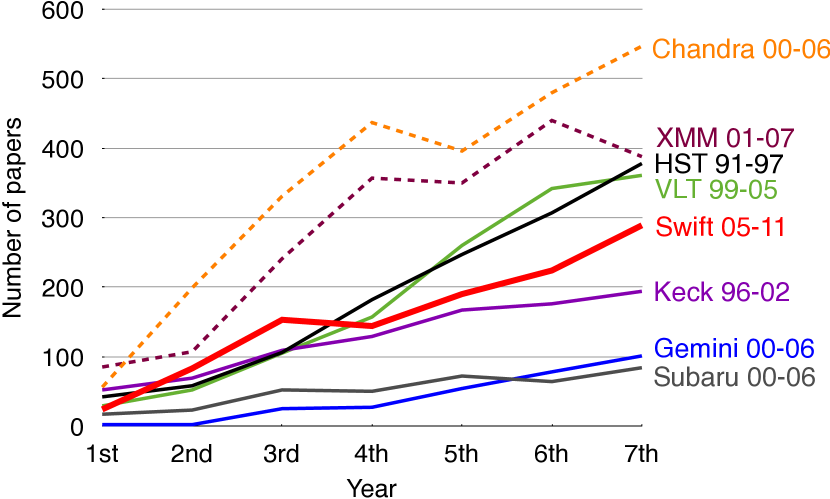
Publication statistics are generally affected, e.g., by the number of telescopes (VLT has four) and instruments of an observatory, hours of observation, construction costs and maintenance, and the number of years of operation (HST started observations more than 20 years ago). Moreover, ground-based telescopes are affected by poor weather conditions, variable seeing and bright time, as well as by the fact that they cannot observe during the day. Publications based on data from any observatory typically start the year following the first light. In Fig. 2 we display the number of publications for the first 7 years of publication for the observatories considered here. The steady increase is common to all. This is related to the organization of observatories, with instruments coming online successively during the first years. A steady regime for Swift has likely not been reached yet as of 2011. For 2012, preliminary predictions indicate over 350 papers, getting closer to the larger high-energy missions XMM-Newton and Chandra, which in 2011 published about 450 papers.
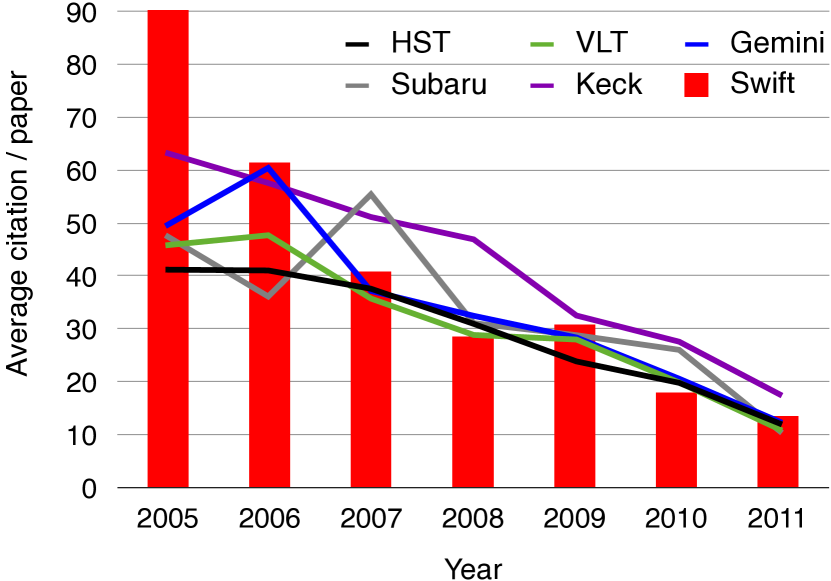
4.2 Impact: citations
A key parameter in evaluating the success of an observatory is the number of citations to its papers for each year or for all years. Of course the number of citations to papers of a given year is a dynamical measure, as it keeps growing with time. In Fig. 3, the number of citations (as measured in mid-November 2012, provided by the ESO Library for VLT and obtained from ADS for all other telescopes) relative to publications of 2005-2011 is reported for Swift and other major observatories. The highest number of citations are obviously attached to the oldest papers, because they have had more time to accumulate citations. The first year of publication was particularly successful, with a very high number of average citations per paper of . Among the 24 papers published in 2005, 6 were in Nature and one in Science, which helps explain the high citation number. The overall average number of citations per paper (the total number of citations divided by the total number of papers) is 28.3, which is comparable to the others (HST: 29.2, VLT: 29.6, Gemini: 31.2, Subaru: 31.8), but lower than Keck (41.8). Among Keck publications, several are very successful (which results in a higher average number of citations), while the citations of other observatories are more uniformly distributed.
| Swift | VLT | HST | Keck | |||||||||||||
| Year | Total papers | # | HIPs | % | # | HIPs | % | # | HIPs | % | # | HIP | % | |||
| () | papers | papers | papers | papers | ||||||||||||
| 2005 | 24.8 | 24 | 4 | 16.7 | 361 | 7 | 1.9 | 681 | 13 | 1.9 | 231 | 13 | 5.9 | |||
| 2006 | 25.3 | 81 | 6 | 7.4 | 414 | 16 | 3.9 | 714 | 25 | 3.5 | 277 | 14 | 5.2 | |||
| 2007 | 23.3 | 152 | 3 | 2.0 | 494 | 11 | 2.2 | 724 | 27 | 3.7 | 311 | 16 | 5.1 | |||
| 2008 | 26.2 | 143 | 3 | 2.1 | 486 | 10 | 2.1 | 689 | 17 | 2.5 | 265 | 14 | 5.3 | |||
| 2009 | 27.3 | 190 | 5 | 2.6 | 471 | 15 | 3.2 | 676 | 15 | 2.2 | 270 | 12 | 4.4 | |||
Another way of measuring the success of publications is by considering the number of so-called high impact papers (HIPs).888http://thomsonreuters.com/products_services/science/
science_products/a-z/high_impact_papers/
According to the company Thomson Reuters (producers of the Science Citation Index, SCI), HIPs of a given year are the top 200 most cited papers for that year. These can also be found by using ADS, and include only refereed papers, generally between to in total in the years 2005-2009 (Table 4). We counted the number of papers among the top 200 most cited ones for Swift, HST, VLT and Keck for these years (we do not show the results for the years 2010 and 2011, due to a lack of significant statistics). Results are in Table 4. In the first year of publication for Swift, 4 out of 24 papers (almost 17%) are HIPs, which is much more than the total fraction for the following 4 years (3.0%). For VLT and HST, the total fraction is 2.7% and 2.8%, respectively. Keck, as already mentioned in the previous paragraph, is a very successful observatory, with an average fraction of HIPs of 5.1%.
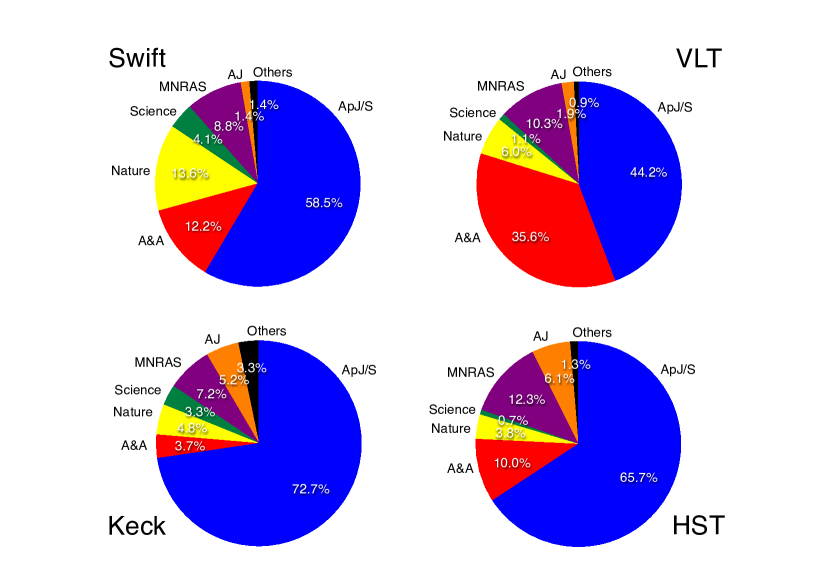
Finally, we extended the concept of successful publications by considering the top 5% based on the number of citations (as given by ADS in November 2012). For the years 2005-2011, the top 5% in terms of citations correspond to approximately the top 1,200-1,300 papers. Fig. 4 shows how these are distributed among journals, in a cumulative way for the years 2005-2011. The fraction of papers in the high-impact journals Nature and Science is 18% for Swift, while the same fraction for the other observatories are in the range 5%-8%. This is perhaps expected, because Swift is newer than the other observatories we considered. We notice that the distribution of the most successful papers for Swift, VLT and HST for different journals shown in Fig. 4 differs from the overall distribution for these observatories for each journal reported in Table 3. For instance, the fraction of Science and Nature papers increases from 3% in all Swift publications (Table 3) to 17.7% for the most successful publications. In contrast, A&A papers for all Swift, VLT and HST publications decreases from 15%-49% to 10%-36% when only the most successful publications are considered.
| # | Authors | Bibcode | Title | #CitationsaaNumber of citations as of November 2012. | Instruments |
| 2005 | |||||
| 1 | Gehrels et al. | 2005Natur.437..851G | A short -ray burst apparently associated | 303 | BAT/XRT/UVOT |
| with an elliptical galaxy at redshift | |||||
| 2 | Burrows et al. | 2005Sci…309.1833B | Bright X-ray Flares in Gamma-Ray Burst | 291 | BAT/XRT/UVOT |
| Afterglows | |||||
| 3 | Fox et al. | 2005Natur.437..845F | The afterglow of GRB 050709 and the | 278 | XRT |
| nature of the short-hard -ray bursts | |||||
| 4 | Barthelmy et al. | 2005Natur.438..994B | An origin for short -ray bursts | 212 | BAT/XRT |
| unassociated with current star formation | |||||
| 5 | Tagliaferri et al. | 2005Natur.436..985T | An unexpectedly rapid decline in the X-ray | 172 | BAT/XRT |
| afterglow emission of long -ray bursts | |||||
| 2006 | |||||
| 1 | Nousek et al. | 2006ApJ…642..389N | Evidence for a Canonical Gamma-Ray Burst | 455 | XRT |
| Afterglow Light Curve in the Swift XRT Data | |||||
| 2 | Campana et al. | 2006Natur.442.1008C | The association of GRB 060218 with a | 342 | BAT/XRT/UVOT |
| supernova and the evolution of the shock wave | |||||
| 3 | O’Brien et al. | 2006ApJ…647.1213O | The Early X-Ray Emission from GRBs | 254 | BAT/XRT/UVOT |
| 4 | Gehrels et al. | 2006Natur.444.1044G | A new -ray burst classification scheme from | 213 | BAT |
| GRB060614 | |||||
| 5 | Bloom et al. | 2006ApJ…638..354B | Closing in on a Short-Hard Burst Progenitor: | 206 | XRT |
| Constraints from Early-Time Optical Imaging | |||||
| and Spectroscopy of a Possible Host Galaxy | |||||
| of GRB 050509b | |||||
| 5 | Soderberg et al. | 2006Natur.442.1014S | Relativistic ejecta from X-ray flash | 206 | BAT/XRT |
| XRF 060218 and the rate of cosmic explosions | |||||
| 2007 | |||||
| 1 | Schaefer | 2007ApJ…660…16S | The Hubble Diagram to Redshift from | 208 | BAT |
| 69 Gamma-Ray Bursts | |||||
| 2 | Evans et al. | 2007A&A…469..379E | An online repository of Swift/XRT light | 184 | XRT |
| curves of -ray bursts | |||||
| 3 | Willingale et al. | 2007ApJ…662.1093W | Testing the Standard Fireball Model of | 162 | BAT/XRT |
| Gamma-Ray Bursts Using Late X-Ray | |||||
| Afterglows Measured by Swift | |||||
| 4 | Albert et al. | 2007ApJ…665L..51A | Very High Energy Gamma-Ray Radiation | 144 | BAT |
| from the Stellar Mass Black Hole Binary | |||||
| Cygnus X-1 | |||||
| 5 | Butler et al. | 2007ApJ…671..656B | A Complete Catalog of Swift Gamma-Ray | 142 | BAT |
| Burst Spectra and Durations: Demise of a | |||||
| Physical Origin for Pre-Swift High-Energy | |||||
| Correlations | |||||
| 2008 | |||||
| 1 | Racusin et al. | 2008Natur.455..183R | Broadband observations of the naked-eye | 221 | BAT/XRT/UVOT |
| -ray burst GRB080319B | |||||
| 2 | Tueller et al. | 2008ApJ…681..113T | Swift BAT Survey of AGNs | 163 | BAT/XRT |
| 3 | Soderberg et al. | 2008Natur.453..469S | An extremely luminous X-ray outburst at the | 159 | BAT/XRT/UVOT |
| birth of a supernova | |||||
| 4 | Sakamoto | 2008ApJS..175..179S | The First Swift BAT Gamma-Ray Burst | 103 | BAT/XRT |
| Catalog | |||||
| 5 | Liang et al. | 2008ApJ…675..528L | A Comprehensive Analysis of Swift XRT | 85 | XRT |
| Data. III Jet Break Candidates in X-Ray and | |||||
| Optical Afterglow Light Curves | |||||
| 5 | Prieto et al. | 2008ApJ…681L…9P | Discovery of the Dust-Enshrouded Progenitor | 85 | UVOT |
| of SN 2008S with Spitzer | |||||
| 2009 | |||||
| 1 | Tanvir et al. | 2009Natur.461.1254T | A -ray burst at a redshift of | 240 | BAT/XRT |
| 2 | Evans et al. | 2009MNRAS.397.1177E | Methods and results of an automatic analysis | 224 | BAT/XRT/UVOT |
| of a complete sample of Swift-XRT | |||||
| observations of GRBs | |||||
| 3 | Salvaterra et al. | 2009Natur.461.1258S | GRB090423 at a redshift of | 217 | BAT/XRT |
| 4 | Fynbo et al. | 2009ApJS..185..526F | Low-resolution Spectroscopy of Gamma-ray | 126 | BAT/XRT |
| Burst Optical Afterglows: Biases in the Swift | |||||
| Sample and Characterization of the Absorbers | |||||
| 5 | Greiner et al. | 2009ApJ…693.1610G | GRB 080913 at Redshift 6.7 | 123 | XRT |
5 Science topics
While the main aim of Swift is to detect GRBs, the satellite also successfully observes other energetic events. This is demonstrated by the distribution of the absolute number (Fig. 5) and the fraction (Fig. 6) of papers for the different science topics. It is clear that in the first two years GRB science was dominant, accounting for over 80% of the publications. In the following year, 2007, the majority are still GRB papers, almost 60%. During the years 2008-2011, the science done by Swift is mostly non-GRB (which drops to a range of 28%-35%). A large fraction are dedicated to galactic sources: of the papers in 2008-2011 are about X-ray binaries, pulsars, supernovae. Among all topics, after GRBs, the most popular is ‘AGN’, which in our classification includes AGNs, distant QSOs, BL Lac and blazars. Swift produced interesting results on many other subjects which are summarized in Figs. 5 and 6 as ‘Other’. These are mainly extragalactic papers, including X-ray background radiation, galaxy surveys, galaxy clusters and groups, and radio galaxies. Five papers (out of 1101) are dealing with X-ray and UV emission of comets. It is notable that the absolute number of publications about GRBs in the interval considered, 2005-2011, is not obviously changing, i.e., the GRB publication rate is not declining in absolute terms.
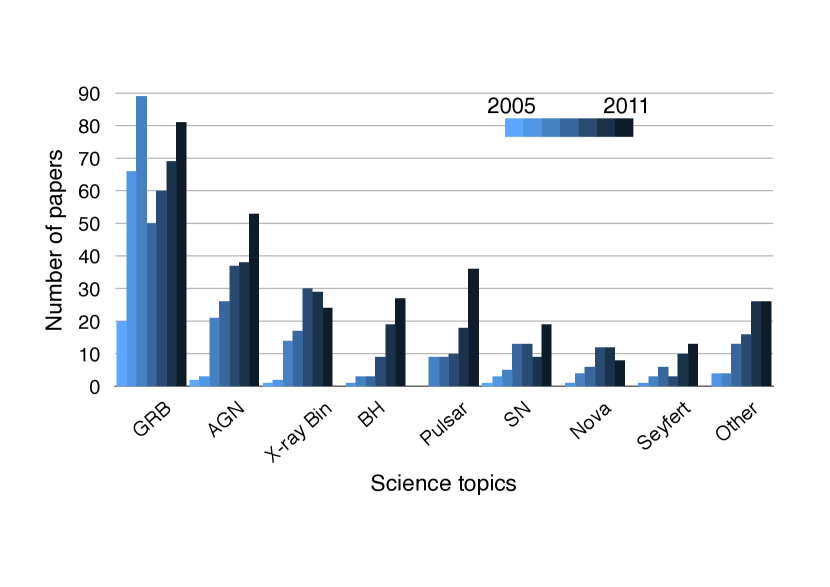
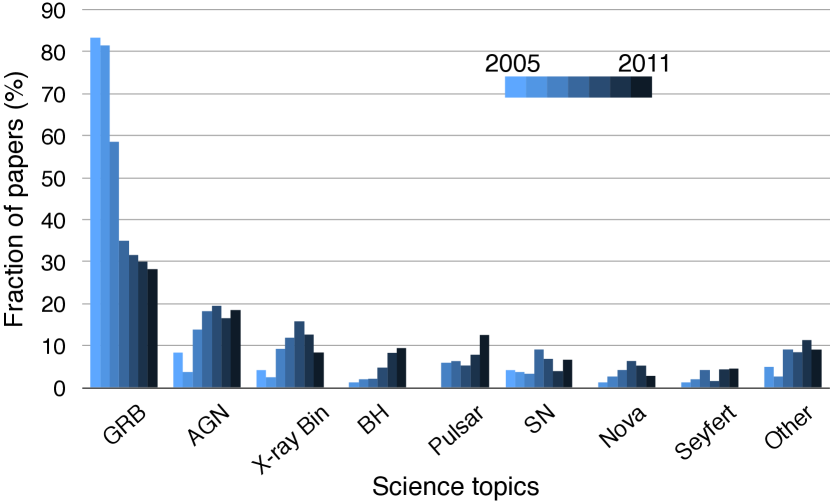
Table 5 lists the details of the most successful Swift papers per year, for 2005-2009, as indicated by the citation count. The science topic covered by the majority, 21 out of 27 papers, is GRB. One is about AGN, two about supernovae, and one about the black hole in the X-ray galactic source Cygnus X-1. Out of the 27 papers, 11 are published in Nature, one in Science. Three (11.1%) are papers with a female first author (Soderberg et al. 2006; Racusin et al. 2007; Soderberg et al. 2008). Although this number is not particularly significant (large statistical error), it is relatively high. For comparison, in a recent investigation, Conley & Stadmark (2012) pointed out that women commissioned to write articles in News & Views in Nature and Perspectives in Science for 2010 and 2011 were under-represented. For instance, the proportion for physical sciences articles is 8.1%, whereas, the proportion of female scientists in the same disciplines in the United States is much higher, 16% (but much lower, when considering full professors or high-level positions).
In Table 6 we list the number of Swift papers distributed according to the use of the three instruments. About 31.5% of publications report XRT data without use of BAT or UVOT data. For 43.9%, XRT data are used in combination with the other two instruments BAT and UVOT. The least used instrument is UVOT: 6.4% alone, 28.1% in combination with the others. BAT is used 17.3% alone, 29.8% with the others.
| Year | BAT/XRT/UVOT | BAT/XRT | XRT/UVOT | BAT/UVOT | BAT | XRT | UVOT |
| 2005 | 5 | 4 | 3 | 0 | 4 | 8 | 0 |
| 2006 | 24 | 16 | 7 | 0 | 10 | 20 | 2 |
| 2007 | 18 | 34 | 18 | 1 | 19 | 57 | 5 |
| 2008 | 11 | 25 | 22 | 0 | 25 | 44 | 16 |
| 2009 | 20 | 32 | 33 | 3 | 35 | 56 | 11 |
| 2010 | 30 | 37 | 33 | 2 | 46 | 64 | 12 |
| 2011 | 31 | 34 | 47 | 2 | 51 | 98 | 24 |
| Fraction | 12.6% | 16.5% | 14.8% | 0.7% | 17.3% | 31.5% | 6.4% |
6 Conclusions
Our study confirms that, along with large observatories, it is extremely important for science to invest in and build medium- and small-size missions, and support them for the longest possible time. Swift is an international small high-energy mission, launched in 2005 and operated by a team of 15 scientists. Including launch and 8 years of operation, it cost 300 million USD. The success of Swift has already been demonstrated by Madrid & Macchetto (2009), who also point out that the most successful observational project of the last decade is the Sloan Sky Digital Survey and its 2m telescope. Swift showed early on that it would be a success, with a total of 24 papers in 2005. In 2011, it produced 287 papers, much more than Gemini, doubling Subaru, and reaching one of the most successful observatories ever, Keck. Citations per paper are around the average for the other observatories, with Keck generally achieving the highest citation rate. It is clear that saturation for Swift might very likely not yet have been reached in 2011 and we expect the number of publications for 2012 to be higher than in the year before.
Similar conclusions are reached by Abt (2012), who indicates that the extra costs of large ground-based telescopes are not totally compensated by the higher number of citations. This comparison between large and small facilities relates to recent conclusions by Loeb (2012): most important discoveries occur serendipitously, and serendipity must go together with large planned projects. Similarly, if we consider the means used to make discoveries, we argue that successful small missions are very important, should continue to be supported as long as possible, and should not be regarded as a competition for large ones.
References
- Abt (2012) Abt, H. A. 2012, AJ, 144, 91
- Apai et al. (2010) Apai, D., Lagerstrom, J., Reid, I. N., et al. 2010, PASP, 122, 808
- Barthelmy (2005) Barthelmy S. D., et al. 2005, Space Science Review, 120, 143
- Burrows (2005) Burrows D. N., et al. 2005, Space Science Review, 120, 165
- Conley & Stadmark (2012) Conley D., & Stadmark J. 2012, Nature, 488, 590
- Erdmann & Grothkopf (2010) Erdmann, C., & Grothkopf, U. 2010, Library and Information Services in Astronomy VI: 21st Century Astronomy Librarianship, From New Ideas to Action, 433, 81
- Evans et al. (2009) Evans, P. A., Beardmore, A. P., Page, K. L., et al. 2009, MNRAS, 397, 1177
- Gehrels et al. (2004) Gehrels, N., Chincarini, G., Giommi, P., et al. 2004, ApJ, 611, 1005
- Grothkopf & Meakins (2012) Grothkopf, U., & Meakins, S. 2012, The Messenger, 147, 41
- Loeb (2012) Loeb, A. 2012, arXiv:1207.3812
- Madrid & Macchetto (2009) Madrid, J. P., & Macchetto, D. 2009, BAAS, 41, 913
- Meakins & Grothkopf (2012) Meakins, S., & Grothkopf, U. 2012, Astronomical Data Analysis Software and Systems XXI, 461, 767
- Roming (2005) Roming P. W. A., et al. 2005, Space Science Review, 120, 95
- Rots et al. (2012) Rots, A. H., Winkelman, S. L., & Becker, G. E. 2012, PASP, 124, 391