Short Timescale AGN X-ray Variability with EXOSAT: Black hole mass and Normalised Variability Amplitude
Abstract
The old EXOSAT medium energy measurements of high frequency (HF) AGN power spectral normalisation are re-examined in the light of accurate black hole mass determinations which were not available when these data were first published (Green et al., 1993). It is found that the normalised variability amplitude (NVA), measured directly from the power spectrum, is proportional to where . As NVA is the square root of the power, these observations show that the normalisation of the HF power spectrum for this sample of AGN varies very close to inversely with black hole mass. Almost the same value of is obtained whether the quasar 3C273 is included in the sample or not, suggesting that the same process that drives X-ray variability in Seyfert galaxies applies also to 3C273. These observations support the work of Gierliński et al. (2008) who show that an almost exactly linear anticorrelation is required if the normalisations of the HF power spectra of AGN and X-ray binary systems are to scale similarly. These observations are also consistent with a number of studies showing that the short timescale variance of AGN X-ray lightcurves varies approximately inversely with mass.
1 Introduction
It is now generally agreed that the X-ray variability properties of few solar mass black holes in X-ray binary systems (XRBs) and supermassive black holes in active galactic nuclei (AGN) are similar. With a view to providing an independent method for determining physical parameters such as black hole mass and accretion rate, there is considerable interest in determining how these parameters might scale with characteristic observable X-ray variability parameters.
X-ray variability can be quantified via the power spectral density (PSD) and, to first order, the X-ray PSDs of AGN are similar to those of XRBs (McHardy, 1988), particularly to XRBs in the high-soft state (e.g. Uttley et al., 2002; McHardy et al., 2004). In this state the power, , at frequency, , is given by where at low frequencies bending, above a frequency , to a slope . Many authors have shown that the timescale , corresponding to the frequency , scales approximately linearly with mass (e.g. McHardy, 1988; Edelson & Nandra, 1999; Uttley et al., 2002; Markowitz et al., 2003; McHardy et al., 2004, 2006; Kelly et al., 2011; Gonzalez-Martin & Vaughan, 2012) although the relationship shows considerable scatter. However much of the scatter can be explained by an inverse scaling of with accretion rate (where is the accretion rate in units of the Eddington accretion rate, McHardy et al., 2004; Uttley & McHardy, 2005; McHardy et al., 2006; Körding et al., 2007).
The other variability parameter which has attracted attention is the normalisation of the high frequency (HF) PSD. This normalisation can be defined in a number of ways. For example, by fitting a power law to the HF PSDs, after subtraction of the Poisson noise contribution, McHardy (1988) measured the power at a fixed frequency (Hz). The normalised variability amplitude, NVA, was then defined as the square root of the power, which was measured in units of (counts s-1)2 Hz-1, divided by the average count rate. The NVAs for a sample of AGN observed by EXOSAT were therefore derived. Although black hole mass was assumed to be a driving parameter, in 1988 very few AGN black hole masses were available so the NVAs were plotted against luminosity as a proxy, showing a strong anticorrelation.
Hayashida et al. (1998), using GINGA observations, measured the timescale at which the PSD crossed a particular power level (, in rms2 Hz-1 units). Scaling this timescale with mass from Cyg X-1, they estimated masses for 8 AGN, although they noted that these masses were one or two orders of magnitude lower than masses derived by other methods. Gierliński et al. (2008) defined an HF PSD normalisation, , which is very similar to the NVA of McHardy (1988) although, as most of their measurements were of XRBs, Gierliński et al. defined at the higher frequency of 1Hz. They also assumed whereas McHardy (1988) and Green et al. (1993) measured . Within the XRB sample of Gierliński et al. there is no correlation of with mass (their Fig.7a), although the range of masses is small and mass uncertainties large. Within their sample of AGN (their Fig.7c) there is an approximate inverse correlation of with mass, strengthened if NGC4395 is included (Fig.7b). However the scatter is too large to define the relationship precisely within that sample. However if it is assumed that AGN and XRBs follow the same scaling relationship then Gierliński et al. (2008) find that . Kelly et al. (2011) fit a mixed Ornstein-Uhlenbeck model to Cyg X-1 and to AGN PSDs. In this model the HF PSD normalisation is defined by , the fractional amplitude of the driving noise field. The PSD slope is again fixed at with . For a sample of 10 AGN they find a strong correlation with (90 per cent confidence). However such a relationship would not extrapolate to the XRB observations and so it is important to investigate the relationship between AGN HF PSD normalisation and mass using other datasets.
Although less direct, the PSD normalisation can be estimated from the normalised excess variance of the lightcurves, (e.g. Nandra et al., 1997). A number of authors (e.g. Papadakis, 2004; Nikolajuk et al., 2004; O’Neill et al., 2005; Zhou et al., 2010; Ponti et al., 2012) have found an approximate inverse scaling of with mass. If all of the frequencies sampled by the lightcurves lie above , and the HF PSD slope is known, then gives a reasonable estimate of the HF PSD normalisation, although Vaughan et al. (2003) show that is a noisy quantity when the PSD is steep. If is not known and lies within the frequencies sampled, or if the low frequency PSD slope is unknown, then is a less good measure of HF PSD normalisation.
The best way, therefore, to determine whether HF PSD normalisation varies with mass is to derive HF PSD normalisations directly from the PSDs. The HF PSD is best determined from continuous long observations which suffer less from distortion by the window function of the sampling pattern than do observations which are split into many segments. Thus XMM-Newton, which allows continuous observations of up to 130ksec, provides a better measurement of the HF PSD (e.g. Gonzalez-Martin & Vaughan, 2012; McHardy et al., 2005, and many others) than do satellites in low earth orbits with maximum continuous observation lengths of s, i.e. GINGA (e.g. Hayashida et al., 1998), ASCA (e.g. O’Neill et al., 2005) or RXTE.
EXOSAT was also useful as it allowed continous observations of up to 280ksec. The EXOSAT low energy (LE) imaging telescope is not comparable in sensitivity at low energies (0.1-2 keV) to XMM-Newton. However the EXOSAT Medium Energy proportional counter (ME) is comparable at the higher energies (approximately 1-9 keV) where, also, the effects of absorption which may affect measurements of X-ray flux variations, are less. In addition, the ME has made long observations of some bright AGN (eg 3C273, CenA, NGC5506) for which long observations by XMM-Newton do not yet exist. In this paper the EXOSAT ME observations of AGN are re-examined to determine whether they reveal any scaling of HF PSD normalisation with mass.
2 EXOSAT Observations
2.1 The EXOSAT ME Sample
McHardy (1988) provided initial NVA measurements for a sample of AGN observed by EXOSAT, but a more precise analysis of all EXOSAT ME AGN observations longer than 20ksec (32 AGN in total) was carried out by Green et al. (1993). Green et al. removed the small window artefacts from EXOSAT PSDs using their own 1D version of the ‘CLEAN’ algorithm (Roberts et al., 1987) and hence derived NVAs. Errors were determined from simulations. Green et al. confirmed the inverse scaling of NVA with luminosity, suggesting that the lower NVAs arose in larger mass objects from a larger emitting region, and also found a positive correlation of NVA with photon energy index.
Where variability was not detected, ie the hypothesis that the lightcurve was constant could not be rejected at the 95 per cent confidence level at least 90 per cent of the time, Green et al. provide an NVA upper limit, deduced from the photon counting noise level of the lowest noise observation. The reader is referred to Green et al. for full details.
| Name | Black Hole Mass | Ref | NVA |
|---|---|---|---|
| () | |||
| 3C120 | 55 | 1 | |
| NGC3227 | 15 | 2 | |
| NGC3783 | 29.8 | 1 | |
| NGC4051 | 1.73 | 3 | |
| NGC4151 | 45 | 4 | |
| 3C273 | 890 | 1 | |
| NGC4593 | 9.8 | 5 | |
| MCG-6-30-15 | 4.5 | 6 | |
| NGC5506 | 7.0 | 7 | |
| NGC7314 | 0.87 | 7 | |
| MCG+8-11-11 | – | – |
| Name | Black Hole Mass | Ref | NVA |
|---|---|---|---|
| () | limit | ||
| MKN335 | 14.2 | 1 | 4.30 |
| IIIZw2 | – | – | 2.90 |
| FAIRALL9 | 255 | 1 | 3.30 |
| NGC526 | – | – | 2.90 |
| Mkn1040 | – | – | 3.50 |
| 0241+622 | – | – | 2.90 |
| Akn120 | 150 | 1 | 1.60 |
| NGC2110 | 200 | 8 | 5.20 |
| 3A0557-383 | – | – | 1.80 |
| NGC2992 | 52 | 8 | 1.41 |
| NGC3516 | 31.7 | 3 | 3.90 |
| CENA | 50 | 9 | 0.60 |
| IC4329 | 217 | 10 | 0.70 |
| NGC5548 | 65.4 | 11 | 1.53 |
| E1821+643 | – | – | 3.40 |
| 3C382 | – | – | 1.40 |
| 3C390.3 | 287 | 1 | 3.40 |
| MR2251-179 | 100 | 12 | 2.40 |
| NGC7469 | 12.2 | 1 | 2.00 |
| MCG2-58-22 | – | – | 2.30 |
2.2 NVA and black hole mass measurements
In Table 1 the NVAs where variability was detected are listed together with the most accurate black hole masses available. Masses derived from stellar dynamical observations (NGC3227 and NGC4151), which are not subject to the uncertainty regarding the ‘f-factor’ used to convert dynamical products from reverberation observations to black hole masses, are taken preferentially. As dynamical measurements are rare, reverberation masses are next taken (3C120, NGC3783, NGC4051, 3C273 and NGC4593; see the caption to Table 1). For MCG-6-30-15 the mass estimated by McHardy et al. (2005) is used. This mass is the mean of the mass derived from the width of the stellar absorption lines and from the emission line width. For NGC5506 and NGC7314 the mass is derived from the stellar absorption line widths of 98 and 60 km s-1 respectively (Gu et al., 2006) using, as for MCG-6-30-15, the relationships of Merritt & Ferrarese (2001) and Tremaine et al. (2002). The latter, particularly, has been shown by Greene et al. (2004) to provide a good mass estimate for low mass systems. The mean of the masses derived from these two relationships is taken and a 50 per cent uncertainty is assumed. No reliable mass estimator could be found for MCG+8-11-11 and so this AGN is not considered further. In Table 2 the NVA upper limits for sources where variability was not detected are listed. Black hole masses are also given.
2.3 Quantifying the NVA-Mass Relationship
A simple maximum likelihood (ML) analysis, using the function within the QDP plotting package which takes only the errors on NVA, was applied to the AGN with detected variability (except for MCG+8-11-11). This analysis shows that the relationship , with (90 per cent confidence) is a good description of these data. The QDP ML W-Var statistic, which is similar to , is 6.1 for 8 d.o.f., indicating that the errors are overestimated. To determine whether varies with the method of fitting, a number of other methods were examined, particularly fitexy (Press et al., 1992) and Bayesian regression (Kelly, 2007).
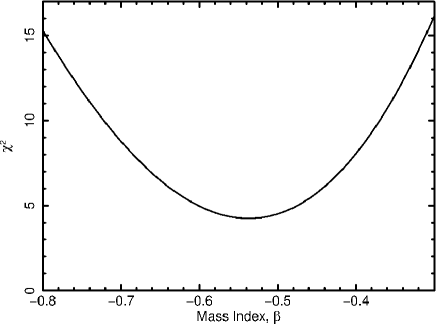
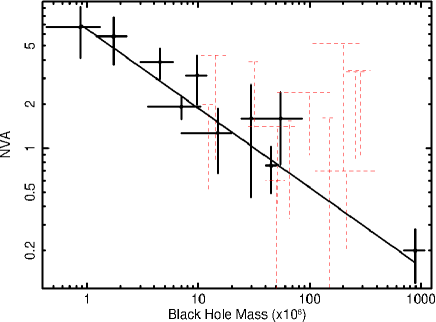
In the fitexy method, errors in both directions are included. The best value and uncertainty in were determined by measuring the minimum value of as a function of , with free normalisation (Fig. 1). The lowest overall of 4.24 corresponds to . For 8 d.o.f., this value confirms that the errors are over-estimates. The 1 (ie =1) uncertainty is 0.08. The 90 per cent confidence uncertainty (ie =2.7) is 0.12. The Bayesian regression analysis of Kelly (2007), as implemented within IDL gives an almost identical value of . The standard deviation of 0.10 is slightly larger, probably because Bayesian analysis takes account of the fact that the observed AGN are just a random sample drawn from the parent distribution, a consideration addressed here in Section 2.3.1. Thus the results do not depend on the fitting method. The best fit from the fitexy method is shown in Fig. 2. Unless stated otherwise, fitexy results will be quoted hereafter. The NVA upper limits are not included in this fit but are consistent with the fit.
In principle the NVA upper limits can be used to refine the value of . However the result depends on how the ‘upper limits’ are interpreted and what probability density functions (PDFs) are assigned to them, eg whether they are hard limits above which there is no probability of finding the datum, or limits with an associated measurement error. Eg the methodology of Kelly (2007), as implemented within IDL, treating the limits as hard, gives . Allowing some error in the limit allows slightly flatter values. However as it is not clear how the limits of Green et al. should be interpreted, it is concluded only that the upper limits are consistent with values of derived from detections, but not favouring values of much flatter than -0.5.
For almost all of the present sample it is now known that is well below Hz (e.g. see McHardy et al., 2006) and so the NVAs reported by Green et al. are a good measurement of the normalisation of the HF PSD. In addition, where PSD slopes could be reasonably measured, is mostly close to 2, as expected for the HF part of the PSD. However for NGC4051 Hz (McHardy et al., 2004) and the EXOSAT observation length (207ks) is long enough that a single power law fit would be noticeably flattened by the PSD values below , where . Re-examination of the EXOSAT PSD shows that the NVA could be underestimated by up to 50 per cent. With a corrected NVA, . Parameterising log(NVA)=log(M) +, then here .
The only other source where a significant underestimation of the NVA might be expected, based on its low mass, is NGC7314. However the EXOSAT observation is only 22ks and so the HF PSD is unlikely to be noticeably distorted. Even allowing for an extreme 50 per cent underestimate similar to that for NGC4051, and also allowing for the same underestimate in NGC4051, increases only to .
Measurement errors in the covariate, in this case mass, bias the slope towards zero (e.g. Akritas & Bershady, 1996). Although not discussed in detail here, that bias can be addressed via simulations where each data point is represented by a 2D PDF. Random selection of simulated data points from those PDFs gives values of which are typically flatter by 0.03 to 0.04 than those obtained by fitexy. As the simulations include the measurement error twice, i.e. once in the value of the data point itself and once in the distribution of the PDF, but fitexy only includes the error once, the true values of may be steeper than those given above.
2.3.1 Dependence of NVA on Sample Parameters
It is often questioned whether the X-ray emission mechanism in 3C273 is similar to that in Seyfert galaxies, ie thermal Compton scattering from a non-beamed corona, or whether it is synchrotron or synchrotron self-Compton emission from a relativistic jet (e.g. Haardt et al., 1998; McHardy et al., 1999; McHardy et al., 2007). 3C273 shows a bend in its long term PSD which is consistent with arising from the same variability process as in Seyfert galaxies (McHardy, 2006) but it is still unclear whether it should be included together with Seyfert galaxies and non-blazar radio galaxies (3C120), ie the remainder of Table 1, in any X-ray timing survey. The fit was therefore repeated without 3C273, providing a similar slope ( from fitexy or from Bayesian regression) whose extrapolation passes well within the error range for 3C273. These results suggest that the same process that drives X-ray variability in Seyferts also drives variability in 3C273 although the X-ray emission location or emission mechanism need not be the same in both cases.
With small samples such as that listed in Table 1, the results can depend on the choice of the values of the measured variables and/or of the sample content. For example for MCG-6-30-15 one might take the mass derived only from the stellar absorption lines ( , McHardy et al., 2005), which would not alter . Or one might decide to take masses derived from reverberation for NGC3227 ( , Denney et al., 2010) and NGC4151 (here identical to the value listed in Table 1, Onken et al., 2007). The value of is again almost unchanged ( or if 3C273 is excluded) although the fit, whilst remaining good, is very slightly worse. One might even decide to exclude MCG-6-30-15, NGC5506 and NGC7314 altogether, giving .
It is finally noted that Graham et al. (2011) propose a revision of black hole masses. Using their ‘classical’ (ie all morphological type) relationship, the masses of MCG-6-30-15 and NGC5506 would reduce by almost exactly a factor 2, and that of NGC7314 by a factor 3. All masses based on reverberation mapping would reduce also by a factor 2 due to their downward revision of the ‘f-factor’. As these changes are almost entirely systematic, the various fits for are almost unchanged with typical values flattening by only (eg from -0.54 to -0.52) with, if anything, very slightly reduced dispersion.
The overall conclusion is that is robust to minor changes in sample parameters with a value close to -0.54.
3 Discussion
It is shown here that NVA, defined by McHardy (1988) and derived more precisely from EXOSAT ME observations by Green et al., correlates very well, within a sample of AGN alone, with black hole mass. For a relationship then, even allowing for different choices of mass or sample content, remains close to -0.54 with a dispersion of . The main contribution of the present work is thus to show that a close to inverse linear scaling of HF PSD normalisation with mass, proposed by Gierliński et al. (2008) on the assumption that AGN and XRBs follow the same scaling, occurs independently within a sample of AGN alone.
The large scatter within the AGN values of Gierliński et al. may have arisen because their values of were derived from earlier measurements of X-ray excess variance by satellites with large orbital gaps in their lightcurves, ie ASCA and RXTE. Variations in accretion rate may perhaps add further scatter. Within their sample of XRBs, Gierliński et al. show that is not constant for any given XRB, although they note that the range of variability with flux is not large. They do, however, note that the value of in the soft state of Cyg X-1 is larger than in the hard state which may indicate some variation of HF PSD normalisation with accretion rate or state. However the range of accretion rates within the sample listed in Table 1 is not large. Thus, as there is no evidence for dispersion in the present value of over and above that expected from the errors in the mass and NVA measurements, possible variation of NVA with accretion rate are not considered further here although they cannot be ruled out.
Finally, the differences between the results of Kelly et al. (2011) and those presented here are considered. The equivalent value of the slope derived by Kelly et al. from Bayesian regression is (90 per cent confidence) whereas the value presented here is (1, or at 90 per cent confidence), or -0.57 if NGC4051 is corrected. Possible reasons for the differences in slope include differences in analysis methods and in sample content.
Regarding analysis methods, for the present sample all regression methods produce the same value of . Another analysis difference is that the NVA values are derived from simple fits to the HF PSDs whereas the values of are derived from fitting a particular model, the mixed Ornstein-Uhlenbeck model, to the datasets. Although parameters in multiparameter fits usually interact, there is no obvious reason why this model should result in larger values of . Similarly fixing the HF PSD slope at (Kelly et al.; Gierliński et al.) compared with measuring (Green et al.) and then correcting the NVA if is lower than 2 should have little effect.
Large differences in sample content may, however, have a large effect on the value of . Only 6 of the 10 AGN in each sample are in common. Kelly et al. include the high accretion rate NLS1s Mkn766 and Ark564 (whose mass is uncertain). However these two NLS1s are not included here where the spread in accretion rate is more limited. Mkn766 and Ark564 are both low mass AGN and so have large leverage on the value of . If there is a slight increase of HF PSD normalisation with accretion rate or ‘state’, as the observations of Cyg X-1 by Gierliński et al. suggest, inclusion of these two AGN would steepen . Also some masses used here differ from those used by Kelly et al., taken from Sobolewska & Papadakis (2009). With small samples, such differences in content can have a significant effect. Further studies to determine for other samples of AGN are clearly merited.
The present results are also consistent with the work of Ponti et al. (2012) who measure the excess variance, , for a sample of AGN observed by XMM-Newton. They find that where , which is very close to the relationship derived here, for the AGN with 80ksec minimum duration observations or for AGN with a minimum of 40 ksec duration.
4 Conclusions
Using NVA measurements from Green et al. (1993) it has been shown that, within a sample of AGN observed by EXOSAT, HF PSD normalisation scales almost exactly inversely with black hole mass. These observations support the proposal of Gierliński et al. (2008) that HF PSD normalisation scales exactly inversely from XRBs to AGN. It is also noted that the quasar 3C273 fits well onto the scaling relationship derived for Seyfert galaxies, suggesting that the same process which drives X-ray variability in Seyfert galaxies also drives X-ray variability in 3C273, even though the emission process or emission location may be different.
Acknowledgements
I thank Dimitrios Emmanoulopoulos and Christian Knigge for extensive discussions about statistics and regression and I thank Dimitrios for tuition in the use of Mathematica. I thank Liz Bartlett for advice regarding IDL and Brandon Kelly for discussions on regression and for advice as to how to run his Bayesian regression code inside IDL. I thank the anonymous referee for a useful and informative report.
References
- Akritas & Bershady (1996) Akritas M. G., Bershady M. A., 1996, ApJ, 470, 706
- Bentz et al. (2007) Bentz M. C., et al., 2007, ApJ, 662, 205
- Davies et al. (2006) Davies R. I., et al., 2006, ApJ, 646, 754
- Denney et al. (2006) Denney K. D., et al., 2006, ApJ, 653, 152
- Denney et al. (2010) Denney K. D., et al., 2010, ApJ, 721, 715
- Edelson & Nandra (1999) Edelson R., Nandra K., 1999, ApJ, 514, 682
- Gierliński et al. (2008) Gierliński M., Nikołajuk M., Czerny B., 2008, MNRAS, 383, 741
- Gonzalez-Martin & Vaughan (2012) Gonzalez-Martin O., Vaughan S., 2012, ArXiv e-prints
- Graham et al. (2011) Graham A. W., Onken C. A., Athanassoula E., Combes F., 2011, MNRAS, 412, 2211
- Green et al. (1993) Green A. R., McHardy I. M., Lehto H. J., 1993, MNRAS, 265, 664
- Greene et al. (2004) Greene J. E., Ho L. C., Barth A. J., 2004, in Proc. IAU Symp. 222, p. 33, C.U.P., arXiv:astro-ph/0406047
- Gu et al. (2006) Gu Q., Melnick J., Fernandes R. C., Kunth D., Terlevich E., Terlevich R., 2006, MNRAS, 366, 480
- Haardt et al. (1998) Haardt F., et al., 1998, A&A, 340, 35
- Hayashida et al. (1998) Hayashida K., Miyamoto S., Kitamoto S., Negoro H., Inoue H., 1998, ApJ, 500, 642
- Kelly (2007) Kelly B. C., 2007, ApJ, 665, 1489
- Kelly et al. (2011) Kelly B. C., Sobolewska M., Siemiginowska A., 2011, ApJ, 730, 52
- Körding et al. (2007) Körding E. G., Migliari S., Fender R., Belloni T., Knigge C., McHardy I., 2007, MNRAS, 380, 301
- Markowitz (2009) Markowitz A., 2009, ApJ, 698, 1740
- Markowitz et al. (2003) Markowitz A., et al., 2003, ApJ, 593, 96
- Merritt & Ferrarese (2001) Merritt D., Ferrarese L., 2001, ApJ, 547, 140
- McHardy (2006) McHardy I., 2006, PASP, 350. p. 94.
- McHardy et al. (1999) McHardy I., Lawson A., Newsam A., Marscher A., Robson I., Stevens J., 1999, MNRAS, 310, 571
- McHardy et al. (2007) McHardy I., Lawson A., Newsam A., Marscher A. P., Sokolov A. S., Urry C. M., Wehrle A. E., 2007, MNRAS, 375, 1521
- McHardy (1988) McHardy I. M., 1988, Memorie della Societa Astronomica Italiana, 59, 239
- McHardy et al. (2005) McHardy I. M., Gunn K. F., Uttley P., Goad M. R., 2005, MNRAS, 359, 1469
- McHardy et al. (2006) McHardy I. M., Koerding E., Knigge C., Uttley P., Fender R. P., 2006, Nature, 444, 730
- McHardy et al. (2004) McHardy I. M., Papadakis I. E., Uttley P., Page M. J., Mason K. O., 2004, MNRAS, 348, 783
- Nandra et al. (1997) Nandra K., George I. M., Mushotzky R. F., Turner T. J., Yaqoob T., 1997, ApJ, 476, 70
- Neumayer (2010) Neumayer N., 2010, PASA, 27, 449
- Nikolajuk et al. (2004) Nikolajuk M., Papadakis I. E., Czerny B., 2004, MNRAS, 350, L26
- O’Neill et al. (2005) O’Neill P. M., Nandra K., Papadakis I. E., Turner T. J., 2005, MNRAS, 358, 1405
- Onken et al. (2007) Onken C. A., et al., 2007, ApJ, 670, 105
- Papadakis (2004) Papadakis I. E., 2004, MNRAS, 348, 207
- Peterson et al. (2004) Peterson B. M., et al., 2004, ApJ, 613, 682
- Ponti et al. (2012) Ponti G., Papadakis I., Bianchi S., Guainazzi M., Matt G., Uttley P., Bonilla N. F., 2012, A&A, 542, A83
- Press et al. (1992) Press W. H., Teukolsky S. A., Vetterling W. T., Flannery B. P., 1992, Numerical Recipes, C.U.P.
- Roberts et al. (1987) Roberts D. H., Lehar J., Dreher J. W., 1987, AJ, 93, 968
- Sobolewska & Papadakis (2009) Sobolewska M. A., Papadakis I. E., 2009, MNRAS, 399, 1597
- Tremaine et al. (2002) Tremaine S., et al., 2002, ApJ, 574, 740
- Uttley & McHardy (2005) Uttley P., McHardy I. M., 2005, MNRAS, 363, 586
- Uttley et al. (2002) Uttley P., McHardy I. M., Papadakis I. E., 2002, MNRAS, 332, 231
- Vaughan et al. (2003) Vaughan S., Edelson R., Warwick R. S., Uttley P., 2003, MNRAS, 345, 1271
- Woo & Urry (2002) Woo J.-H., Urry C. M., 2002, ApJ, 579, 530
- Zhou & Wang (2005) Zhou X.-L., Wang J.-M., 2005, ApJL, 618, L83
- Zhou et al. (2010) Zhou X.-L., Zhang S.-N., Wang D.-X., Zhu L., 2010, ApJ, 710, 16