xx–xx
The evolution of galaxy sizes
Abstract
We present a study of galaxy sizes in the local Universe as a function of galaxy environment, comparing clusters and the general field. Galaxies with radii and masses comparable to high-z massive and compact galaxies represent 4.4% of all galaxies more massive than in the field. Such galaxies are 3 times more frequent in clusters than in the field. Most of them are early-type galaxies with intermediate to old stellar populations. There is a trend of smaller radii for older luminosity-weighted ages at fixed galaxy mass. We show the relation between size and luminosity-weighted age for galaxies of different stellar masses and in different environments. We compare with high-z data to quantify the evolution of galaxy sizes. We find that, once the progenitor bias due to the relation between galaxy size and stellar age is removed, the average amount of size evolution of individual galaxies between high- and low-z is mild, of the order of a factor 1.6.
keywords:
galaxies: evolution — galaxies: structure — galaxies: fundamental parameters1 Introduction
Many recent observational studies have found a population of high-z (), massive (), compact () galaxies (e.g. Daddi et al. 2005, Trujillo et al. 2006, Cimatti et al. 2008, van Dokkum et al. 2008, Saracco et al. 2009, Cassata et al. 2011 and others). In the great majority of these studies, galaxies are selected to be already passively evolving (devoid of ongoing star formation) at the redshift they are observed. Passive galaxies at high-z have been found to display a wide range in sizes, from extremely compact to those whose sizes are comparable to normal galaxies in the local Universe (Saracco et al. 2009, Mancini et al. 2010, Cassata et al. 2011).
Most high-z works use as local comparison the r-band Sloan median mass-size relation for galaxies with Sersic index from Shen et al. (2003). Trujillo et al. (2009) and Taylor et al. (2010) searched for massive compact galaxies in Sloan and both found very few such galaxies in the general field at low redshift.
Here we present a search for massive and compact galaxies in different environments at low redshift using two galaxy samples: for the general field we use the Padova Millennium Galaxy and Group Catalogue at (PM2GC, Calvi et al. 2011), and for galaxy clusters the WIde-field Nearby Galaxy cluster Survey at (WINGS, Fasano et al. 2006).
“Superdense” galaxies, with galaxy stellar masses and effective sizes similar to those of high-z galaxies (), were found to represent of all galaxies with in WINGS clusters based on V-band images (Valentinuzzi et al. 2010, hereafter V10). Given the paucity of similar galaxies in the field studies mentioned above, this suggested a strong environmental dependence in the frequency of massive and compact galaxies at low-z (V10).
V10, and a number of other works (Saracco et al. 2011, Cassata et al. 2011, Cappellari et al. 2012 and these proceedings, to name a few) also found that galaxy sizes depend on the age of stars: galaxies with older luminosity-weighted ages (hereafter, LW ages) are smaller. As a consequence, selecting the oldest galaxies at high-z (those that have already stopped forming stars at ) means selecting the most compact ones. At lower redshifts, larger galaxies stop forming stars and enter the passive galaxy samples, causing the median mass-size relation to move to larger radii at fixed mass. Hence, in order to measure the correct amount of size evolution, the sizes of high-z galaxies should be compared only with those of galaxies whose LW age is so old that they were already passive at high-z (V10).
Moreover, in clusters at , superdense galaxies are 40% of the galaxy population, and the mass-size relation in clusters evolves very little between and (Valentinuzzi et al. 2010b).
2 Results in the field
Recently (Poggianti et al. 2012, submitted), we have searched for massive compact galaxies in the field using the PM2GC, a sample of low-z galaxies representative of the general field population drawn from the Millennium Galaxy Catalogue (MGC, Liske et al. 2003, Driver et al. 2005). We measured galaxy radii and galaxy morphologies with GASPHOT (Pignatelli & Fasano 2006) and MORPHOT (Fasano et al. 2012), respectively, from the MGC B-band images. Size and stellar mass estimates are in very good agreement with other existing measurements.
After inspecting each superdense candidate, we found 44 superdense galaxies out of 995 galaxies in the PM2GC, corresponding to a fraction of 4.4% among galaxies with . The corresponding fraction in clusters from B-band WINGS images is 11.8% (about half of the V-band percentage found by V10). This is due to the small but systematic change of galaxy radii with wavelength, with radii increasing using bluer passbands.
Most of the PM2GC superdense galaxies are red, early-type galaxies (70% S0s and 23% ellipticals), quite flattened, with a mean Sersic index , and have intermediate-to-old stellar populations, with a mean LW age =5.5 Gyr and a mean mass-weighted age =9.3 Gyr.
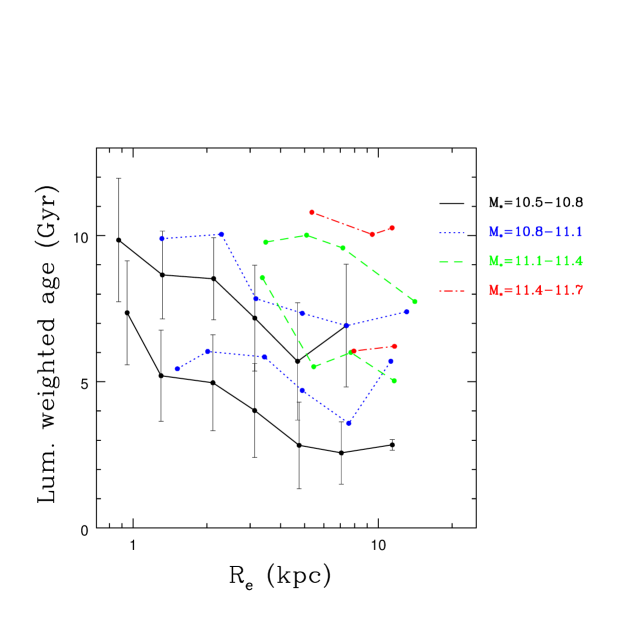
Figure 1 illustrates the relation between size and LW age for galaxies in different mass bins and different environments (for each galaxy mass, the lower line is the PM2GC, and the upper line is WINGS). At given size and environment, more massive galaxies have older ages, both in clusters and in the field, following downsizing. The plot shows that, at given mass and environment, galaxies with smaller radii (more compact) are older. This effect is present both in clusters and in the field, although our analysis (not shown) finds that the dependence of the median mass-size relation on stellar age is stronger in clusters than in the field.
As a consequence, the population of passive galaxies at low-z includes both the old, on average small galaxies and those galaxies that have stopped forming stars at later times that have on average larger sizes. This needs to be taken into account when trying to quantify the evolution of the high-z samples.
2.1 Size evolution: comparison with high-z studies
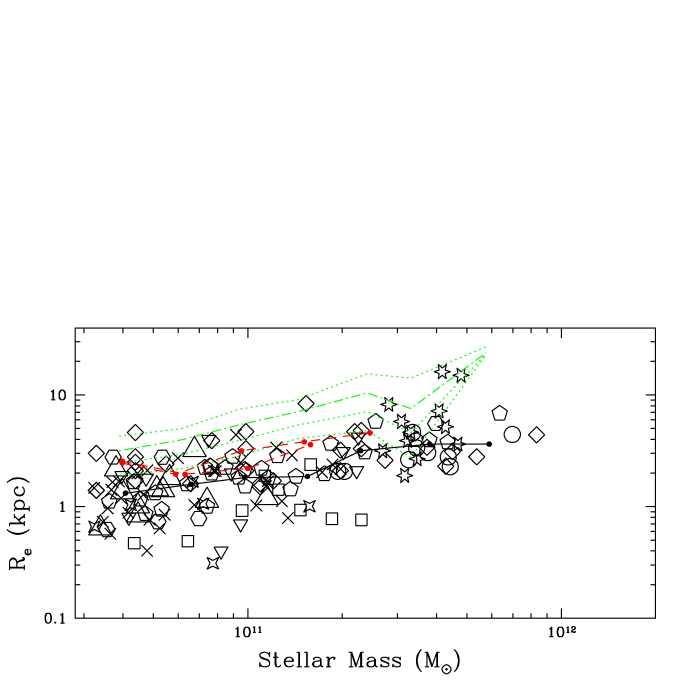
Figure 2 shows a compilation of various datasets of galaxies at (different symbols, Daddi et al. 2005, Trujillo et al. 2006, van Dokkum et al. 2008, Cimatti et al. 2008, van der Wel et al. 2008, Saracco et al. 2009, Damjanov et al. 2009, Mancini et al. 2010, Cassata et al. 2011) and their median mass-size relation (solid line).
To quantify the evolution in size, we compare this relation with the median mass-size relation of old (LW age Gyr) galaxies in WINGS and the PM2GC (two dotted lines in Fig. 2). We find an average evolution of 0.2-0.25dex, a factor 1.6-1.8, using WINGS and PM2GC, respectively. This is half of what is found using all, passive or galaxies in the PM2GC, as usually done in the literature. The evolution of galaxy sizes is therefore much smaller than would be (erroneously) inferred at face value considering as local descendants the whole passive galaxy population regardless of age.
Using old WINGS or old PM2GC galaxies does not significantly change the results. It is however important to stress that our simulations (Millennium Simulation + semi-analytic model presented in De Lucia & Blaizot 2007) predict that 60% of all galaxies that at are massive () and passive end up in haloes with masses above by , therefore in WINGS-like clusters in the local Universe. Hence, a large fraction of the high-z passive and massive galaxies have evolved into today’s cluster galaxies. This may explain the strong environmental dependence of the superdense incidence we find at low-z, and indicates that galaxies in nearby clusters are the most appropriate local counterparts to the high-z studies.
References
- [] Calvi, R., Poggianti, B.M., Vulcani, B. 2011, MNRAS, 416, 727
- [] Cappellari, M. et al. 2012, MNRAS, in press (arXiv: 1208.3523)
- [] Cassata, P. et al. 2011, ApJ, 743, 96
- [] Cimatti, A. et al. 2008, A&A, 482, 21
- [] Daddi, E. et al. 2005, ApJ, 626, 680
- [] Damjanov, I. et al. 2009, ApJ, 695, 101
- [] De Lucia, G., Blaizot, J. 2007, MNRAS, 375, 2
- [] Driver, S.P., Liske, J., Cross, N.J.G., De Propris, R., Allen, P.D. 2005, MNRAS, 360, 81
- [] Fasano, G. et al. 2006, A&A, 445, 805
- [] Fasano, G. et al. 2012, MNRAS, 420, 926
- [] Liske, J., Lemon, D.J., Driver, S.P., Cross, N.J.G., Couch, W.J. 2003, MNRAS, 344, 307
- [] Mancini, C. et al. 2010, MNRAS, 401, 933
- [] Saracco, P., Longhetti, M., Andreon, S. 2009, MNRAS, 392, 718
- [] Saracco, P., Longhetti, M., Gargiulo, A. 2011, MNRAS, 412, 2707
- [] Shen, S. et al. 2003, MNRAS, 343, 978
- [] Taylor, E.N., Franx, M., Glazebrook, K., Brinchmann, J., van der Wel, A., van Dokkum, P.G 2010, ApJ, 720, 723
- [] Valentinuzzi, T. et al. 2010, ApJ, 712, 226
- [] Trujillo, I. et al. 2006, MNRAS, 373, L36
- [] Valentinuzzi, T. et al. 2010, ApJ, 712, 226
- [] Valentinuzzi, T. et al. 2010b, ApJL, 721, L19
- [] van der Wel, A. et al. 2008, ApJ, 688, 48
- [] van Dokkum, P. et al. 2008, ApJL, 677, L5