The Physical Structure of Protoplanetary Disks: the Serpens Cluster Compared with Other Regions
Abstract
Spectral energy distributions are presented for 94 young stars surrounded by disks in the Serpens Molecular Cloud, based on photometry and Spitzer IRS spectra. Most of the stars have spectroscopically determined spectral types. Taking a distance to the cloud of 415 pc rather than 259 pc, the distribution of ages is shifted to lower values, in the 1 – 3 Myr range, with a tail up to 10 Myr. The mass distribution spans 0.2 – 1.2 M⊙, with median mass of 0.7 M⊙. The distribution of fractional disk luminosities in Serpens resembles that of the young Taurus Molecular Cloud, with most disks consistent with optically thick, passively irradiated disks in a variety of disk geometries ( 0.1). In contrast, the distributions for the older Upper Scorpius and Chamaeleontis clusters are dominated by optically thin lower luminosity disks ( 0.02). This evolution in fractional disk luminosities is concurrent with that of disk fractions: with time disks become fainter and the disk fractions decrease. The actively accreting and non-accreting stars (based on H data) in Serpens show very similar distributions in fractional disk luminosities, differing only in the brighter tail dominated by strongly accreting stars. In contrast with a sample of Herbig Ae/Be stars, the T Tauri stars in Serpens do not have a clear separation in fractional disk luminosities for different disk geometries: both flared and flat disks present wider, overlapping distributions. This result is consistent with previous suggestions of a faster evolution for disks around Herbig Ae/Be stars. Furthermore, the results for the mineralogy of the dust in the disk surface (grain sizes, temperatures and crystallinity fractions, as derived from Spitzer IRS spectra) do not show any correlation to either stellar and disk characteristics or mean cluster age in the 1 – 10 Myr range probed here. A possible explanation for the lack of correlation is that the processes affecting the dust within disks have short timescales, happening repeatedly, making it difficult to distinguish long lasting evolutionary effects.
Subject headings:
circumstellar matter – methods: statistical – stars: pre–main-sequence – planetary systems: protoplanetary disks1. Introduction
Protoplanetary disks are a natural consequence of the star formation process. They are created as a result of the conservation of angular momentum when a dense slowly rotating core in a molecular cloud collapses to form a star (Shu et al., 1993; Myers et al., 2000). There is evidence that the initial disk mass is a function of the stellar mass (Andrews & Williams, 2005; Greaves & Rice, 2010). In addition, different disk lifetimes have been suggested for stars of different masses, with disks around low-mass stars lasting longer (Lada et al., 2006; Carpenter et al., 2006; Kennedy & Kenyon, 2009). If true, these relations put strong constraints on the number of planets, and of which type, could be formed in such disks. A great diversity in planetary systems is observed for the more than 750 exo-planets confirmed to date (Udry & Santos 2007,111http://exoplanet.eu) and it is important to explore whether the variety of planets is a consequence of the diversification in stars and their protoplanetary disks.
Combining theory, observations and laboratory experiments, there has been significant progress in our understanding on initial growth from dust into pebbles (Weidenschilling, 1980; Dominik & Tielens, 1997; Blum & Wurm, 2008). The further growth is still under debate, and is a very active field in simulations of planet formation. In addition to growth, a change in dust mineralogy has been observed. Crystallization of the originally amorphous interstellar grains is necessary to understand the high crystallinity fraction found in many comets and interplanetary dust grains (see Wooden et al. 2007; Pontoppidan & Brearley 2010; Henning 2010 for recent reviews). An open question is to what extent these dust properties are related to the stellar and disk characteristics.
This work presents the spectral energy distributions (SEDs) of the young stellar population of the Serpens Molecular Cloud discovered by the Spitzer Space Telescope legacy program “From molecular cores to planet-forming disks” (c2d, Evans et al. 2003), together with Spitzer IRS spectra (Oliveira et al., 2010, 2011). Combined with photometry (from optical to mid-IR, Harvey et al. 2006, 2007a, 2007b; Spezzi et al. 2010) and stellar spectral types, these data provide the necessary ingredients to construct the SEDs and study the physical structure of disks (and its dust) surrounding the young stars in Serpens.
For low-mass stars, the stellar and disk characteristics cannot be easily separated as is the case for higher mass Herbig stars (e.g. Meeus et al. 2001), unless the stellar characteristics are well known. In the last decade, a growing number of low-mass star forming regions have been surveyed throughout the wavelength spectrum. The original prototype, Taurus (e.g. Kenyon & Hartmann 1987, 1995), is joined by Ophiuchus, Chamaeleon, Lupus amongst others (Luhman, 2004, 2008; Comerón, 2008; Eiroa et al., 2008; Evans et al., 2009), probing different stellar densities, environments, sample sizes and mean cluster ages. To test the universality of the results achieved in this field, we have engaged in a systematic study of stars and their disks in several of the nearby low-mass star-forming regions (Alcalá et al., 2008; Spezzi et al., 2008, 2010; Merín et al., 2010; Mortier et al., 2011). Similar procedures to those presented here for constructing SEDs are being performed for a large number of systems in most of the nearby star-forming regions observed by Spitzer, considering all young stellar objects YSOs) for which the central star has been optically characterized in the literature. This large database allows comparison between the disks in Serpens with those in other star-forming regions, of different mean ages and environments.
The well characterized Taurus sample (2 Myr, Hartmann et al. 2001; Luhman et al. 2010) is used here in comparison with Serpens, both probing the young bin of disk evolution. Taurus has been studied over a wide range of wavelengths, from X-rays to radio, which allows an extensive characterization of its members that are still surrounded by disks, as well as the lower fraction of young stars (40%) around which disks have already dissipated (e.g. Padgett et al. 1999; Andrews & Williams 2005; Güdel et al. 2007). Older populations are probed using well-studied samples in Chamaeleontis (6 Myr, Luhman & Steeghs 2004; Sicilia-Aguilar et al. 2009) and Upper Scorpius (originally thought to be 5 Myr, but recently found to be 11 Myr, Blaauw 1978; Pecaut et al. 2012; Dahm & Carpenter 2009). The stellar and disk characteristics for hundreds of objects in Taurus, Upper Scorpius and Chamaeleontis with well studied stars and disks (making these samples statistically robust) will be used in this work to place Serpens into an evolutionary context.
This article is presented as follows: the SEDs are constructed in § 2. Specifically, the data are presented in § 2.1, the procedure to construct the SEDs is described in § 2.2. Using the new distance estimate for the cloud ( = 415 pc, Dzib et al. 2010), an updated distribution of ages and masses is derived in § 2.3. The disk characteristics are discussed in § 3. With stars and disks well characterized, § 4 investigates to what extent they affect each other and whether the dust properties are correlated with either. Finally, the conclusions are presented in § 5.
2. Spectral Energy Distributions
2.1. Data
The Serpens Molecular Cloud has been imaged by Spitzer as part of the c2d program. The detected sources in the IRAC and MIPS bands were published by Harvey et al. (2006) and Harvey et al. (2007a), respectively. By combining the data in all bands, Harvey et al. (2007b) could identify a red population classified as YSO candidates, which is interpreted as being due to emission from the disk. Confirmation of their nature as young object members of the cloud was done through spectroscopy. The final catalog is band-merged with the Two Micron All Sky Survey (2MASS), providing data at , , (at 1.2, 1.6 and 2.2 m, respectively), IRAC bands 1 through 4 (at 3.6, 4.5, 5.8 and 8.0 m) and MIPS bands 1 and 2 (at 24 and 70 m), when available. Oliveira et al. (2010) describe the complete, flux-limited sample of YSOs in Serpens that is used in this work, for which Spitzer IRS spectra have been taken. The 115 objects comprise the entire young IR-excess population of Serpens that is brighter than 3 mJy at 8 m (from the catalog of Harvey et al. 2007b). With this sensitivity, we can detect YSOs close to the brown dwarf limit. Of these 115 young objects, 21 are shown to be still embedded in a dusty envelope. The remaining 94 objects, classified as disk sources, are the subject of this work. Oliveira et al. (2009) derived spectral types (and therefore also temperatures) from optical spectroscopy for 62% of the Serpens flux-limited disk sample (58 objects). The remaining 36 objects are too extincted and could not be observed spectroscopically using 4-m class telescopes. These objects have spectral types derived from photometry alone, which is less reliable than derivations from spectroscopy. Optical -band photometry is available covering exactly the same area of Serpens as was covered by the c2d Spitzer observations (Spezzi et al., 2010), however the high extinction toward a few directions in Serpens makes it impossible for optical detection. That means that not all objects have optical photometric data available.
The Spitzer IRS mid-IR spectroscopy (5 – 35 m) for this sample cover the silicate bands at 10 and 20 m that are emitted by the dust in the surface layers of optically thick protoplanetary disks (Oliveira et al., 2010). Information about the typical sizes, composition and crystalline fractions of the emitting dust can be obtained from fitting models to these silicate bands. Those results are presented in Oliveira et al. (2011).
2.2. Building the SEDs
The first step to build the SED of a given object is to determine the stellar emission. For each object, a NextGen stellar photosphere (Hauschildt et al., 1999) corresponding to the spectral type of said star is selected. This model photosphere is scaled to either the optical or the 2MASS photometric point to account for the object’s brightness. The observed photometric data are corrected for extinction from its visual extinction () using the Weingartner & Draine (2001) extinction law, with = 5.5. For objects without values derived from the optical spectroscopy, these values are estimated by the best fit of the optical/near-IR photometry to the NextGen photosphere, on a close visual inspection of the final result SEDs.
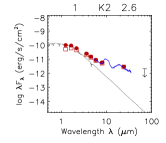
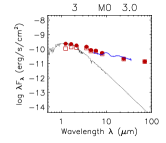
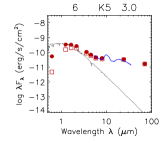
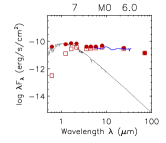
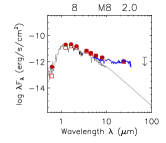
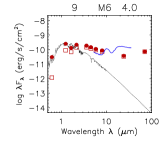
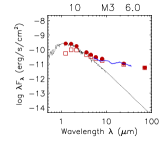
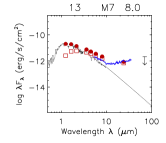
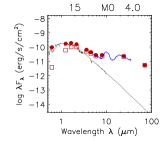
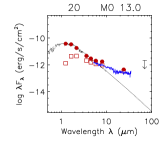
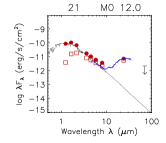
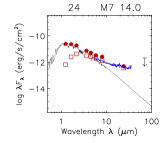
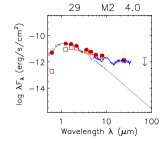
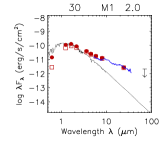
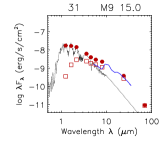
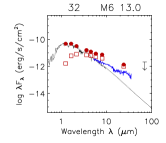
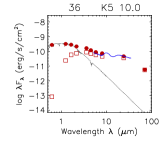
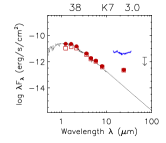
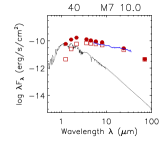
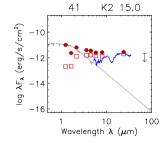
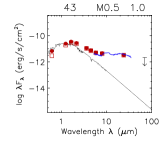
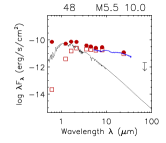
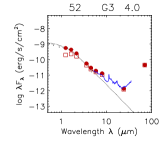
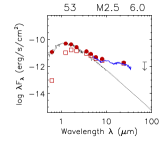
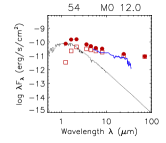
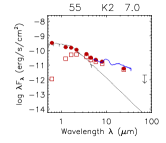
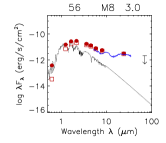
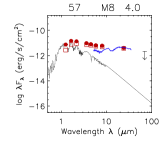
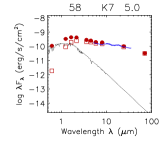
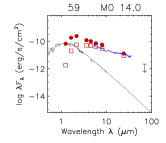
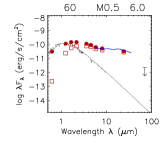
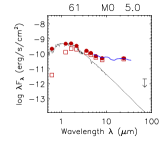
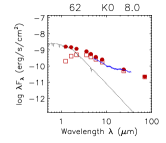
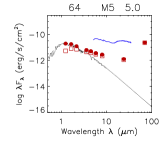
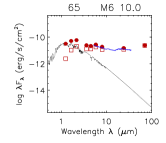
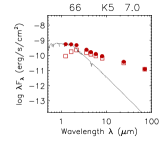
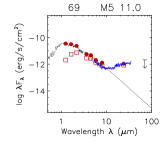
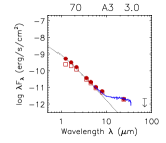
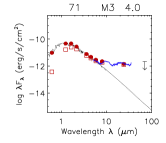
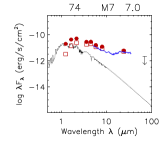
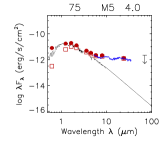
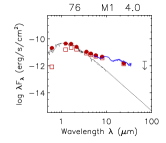
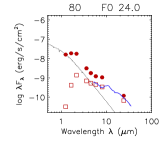
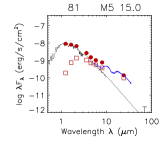
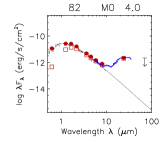
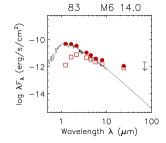
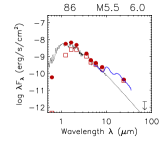
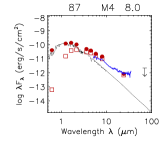
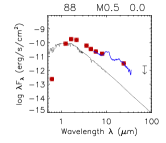
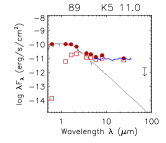
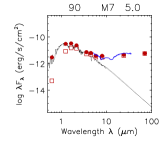
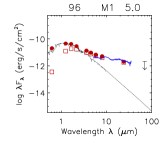
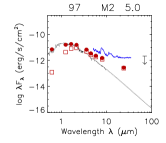
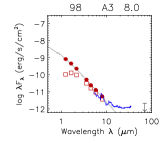
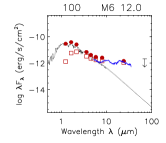
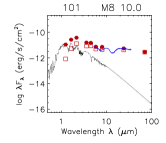
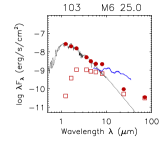
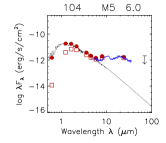
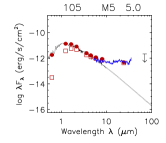
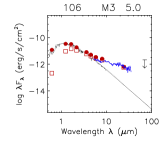
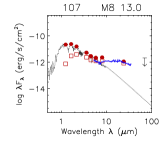
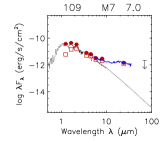
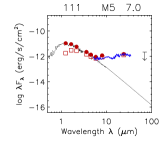
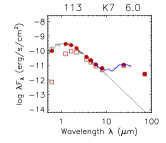
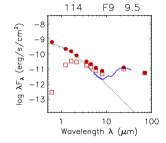
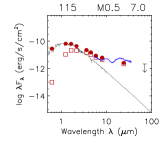
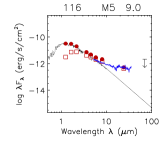
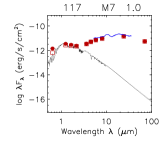
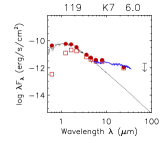
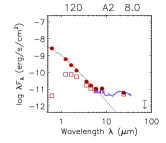
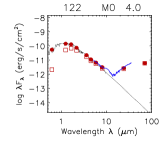
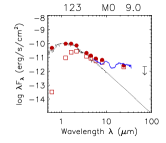
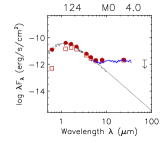
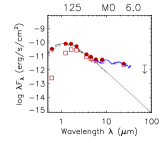
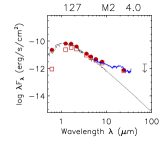
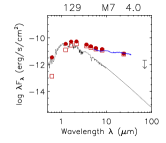
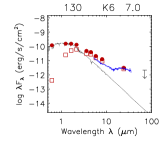
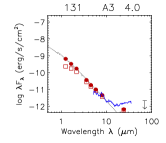
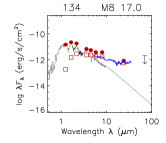
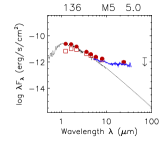
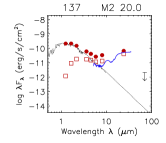
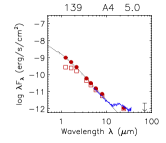
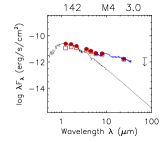
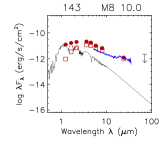
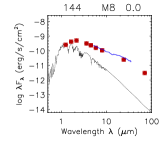
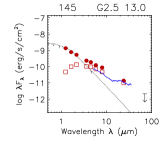
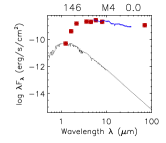
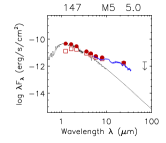
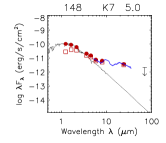
Figure 1 shows the first 16 SEDs constructed for the objects in the sample (the remaining SEDs are shown in the appendix). No SEDs could be constructed for objects #42 and 94 due to the lack of either optical or 2MASS near-IR photometric detections. For the other sources, Figure 1 shows the NextGen model photosphere (dashed black line), observed photometry (open squares), dereddened photometry (filled circles) and IRS spectrum (thick blue line). When there is no detection for the MIPS2 band at 70 m, an upper limit is indicated by a downward arrow. Significant differences in the amounts of IR radiation in excess of the stellar photosphere are evident. This translates into a diversity of disk geometries, as inferred by mid-IR data (Oliveira et al., 2010).

Once the SEDs are built, it is possible to separate the radiation that is being emitted by the star from that re-emitted by the disk – the integration of the radiation emitted by the system at all wavelengths gives the bolometric brightness of the entire system. This is a direct integration up to 70 m. For longer wavelengths, an extrapolation is applied as suggested by Chavarria (1981), which assumes the hottest black body that fits the data at the longest available wavelength. This results in a typical contribution to the total luminosity on the order of 10%. By integrating the scaled NextGen model photosphere, the stellar luminosity () can be obtained. Similar methods for luminosity estimates are widely used in the literature (e.g. Kenyon & Hartmann 1995; Alcalá et al. 2008). If is subtracted from the emission of the entire system, the disk luminosity () can be derived. These integrations take into consideration the distance to the star, besides the fluxes at different bands. The errors in the derivation of and are propagated from the errors in the distance, extinction ( 2 mag) and in the spectral type determination, and can be found in Table 1. The stellar and fractional disk luminosities for the objects in Taurus, Upper Scorpius and Chamaeleontis were calculated in the exact same manner as for Serpens.
2.3. Masses and Ages Revisited
In their derivation of stellar luminosities for the Serpens YSOs with optical spectroscopy, Oliveira et al. (2009) adopted a distance to Serpens of 259 37 pc (Straizys et al. 1996, a discussion using = 193 13 pc of Knude 2010 is included). However, since then the distance to the cloud has been revisited. Dzib et al. (2010) find a distance of 415 15 pc to the Serpens Core from Very Long Baseline Array parallax observations of one star. This new distance is used in this work, which is also compatible with the Chandra observations of the Serpens Core by Winston et al. (2010).
The new stellar luminosities, derived for the distance of 415 pc, imply that the young stars in Serpens move up in the Hertzsprung-Russell (HR) diagram. Following Oliveira et al. (2009), is determined from the object’s spectral type as follows: for stars earlier than M0 the relationship of Kenyon & Hartmann (1995) is used, while for stars of later spectral type that of Luhman et al. (2003) is used. The errors in temperature are translated directly from the errors in spectral types. With and in hand, the objects can be placed in the HR diagram. For YSOs, ages and masses can be derived by overlaying pre-main sequence (PMS) evolutionary tracks on the HR diagram, and comparing the position of an object to the isochrones and mass tracks. Due to the intrinsic physics and validation of parameters, the models of Baraffe et al. (1998) are used for stars with masses smaller than 1.4 M⊙, while more massive stars are compared to the models of Siess et al. (2000). The new individual ages and masses are presented in Table 1.
Figure 2 shows this updated distribution of masses and ages for the YSOs in Serpens. Compared to the results of Oliveira et al. (2009) for = 259 pc, it is seen that the mass distribution does not change much, while the age distribution does. This is understood by looking at the isochrones and mass tracks of a given model (e.g. Figure 7 of Oliveira et al. 2009): for the temperature range of the stars in Serpens (mostly K- and M-type), mass tracks are almost vertical. This means that a change in luminosity due to the new distance hardly affects the inferred mass. From the isochrones, however, it can be noted that in general higher stellar luminosities (for this further distance) imply younger ages. The median mass derived here is 0.7 M⊙ and median age is 2.3 Myr, while Oliveira et al. (2009) found 0.7 M⊙ and 5 Myr. As for most star-forming regions studied to date, a spread around the median age is seen for Serpens, with a tail up to 10 Myr. The spread, however, does not resemble a bimodal distribution of young stars as it is seen for Orion, which has been found to be the consequence of the projection of another potentially unrelated foreground stellar population (Alves & Bouy, 2012).

2.4. Notes on Individual Objects
Since the quantity of data available for each object in this sample varies, not all SEDs produce good results or yield physical parameters. Objects 31, 62, 80, 81, 86 and 103 are found to be much too luminous, which is not consistent with them being members of Serpens. Thus, they could not be placed in the HR diagram, and therefore no ages and masses could be determined. For objects 31, 80 and 103 the degeneracy between spectral type and extinction due to the lack of optical spectroscopy makes it difficult to establish good values for both parameters. Confirmation of spectral types, better extinction determination, and the addition of optical photometry is necessary to revisit these objects and precisely determine their stellar parameters and whether they belong to the cloud or are contaminants.
Furthermore, objects 7, 40, 48, 54, 56, 59, 60, 65, 74, 88, 101, 117 and 129 show flat SEDs. This produces large fractional disk luminosities that deserve attention. None of these objects show signs of being (close to) edge-on. Edge-on systems will indeed produce high relative disk luminosities, but will also produce other signatures (e.g. inability of fitting optical/near-IR photometry in its SED; Merín et al. 2010), which is not the case of any for the high luminosity disks shown here. Most likely, those objects are in transition from stage I (embedded) to stage II (disks) or surrounded by a nebulosity, leading to their classification as flat sources.
In the SED of object 64 it can be seen that its photometry and IRS spectra do not match. This could be due to IR variability (e.g. Muzerolle et al. 2009). The photometry was used for the luminosity derivation. Lastly, object 41 seems to have a mismatch in the 2MASS (photometry) making the results unreliable. For all these objects, the addition of more data, especially at longer wavelength, will help in understanding their nature and the derivation of accurate parameters.
3. Disk Properties
3.1. Completeness of the Sample
The Serpens sample presented here is flux-limited and selected based on IR excess. That means that, by definition of the selection criteria, stars without disks and with disks fainter than 3 mJy at 8 m are not part of the sample. A conservative calculation of the fractional disk luminosity of the missed sources (considering a flux lower than 3 mJy at 8 m) was performed as described below.
Due to the selection criteria, the disk population missed in Serpens should be fainter than that presented here. Harvey et al. (2007b) identified a population of 235 IR-excess sources in Serpens, called YSO candidates. 147 of the original sample were further studied with the IRS spectrograph onboard Spitzer, comprising the sample presented here. This means that about 88 potential young stars with disks are missing. Considering the 20 % contamination fraction of background sources in the direction of Serpens (due to its low galactic latitude, Oliveira et al. 2009), conservatively about 70 of these 88 objects could be young stars that were missed, which should populate the faint end of the distribution.
3.2. Disk Luminosities
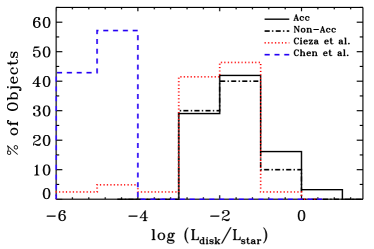
The construction of the SEDs is one way to study the diversity of disks in the same region, most of which have ages with a narrow span around a few Myr (Figure 2). It is clear from the SEDs that different types of disks are present in Serpens, some with substantial IR excess, others almost entirely dissipated. This is even more clear by looking at the distribution of fractional disk luminosities () for this sample, which is presented in Figure 3. Here, Serpens (solid black line) is compared to Taurus, equally young yet very different in terms of cloud structure and environment (dotted red line). The peak and distribution of these two samples are very similar, with the bulk of each population showing fairly bright disks (peak 0.1, median 0.2), the majority of which are consistent with passively irradiated disks ( 0.2, Kenyon & Hartmann 1987). This is in agreement with studies of disk geometry as inferred from IR colors, which show a large fraction of disks in young clusters to be flared (e.g. Megeath et al. 2005; Furlan et al. 2006; Sicilia-Aguilar et al. 2006; Gutermuth et al. 2008; Muzerolle et al. 2010; Oliveira et al. 2010). Figure 3 includes a correction for the possible missed sources discussed in § 3.1 (dashed black line), distributed in fractional disk luminosity bins according to their IR fluxes (from Harvey et al. 2007b). Those could account for the difference between Serpens and Taurus in the faintest bin of in Figure 3, but should not be able to shift the peak of the distribution for Serpens. These findings support the idea that these two star-forming regions are similar in spite of their different environments and star formation rates, and that together they provide a good probe of the young bin of disk evolution.
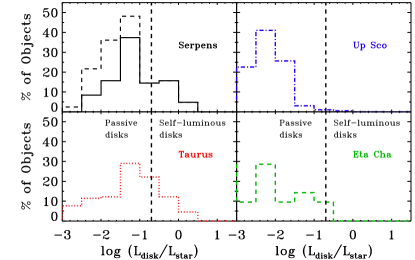
Furthermore, Figure 3 shows the distribution of for samples in the older Upper Scorpius and Chamaeleontis clusters with optical and IR data (de Zeeuw et al., 1999; Preibisch & Zinnecker, 1999; Preibisch et al., 2002; Mamajek et al., 2002; Haisch et al., 2005; Megeath et al., 2005; Dahm & Carpenter, 2009; Sicilia-Aguilar et al., 2009). These older regions are known to have lower disk fractions (40% for Cha and 17% for Up Sco; Megeath et al. 2005; Carpenter et al. 2006), meaning that most of the member stars have already fully dissipated their disks. Figure 3 clearly shows this difference in relation to the young Serpens and Taurus clouds, with distributions that peak (and spread) at considerably lower disk luminosities. The vertical dotted lines roughly separate luminosity ratios that can be explained by different mechanisms: self-luminous disks (, Kenyon & Hartmann 1987) and passive disks. This illustrative boundary was calculated by taking the maximum amount of light that a flared disk would be able to re-radiate by only reprocessing the stellar radiation. “Debris”-like disks are considerably fainter (; Chen et al. 2006).
The difference in observed fractional disk luminosities between the young Serpens and Taurus and the old Upper Sco and Cha populations has implications on our understanding of disk evolution. Figure 3 shows an evolution in disk brightness that is concurrent with that of disk fraction (Haisch et al., 2001; Hernández et al., 2008; Mamajek, 2009). With time, not only the fraction of stars that have disks diminishes, but the remaining disks tend to be fainter (see also Sicilia-Aguilar et al. 2006; Hernández et al. 2007, 2008; Currie & Kenyon 2009). This conclusion is in agreement with models of disk evolution that include long-term dust growth and settling and predict disks to become flatter and fainter within a few million years (e.g. Chiang & Goldreich 1997; Dullemond & Dominik 2004). Moreover, Figure 3 is consistent with the new younger age of Serpens derived in § 2.3, since the distribution in Serpens is so similar to that in Taurus and very different than those in Upper Sco and Cha.
3.3. Accretion Properties
Figure 4 shows an additional comparison of the disks in Serpens with a sample of weak-line T Tauri stars (WTTS, Cieza et al. 2007) and a sample of debris disks around T Tauri and Herbig Ae/Be stars (Chen et al., 2006). The WTTS sample consists of sources selected based on the original definition of weak H emission. This criterion also implies low accretion rates. In our samples, objects are classified as accreting according to two prescriptions. The first method is based on the width at 10% of peak intensity of the H line (from the relationship of Natta et al. 2004) where objects are classified as accreting if the width is greater than 270 km s-1 (White & Basri, 2003). The second method is based on the equivalent width of H and its spectral type, according to White & Basri (2003). Oliveira et al. (2009) present mass accretion rates based on the H data for the Serpens sample, with the majority of objects fulfilling both criteria for classification as either accreting or non-accreting. It can be seen in Figure 4 that of the accreting (CTTS, solid black line) and non-accreting (WTTS, dot-dashed line) stars in Serpens overlap with the WTTS sample of Cieza et al. (2007) (dotted red line). The Serpens population and the Cieza WTTSs differ in the distribution tails. The Cieza WTTS sample has a faint tail that overlaps with the debris disk population (dashed blue line), while the Serpens population shows a bright tail.
Within Serpens, the accreting and non-accreting sub-samples overlap, differing slightly at the brighter end of the distribution, which is dominated by accreting objects. This is more clearly seen by looking at the median fractional disk luminosity which is 0.21 and 0.11 for accreting and non-accreting objects, respectively. The median fractional disk luminosity for the entire population of Serpens is 0.20. The few very bright (self-luminous) disks are actively accreting. These results confirm the finding by several authors that WTTS may very well have massive disks not much different from those of CTTS (e.g. Strom et al. 1989; Cieza et al. 2007; Wahhaj et al. 2010). At the other end, the faint tail of the Cieza WTTS population overlaps with the debris sample and should represent non-accreting stars surrounded by very flat optically thin disks. Diskless WTTS in Serpens are not yet identified and therefore not shown in this plot.
3.4. Comparison with Herbig Ae/Be Stars
Meeus et al. (2001) found that the disks around higher mass Herbig Ae/Be stars can be divided into two groups, according to the disk geometry: group I comprises sources with considerable IR excess, associated with a flared geometry; group II consists of little IR excess, associated with a geometrically thin midplane, shadowed by the puffed-up disk inner rim. Meeus et al. (2001) showed that the distributions of fractional disk luminosities for the two groups are different, with a mean of 0.52 for group I and 0.17 for group II.
Figure 5 compares the two groups of Herbig Ae/Be stars with the young stars in Serpens, separated in disk geometry according to the ratio between the fluxes at 30 and 13 m (, Oliveira et al. 2010). Although the mid-IR data for the cooler disks around T Tauri stars probe a smaller portion of the disk compared to the more massive Herbig Ae/Be counterparts (Kessler-Silacci et al., 2007), the fractional disk luminosities calculated here account for the bulk of the disk. A comparison between cooler (T Tauri) and hotter (Herbig Ae/Be) stars can inform about the universality of processes taking place in these disks, and whether they evolve in a similar manner despite the differences in masses and incident radiation field. It is seen that the geometry separation between flared and flat disks at = 1.5 for T Tauri stars is not reflected with an accompanying separation in , which is the case for groups I and II of the Herbig Ae/Be stars (dotted red and dashed blue lines, respectively). Although both the flared and flat T Tauri disks span the same luminosity range, the peaks of the distributions are slightly different, yielding marginally distinctive median fractional disk luminosities: is 0.21 for the flared disks and 0.17 for flat disks.
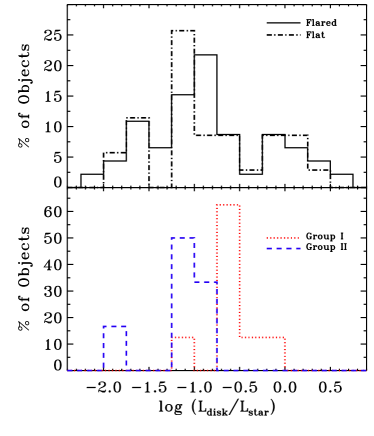
It can be noted from Figure 5 that the great majority of disks around Herbig Ae/Be stars are concentrated in narrow ranges of fractional disk luminosities, right at the border between self-luminous and passively irradiated disks, showing a bimodal distribution for groups I and II. The T Tauri stars, on the other hand, span a much wider range of . The most striking difference between T Tauri and Herbig Ae/Be stars are both tails of the distribution. The lack of relatively very faint and very bright disks around Herbig Ae/Be stars could be a bias effect due to the considerably lower number of disks observed compared to their lower mass counterparts. Another possibility is that indeed disks around higher mass stars evolve faster, as suggested by previous studies (Lada et al., 2006; Carpenter et al., 2006; Kennedy & Kenyon, 2009). That would mean that the bright phase of disk evolution happens when the disks are still embedded in a spherical collapse envelope and consequently not visible, while the lack of the faint end of the distribution would imply a very fast evolution from flat disks to no disks at all, being only visible again in the debris stage. The latter finding is consistent with models of photoevaporation by high-energy photons (Clarke et al., 2001; Gorti & Hollenbach, 2009; Gorti et al., 2009; Ercolano et al., 2009). In those models, photoevaporation becomes important once the viscous transport declines below a certain threshold, rendering a quick dispersion of the disk on a timescale that is a small fraction of its lifetime. It is predicted that more massive stars could lose their disks in 105 yr, which could explain the difference in the faint end of the distributions seen in Figure 5.
4. Connection Between Stars and Disks
4.1. Variations with Stellar Type
While the late-type (K and M) population of Serpens spans a wide variety in disk shapes, the early-type (A, F and G) stars catch the attention. Two of the 9 early-type stars (#52 and 114) are surrounded by so-called cold or transitional disks, i.e. disks depleted of warm dust close to the star but otherwise massive (Oliveira et al., 2010; Merín et al., 2010). The majority, however, show very little IR excess (#70, 80, 98, 120, 131, 139, and 145) consistent with a rapid transition from stage II to III. Assuming that the stars in Serpens are nearly coeval, this result supports the conclusion of § 3.4 that disks around more massive stars evolve on faster timescales, albeit with lower number statistics for early-type stars.
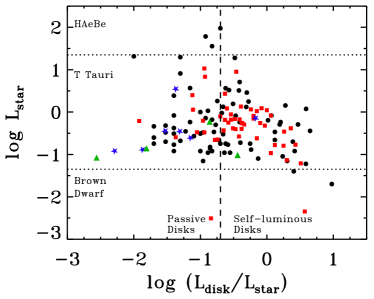
Figure 6 shows the stellar luminosity related to the fractional disk luminosity for the sample in Serpens (black points), Taurus (red points), Upper Sco (blue points), and Cha (green points). Horizontal dotted lines separate stellar luminosities of Herbig Ae/Be stars (earlier than F0), T Tauri stars (down to M7) and brown dwarfs (below M7), while the vertical line roughly separates self-luminous from passive disks, as in Figure 3. It can be seen that the few Herbig Ae stars in Serpens follow the locus of established by the larger sample of Herbig Ae/Be stars (Figure 5) by Meeus et al. (2001), not occupying either tail of the distribution.
4.2. Dust Characteristics
Besides the stellar and disk characteristics discussed in § 2, Oliveira et al. (2011) present the dust mineralogy, crystalline fractions and mean grain sizes in the surface of disks around the stars in Serpens, together with those disks in Taurus, Upper Sco and Cha for which IRS spectra are available, obtained using the same procedure: the B2C decomposition method (Olofsson et al., 2010). This method reproduces the IRS spectra over the full spectral range (5 – 35 m), assuming two dust populations: a warm component responsible for the 10 m emission arising from the inner disk (1 AU) and a colder component responsible for the 20 – 30 m emission, arising from more distant regions (10 AU). Each component is a combination of five different dust species (three amorphous and two crystalline) for different grain sizes (3 for amorphous and 2 for crystalline silicates). The fitting strategy relies on a random exploration of parameter space coupled with a Bayesian inference method. Those results, presented in Oliveira et al. (2011), combined with the analysis of their SEDs, allow the comparison of different disk and dust characteristics with those of their host stars for all 4 regions.
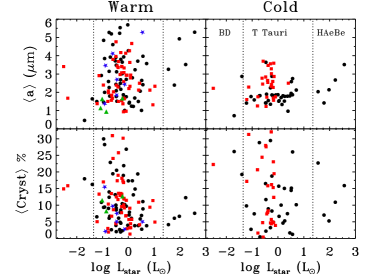
Figures 7, 8 and 9 relate the stellar and disk fractional luminosities and mass accretion rate, respectively, with the results from the B2C decomposition method of objects in Serpens, Taurus, Cha and Upper Sco. The two upper panels show the mean mass-averaged grain size and the two lower panels show the mean crystallinity fraction of the dust in the surface of the disks. The two left panels are the results for the warm component close to the stars, while the right panels show the results for the cold component, further away and deeper into the disk. The low number of Herbig Ae/Be stars and brown dwarfs in these samples do not allow a study across the stellar mass regime.
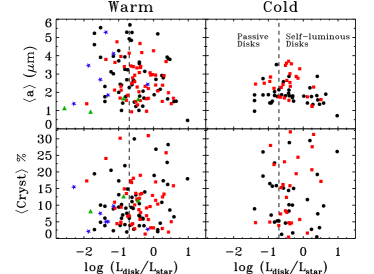
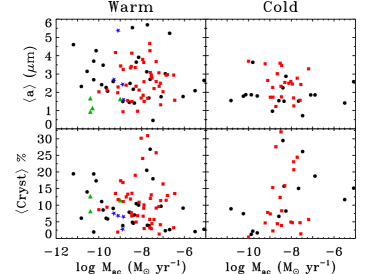
No strong correlations are seen in either Figures 7, 8 or 9, pointing to no direct cause-effect relationships between either stellar, disk fractional luminosity or mass accretion rates and the dominant grain size or crystallinity fraction of the surface dust in a disk. Similar results are found for the populations in Taurus (Watson et al., 2009), Tr 37 and NGC 7160 (Sicilia-Aguilar et al., 2007) and Cep OB2 (Sicilia-Aguilar et al., 2011) for smaller samples, with different methods of analysis. This picture is unchanged by separating objects into 3 classes of disk geometry: flared (), flat () and cold or transitional disks (, Brown et al. 2007; Merín et al. 2010; Oliveira et al. 2010). Distinct disk types show similar scatter.
The results in Figure 8 for T Tauri stars differ from those for Herbig Ae/Be stars (Meeus et al., 2001), which show a correlation between the mean grain size in the disk surface (as derived from the silicate features) and the geometry of the disk. Their study of a small number of disks (14 objects) argues that as the disk becomes flat (transitioning from group I into group II, and therefore decreasing , as they interpret), small dust grains are removed from the disk surface (by coagulation into bigger grains or blown away by the stellar radiation or stellar winds), which yields larger dominating grain sizes for flatter disks. Their results are supported by a less steep submilimeter slope for group II sources than for group I. Acke et al. (2004) studied the milimeter slope of a sample of 26 Herbig Ae/Be stars and found a correlation between this parameter and the geometry of the disk. It is important to note, however, that the milimeter data probe the dust population throughout the entire disk and do not say anything about the size of the dust in the disk surface, as is discussed here. Acke et al. (2004) suggest a geometry evolution from flared to self-shadowed with a concurrent evolution of the size of grains in the disk.
Similar results as those of Meeus et al. (2001) are found for T Tauri stars by Bouwman et al. (2008), albeit for a very small number of objects (7 systems). Lommen et al. (2010) also find a tentative correlation between submilimeter slope and grain size probed by the 10 m feature for a set of T Tauri disks. Those conclusions do not hold up for larger samples of disks around T Tauri stars. In contrast, Oliveira et al. (2010, 2011) show for much larger samples of T Tauri stars that the dust population in the disk surface is not the result of grain growth alone, but that also fragmentation of bigger grains enriches the population of small grain. This argument explains the presence of small grains in the surfaces of disks in all geometries (and even debris disks) and mean cluster ages. Larger samples of Herbig stars are needed to test whether this is also true for higher mass systems, or whether the concurrent dust and disk evolution is indeed mass dependent.
In addition to stellar and disk fractional luminosities and mass accretion rate, other stellar and disk parameters (such as stellar mass, disk colors and slopes) were investigated in relation to the mineralogical results for the T Tauri stars in our sample. Similar to Figures 7, 8 and 9, no strong correlation was found for any combination of parameters. This lack of direct correlations between the stellar and disk characteristics presents itself as a strong argument for the non-direct relationship of stellar and disk characteristics, in the range of parameters (time, mass, environment) probed by the objects presented here. That is, no direct causal relationship between stellar and disk characteristics is seen for T Tauri stars within a few Myr (1 – 10 Myr).
One possible explanation is that the physical correlations are washed away due to short timescale events. In addition to the above mentioned continuous balance between grain growth and destruction, episodic accretion events my play a role. An example is the case of the eruptive young star EX Lupi, which showed an increase in crystallinity fraction with increase in stellar luminosity right after outburst (Ábrahám et al., 2009). Juhász et al. (2012) showed that months after outburst the crystallinity fraction decreased from the post-outburst value. Processes that are efficient on short timescales such as variability (Carpenter et al., 2001; Eiroa et al., 2002; Bouvier et al., 2007; Muzerolle et al., 2009), vertical or radial mixing (e.g. Ciesla 2007; Visser & Dullemond 2010; Juhász et al. 2012) or dust crystallization/amorphization (Glauser et al., 2009) reconcile the notion that evolution of the dust takes place in disks but that no systematic evolution is detected in this work.
On the other hand, larger samples of sources that span a wider range in parameters could reveal relationships that are not found here. For instance, the dependence of disk dispersal timescale on stellar mass Lada et al. 2006; Carpenter et al. 2006; Kennedy & Kenyon 2009) is reflected in our data. It will be interesting in the future to have a similar analysis as presented here (for stellar and disk characteristics, plus dust mineralogy) probing a wider range in stellar mass and in time, reaching the debris disk population.
5. Conclusions
We have studied a flux-limited population of young stars still surrounded by disks in the Serpens Molecular Cloud. Aided by spectroscopic characterization of the central sources of star+disk systems combined with IR photometry, SEDs of the objects could be constructed.
The SEDs of Serpens show a considerable spread in IR excess. This implies the presence of disks with different geometries and in different stages of dissipation around stars that are nearly coeval, indicating that time is not the dominant parameter in the evolution of protoplanetary disks. The distribution of disk to star luminosity as a function of the stellar luminosity shows a trend in which lower mass stars have relatively brighter disks, consistent with other evidence in the literature that disks around lower mass stars have generally longer lifetimes or that disks around higher mass stars evolve faster.
Adopting the new distance of 415 pc for Serpens, higher stellar luminosities are found than previously inferred by Oliveira et al. (2009). The higher luminosities, in turn, combined with PMS evolutionary models, allude to a distribution of ages that is younger than that found by Oliveira et al. (2009). The great majority of young stars in Serpens are in the 1 – 3 Myr range, with a median age of 2.3 Myr. This result supports the observational evidence that Serpens joins the Taurus Molecular Cloud in probing the young bin of disk evolution, in spite of the different environment and star formation rates.
The distribution of fractional disk luminosity of the objects in Serpens also closely resembles that in Taurus, both of which are very different from those in the older regions Upper Scorpius and Chamaeleontis, where most disks have already dissipated. Furthermore, the majority of the Serpens population is consistent with passively reprocessing disks. When comparing the actively accreting and non-accreting stars of Serpens (based on H data), the main difference is seen at the bright tail of the fractional disk luminosity, dominated by strongly accreting stars.
The disks around T Tauri stars in Serpens are compared to those around Herbig Ae/Be stars (Meeus et al., 2001). Herbig Ae/Be stars show a clear separation in fractional disk luminosity for different disk geometries (flared versus flat) but this difference is not apparent for T Tauri stars. The disks around Herbig Ae/Be stars present a very narrow range of , concentrated around the border between self-luminous and passively irradiated disks, while the disks around T Tauri stars span a wider range of fractional disk luminosities. The absence of the tail distributions for Herbig Ae/Be could be due a faster evolution of these disks, or a bias effect due to the smaller number of disks observed around those higher mass stars.
The stellar and disk characteristics are combined with dust mineralogy results delivered for the same regions by Oliveira et al. (2011). By combining all these data, the effects of stellar and disk characteristics on the surface dust of disks are studied. No strong correlations are found, suggesting that the many processes taking place in disks somehow conspire in complicated ways that make it difficult to isolate the effect of each process/parameter individually. One possibility is that the processes that change the structure and size distribution of dust within disks are recurring and have short timescales, making it difficult to discern long timescale evolutionary effects.
References
- Ábrahám et al. (2009) Ábrahám, P., Juhász, A., Dullemond, C. P., et al. 2009, Nature, 459, 224
- Acke et al. (2004) Acke, B., van den Ancker, M. E., Dullemond, C. P., van Boekel, R., & Waters, L. B. F. M. 2004, A&A, 422, 621
- Alcalá et al. (2008) Alcalá, J. M., Spezzi, L., Chapman, N., et al. 2008, ApJ, 676, 427
- Alves & Bouy (2012) Alves, J., & Bouy, H. 2012, arXiv:1209.3787
- Andrews & Williams (2005) Andrews, S. M., & Williams, J. P. 2005, ApJ, 631, 1134
- Baraffe et al. (1998) Baraffe, I., Chabrier, G., Allard, F., & Hauschildt, P. H. 1998, A&A, 337, 403
- Blaauw (1978) Blaauw, A. 1978, Problems of Physics and Evolution of the Universe, 101
- Blum & Wurm (2008) Blum, J., & Wurm, G. 2008, ARA&A, 46, 21
- Bouvier et al. (2007) Bouvier, J., Alencar, S. H. P., Boutelier, T., et al. 2007, A&A, 463, 1017
- Bouwman et al. (2008) Bouwman, J., et al. 2008, ApJ, 683, 479
- Brown et al. (2007) Brown, J. M., et al. 2007, ApJ, 664, L107
- Carpenter et al. (2001) Carpenter, J. M., Hillenbrand, L. A., & Skrutskie, M. F. 2001, AJ, 121, 3160
- Carpenter et al. (2006) Carpenter, J. M., Mamajek, E. E., Hillenbrand, L. A., & Meyer, M. R. 2006, ApJ, 651, L49
- Chavarria (1981) Chavarria, C. 1981, A&A, 101, 105
- Chen et al. (2006) Chen, C. H., Sargent, B. A., Bohac, C., et al. 2006, ApJS, 166, 351
- Chiang & Goldreich (1997) Chiang, E. I., & Goldreich, P. 1997, ApJ, 490, 368
- Ciesla (2007) Ciesla, F. J. 2007, Science, 318, 613
- Cieza et al. (2007) Cieza, L., et al. 2007, ApJ, 667, 308
- Clarke et al. (2001) Clarke, C. J., Gendrin, A., & Sotomayor, M. 2001, MNRAS, 328, 485
- Comerón (2008) Comerón, F. 2008, Handbook of Star Forming Regions, Volume II, 295
- Currie & Kenyon (2009) Currie, T., & Kenyon, S. J. 2009, AJ, 138, 703
- Dahm & Carpenter (2009) Dahm, S. E., & Carpenter, J. M. 2009, AJ, 137, 4024
- de Zeeuw et al. (1999) de Zeeuw, P. T., Hoogerwerf, R., de Bruijne, J. H. J., Brown, A. G. A., & Blaauw, A. 1999, AJ, 117, 354
- Dominik & Tielens (1997) Dominik, C., & Tielens, A. G. G. M. 1997, ApJ, 480, 647
- Dullemond & Dominik (2004) Dullemond, C. P., & Dominik, C. 2004, A&A, 421, 1075
- Dzib et al. (2010) Dzib, S., Loinard, L., Mioduszewski, A. J., Boden, A. F., Rodríguez, L. F., & Torres, R. M. 2010, ApJ, 718, 610
- Eiroa et al. (2002) Eiroa, C., Oudmaijer, R. D., Davies, J. K., et al. 2002, A&A, 384, 103
- Eiroa et al. (2008) Eiroa, C., Djupvik, A. A., & Casali, M. M. 2008, Handbook of Star Forming Regions, Volume II, 693
- Ercolano et al. (2009) Ercolano, B., Clarke, C. J., & Drake, J. J. 2009, ApJ, 699, 1639
- Evans et al. (2003) Evans, N. J., II, et al. 2003, PASP, 115, 965
- Evans et al. (2009) Evans, N. J., II, Dunham, M. M., Jørgensen, J. K., et al. 2009, ApJS, 181, 321
- Furlan et al. (2006) Furlan, E., et al. 2006, ApJS, 165, 568
- Glauser et al. (2009) Glauser, A. M., Güdel, M., Watson, D. M., et al. 2009, A&A, 508, 247
- Gorti & Hollenbach (2009) Gorti, U., & Hollenbach, D. 2009, ApJ, 690, 1539
- Gorti et al. (2009) Gorti, U., Dullemond, C. P., & Hollenbach, D. 2009, ApJ, 705, 1237
- Güdel et al. (2007) Güdel, M., et al. 2007, A&A, 468, 353
- Gutermuth et al. (2008) Gutermuth, R. A., Myers, P. C., Megeath, S. T., et al. 2008, ApJ, 674, 336
- Greaves & Rice (2010) Greaves, J. S., & Rice, W. K. M. 2010, MNRAS, 407, 1981
- Haisch et al. (2001) Haisch, K. E., Jr., Lada, E. A., & Lada, C. J. 2001, ApJ, 553, L153
- Haisch et al. (2005) Haisch, K. E., Jr., Jayawardhana, R., & Alves, J. 2005, ApJ, 627, L57
- Hartmann et al. (2001) Hartmann, L., Ballesteros-Paredes, J., & Bergin, E. A. 2001, ApJ, 562, 852
- Harvey et al. (2006) Harvey, P. M., et al. 2006, ApJ, 644, 307
- Harvey et al. (2007a) Harvey, P. M., et al. 2007, ApJ, 663, 1139
- Harvey et al. (2007b) Harvey, P., Merín, B., Huard, T. L., Rebull, L. M., Chapman, N., Evans, N. J., II, & Myers, P. C. 2007, ApJ, 663, 1149
- Hauschildt et al. (1999) Hauschildt, P. H., Allard, F., Ferguson, J., Baron, E., & Alexander, D. R. 1999, ApJ, 525, 871
- Henning (2010) Henning, T. 2010, ARA&A, 48, 21
- Hernández et al. (2007) Hernández, J., Calvet, N., Briceño, C., et al. 2007, ApJ, 671, 1784
- Hernández et al. (2008) Hernández, J., Hartmann, L., Calvet, N., Jeffries, R. D., Gutermuth, R., Muzerolle, J., & Stauffer, J. 2008, ApJ, 686, 1195
- Juhász et al. (2012) Juhász, A., Dullemond, C. P., van Boekel, R., et al. 2012, ApJ, 744, 118
- Kennedy & Kenyon (2009) Kennedy, G. M., & Kenyon, S. J. 2009, ApJ, 695, 1210
- Kenyon & Hartmann (1987) Kenyon, S. J., & Hartmann, L. 1987, ApJ, 323, 714
- Kenyon & Hartmann (1995) Kenyon, S. J., & Hartmann, L. 1995, ApJS, 101, 117
- Kessler-Silacci et al. (2007) Kessler-Silacci, J. E., et al. 2007, ApJ, 659, 680
- Knude (2010) Knude, J. 2010, arXiv:1006.3676
- Lada et al. (2006) Lada, C. J., Muench, A. A., Luhman, K. L., et al. 2006, AJ, 131, 1574
- Lommen et al. (2010) Lommen, D. J. P., van Dishoeck, E. F., Wright, C. M., et al. 2010, A&A, 515, A77
- Luhman et al. (2003) Luhman, K. L., Stauffer, J. R., Muench, A. A., Rieke, G. H., Lada, E. A., Bouvier, J., & Lada, C. J. 2003, ApJ, 593, 1093
- Luhman (2004) Luhman, K. L. 2004, ApJ, 602, 816
- Luhman & Steeghs (2004) Luhman, K. L., & Steeghs, D. 2004, ApJ, 609, 917
- Luhman (2008) Luhman, K. L. 2008, Handbook of Star Forming Regions, Volume II, 169
- Luhman et al. (2010) Luhman, K. L., Allen, P. R., Espaillat, C., Hartmann, L., & Calvet, N. 2010, ApJS, 186, 111
- Mamajek et al. (2002) Mamajek, E. E., Meyer, M. R., & Liebert, J. 2002, AJ, 124, 1670
- Mamajek (2009) Mamajek, E. E. 2009, American Institute of Physics Conference Series, 1158, 3
- Meeus et al. (2001) Meeus, G., Waters, L. B. F. M., Bouwman, J., van den Ancker, M. E., Waelkens, C., & Malfait, K. 2001, A&A, 365, 476
- Megeath et al. (2005) Megeath, S. T., Hartmann, L., Luhman, K. L., & Fazio, G. G. 2005, ApJ, 634, L113
- Merín et al. (2010) Merín, B., et al. 2010, ApJ, 718, 1200
- Mortier et al. (2011) Mortier, A., Oliveira, I., & van Dishoeck, E. F. 2011, MNRAS, 418, 1194
- Muzerolle et al. (2009) Muzerolle, J., Flaherty, K., Balog, Z., et al. 2009, ApJ, 704, L15
- Muzerolle et al. (2010) Muzerolle, J., Allen, L. E., Megeath, S. T., Hernández, J., & Gutermuth, R. A. 2010, ApJ, 708, 1107
- Myers et al. (2000) Myers, P. C.; Evans, N. J., II; Ohashi, N. 2000, Protostars and Planets IV, 4
- Natta et al. (2004) Natta, A., Testi, L., Muzerolle, J., et al. 2004, A&A, 424, 603
- Oliveira et al. (2009) Oliveira, I., Merín, B., Pontoppidan, K. M., et al. 2009, ApJ, 691, 672
- Oliveira et al. (2010) Oliveira, I., Pontoppidan, K. M., Merín, B., et al. 2010, ApJ, 714, 778
- Oliveira et al. (2011) Oliveira, I., Olofsson, J., Pontoppidan, K. M., et al. 2011, ApJ, 734, 51
- Olofsson et al. (2010) Olofsson, J., Augereau, J.-C., van Dishoeck, E. F., Merín, B., Grosso, N., Ménard, F., Blake, G. A., & Monin, J.-L. 2010, A&A, 520, A39
- Padgett et al. (1999) Padgett, D. L., Brandner, W., Stapelfeldt, K. R., Strom, S. E., Terebey, S., & Koerner, D. 1999, AJ, 117, 1490
- Pecaut et al. (2012) Pecaut, M. J., Mamajek, E. E., & Bubar, E. J. 2012, ApJ, 746, 154
- Pontoppidan & Brearley (2010) Pontoppidan, K. M., & Brearley, A. J. 2010, Protoplanetary Dust: Astrophysical and Cosmochemical Perspectives, 191
- Preibisch et al. (2002) Preibisch, T., Brown, A. G. A., Bridges, T., Guenther, E., & Zinnecker, H. 2002, AJ, 124, 404
- Preibisch & Zinnecker (1999) Preibisch, T., & Zinnecker, H. 1999, AJ, 117, 2381
- Shu et al. (1993) Shu, F. H., Johnstone, D., & Hollenbach, D. 1993, Icarus, 106, 92
- Sicilia-Aguilar et al. (2006) Sicilia-Aguilar, A., Hartmann, L., Calvet, N., et al. 2006, ApJ, 638, 897
- Sicilia-Aguilar et al. (2007) Sicilia-Aguilar, A., Hartmann, L. W., Watson, D., et al. 2007, ApJ, 659, 1637
- Sicilia-Aguilar et al. (2009) Sicilia-Aguilar, A., et al. 2009, ApJ, 701, 1188
- Sicilia-Aguilar et al. (2011) Sicilia-Aguilar, A., Henning, T., Dullemond, C. P., et al. 2011, ApJ, 742, 39
- Siess et al. (2000) Siess, L., Dufour, E., & Forestini, M. 2000, A&A, 358, 593
- Spezzi et al. (2008) Spezzi, L., Alcalá, J. M., Covino, E., et al. 2008, ApJ, 680, 1295
- Spezzi et al. (2010) Spezzi, L., Merin, B., Oliveira, I., van Dishoeck, E. F., & Brown, J. M. 2010, A&A, 513, A38
- Straizys et al. (1996) Straizys, V., Cernis, K. & Bartasiute, S. 1996, Baltic Astron., 5, 125
- Strom et al. (1989) Strom, K. M., Strom, S. E., Edwards, S., Cabrit, S., & Skrutskie, M. F. 1989, AJ, 97, 1451
- Udry & Santos (2007) Udry, S., & Santos, N. C. 2007, ARA&A, 45, 397
- Visser & Dullemond (2010) Visser, R., & Dullemond, C. P. 2010, A&A, 519, A28
- Wahhaj et al. (2010) Wahhaj, Z., Cieza, L., Koerner, D. W., et al. 2010, ApJ, 724, 835
- Watson et al. (2009) Watson, D. M., Leisenring, J. M., Furlan, E., et al. 2009, ApJS, 180, 84
- Weidenschilling (1980) Weidenschilling, S. J. 1980, Icarus, 44, 172
- Weingartner & Draine (2001) Weingartner, J. C., & Draine, B. T. 2001, ApJ, 548, 296
- White & Basri (2003) White, R. J., & Basri, G. 2003, ApJ, 582, 1109
- Winston et al. (2010) Winston, E., Megeath, S. T., Wolk, S. J., et al. 2010, AJ, 140, 266
- Wooden et al. (2007) Wooden, D., Desch, S., Harker, D., Gail, H.-P., & Keller, L. 2007, Protostars and Planets V, 815
Appendix A The Remaining SEDs
Seventy-six SEDs are shown here in Figure 10.


| IDaaAs in Oliveira et al. (2010) | c2d ID (SSTc2dJ) | Spectral Type | Teff | Lstar | Ldisk | AV | Age (Myr) | Mass (M⊙) | Accreting? |
|---|---|---|---|---|---|---|---|---|---|
| 1 | 18275383-0002335 | K2 | 4900 | 1.07 | 0.13 | 2.6 | 10.86 | 1.27 | yes |
| 3 | 18280845-0001064 | M0 | 3850 | 1.77 | 0.53 | 3.0 | 0.50 | 1.04 | yes |
| 6 | 18281350-0002491 | K5 | 4350 | 3.30 | 0.27 | 3.0 | 2.37 | 1.48 | yes |
| 7 | 18281501-0002588 | M0 | 3850 | 0.51 | 1.56 | 6.0 | 4.36 | 0.88 | yes |
| 8b | 18281519-0001407 | M8 | 2640 | 0.11 | 0.13 | 2.0 | 0.78 | 0.12 | – |
| 9b | 18281525-0002434 | M0 | 3850 | 3.23 | 0.38 | 6.0 | 0.56 | 1.03 | – |
| 10b | 18281629-0003164 | M3 | 3470 | 1.82 | 0.18 | 6.0 | 0.44 | 0.68 | – |
| 13b | 18281981-0001475 | M7 | 2940 | 0.12 | 0.15 | 8.0 | 2.54 | 0.24 | – |
| 14 | 18282143+0010411 | M2 | 3580 | 0.49 | 0.00 | 3.0 | 2.27 | 0.63 | yes |
| 15b | 18282159+0000162 | M0 | 3850 | 1.32 | 0.49 | 4.0 | 1.01 | 0.98 | – |
| 20b | 18282849+0026500 | M0 | 3850 | 0.29 | 0.05 | 13.0 | 9.06 | 0.81 | – |
| 21b | 18282905+0027560 | M0 | 3850 | 0.66 | 0.15 | 12.0 | 2.89 | 0.91 | – |
| 24b | 18284025+0016173 | M7 | 2940 | 0.15 | 0.14 | 14.0 | 2.06 | 0.24 | – |
| 29 | 18284481+0048085 | M2 | 3580 | 0.18 | 0.20 | 4.0 | 8.13 | 0.56 | yes |
| 30 | 18284497+0045239 | M1 | 3720 | 1.00 | 0.10 | 2.0 | 1.18 | 0.83 | yes |
| 31b | 18284559-0007132 | M9 | 2510 | 94.77 | 0.20 | 15.0 | – | ||
| 32b | 18284614+0003016 | M6 | 3050 | 0.30 | 0.22 | 13.0 | 1.73 | 0.38 | – |
| 36 | 18285020+0009497 | K5 | 4350 | 2.88 | 0.50 | 10.0 | 1.20 | 1.21 | yes |
| 38b | 18285060+0007540 | K7 | 4060 | 0.18 | 0.02 | 3.0 | 21.77 | 0.72 | – |
| 40 | 18285249+0020260 | M7 | 2940 | 0.36 | 4.46 | 10.0 | 2.03 | 0.48 | no |
| 41 | 18285276+0028466 | K2 | 4900 | 0.11 | 0.28 | 15.0 | no | ||
| 43 | 18285395+0045530 | M0.5 | 3785 | 0.18 | 0.56 | 1.0 | 18.20 | 0.75 | no |
| 48 | 18285529+0020522 | M5.5 | 3145 | 0.34 | 1.32 | 10.0 | 1.58 | 0.33 | yes |
| 52 | 18285808+0017244 | G3 | 5830 | 8.14 | 0.05 | 4.0 | 6.93 | 1.82 | no |
| 53 | 18285860+0048594 | M2.5 | 3525 | 0.35 | 0.06 | 6.0 | 2.34 | 0.50 | yes |
| 54b | 18285946+0030029 | M0 | 3850 | 0.58 | 1.61 | 12.0 | 3.44 | 0.90 | – |
| 55 | 18290025+0016580 | K2 | 4900 | 2.44 | 0.04 | 7.0 | 4.02 | 1.68 | yes |
| 56b | 18290057+0045079 | M8 | 2640 | 0.09 | 1.73 | 3.0 | 1.27 | 0.12 | – |
| 57b | 18290082+0027467 | M8 | 2640 | 0.04 | 2.54 | 4.0 | 2.94 | 0.11 | – |
| 58 | 18290088+0029315 | K7 | 4060 | 1.19 | 3.89 | 5.0 | 2.31 | 1.14 | yes |
| 59b | 18290107+0031451 | M0 | 3850 | 0.51 | 2.94 | 14.0 | 4.42 | 0.87 | – |
| 60 | 18290122+0029330 | M0.5 | 3785 | 0.83 | 1.17 | 6.0 | 2.20 | 0.93 | yes |
| 61 | 18290175+0029465 | M0 | 3850 | 3.65 | 0.24 | 5.0 | 0.40 | 1.05 | yes |
| 62 | 18290184+0029546 | K0 | 5250 | 18.94 | 0.33 | 8.0 | no | ||
| 64b | 18290215+0029400 | M5 | 3240 | 0.13 | 0.58 | 5.0 | 2.05 | 0.21 | – |
| 65b | 18290286+0030089 | M6 | 3050 | 0.20 | 2.46 | 10.0 | 1.48 | 0.23 | – |
| 66 | 18290393+0020217 | K5 | 4350 | 5.11 | 0.39 | 7.0 | 1.64 | 1.56 | yes |
| 69b | 18290518+0038438 | M5 | 3240 | 0.23 | 0.00 | 11.0 | 0.77 | 0.21 | – |
| 70 | 18290575+0022325 | A3 | 8720 | 20.64 | 0.01 | 3.0 | 8.18 | 2.10 | no |
| 71 | 18290615+0019444 | M3 | 3470 | 0.33 | 0.03 | 4.0 | 2.48 | 0.49 | yes |
| 74b | 18290699+0038377 | M7 | 2940 | 0.12 | 2.62 | 7.0 | 2.66 | 0.24 | – |
| 75b | 18290765+0052223 | M5 | 3240 | 0.11 | 0.23 | 4.0 | 2.33 | 0.21 | – |
| 76 | 18290775+0054037 | M1 | 3720 | 0.33 | 0.11 | 4.0 | 5.66 | 0.71 | no |
| 80b | 18290956+0037016 | F0 | 7200 | 370.99 | 0.17 | 24.0 | – | ||
| 81 | 18290980+0034459 | M5 | 3240 | 60.77 | 0.12 | 15.0 | – | ||
| 82 | 18291148+0020387 | M0 | 3850 | 0.20 | 0.03 | 4.0 | 15.80 | 0.76 | yes |
| 83b | 18291249+0018152 | M6 | 3050 | 0.31 | 0.04 | 14.0 | 1.64 | 0.38 | – |
| 86 | 18291508+0052124 | M5.5 | 3145 | 35.78 | 0.15 | 6.0 | – | ||
| 87 | 18291513+0039378 | M4 | 3370 | 0.82 | 0.34 | 8.0 | 1.43 | 0.64 | no |
| 88 | 18291539-0012519 | M0.5 | 3785 | 0.64 | 1.04 | 0.0 | 2.98 | 0.91 | no |
| 89 | 18291557+0039119 | K5 | 4350 | 0.95 | 0.21 | 11.0 | 5.11 | 1.18 | yes |
| 90b | 18291563+0039228 | M7 | 2940 | 0.19 | 0.40 | 5.0 | 7.34 | 0.54 | – |
| 92 | 18291969+0018031 | M0 | 3850 | 0.58 | 0.39 | 6.0 | 3.40 | 0.90 | yes |
| 96 | 18292184+0019386 | M1 | 3720 | 0.34 | 0.16 | 5.0 | 5.51 | 0.72 | yes |
| 97 | 18292250+0034118 | M2 | 3580 | 0.14 | 0.14 | 5.0 | 10.11 | 0.55 | no |
| 98 | 18292253+0034176 | A3 | 8720 | 32.48 | 0.00 | 8.0 | 4.99 | 2.42 | no |
| 100b | 18292640+0030042 | M6 | 3050 | 0.18 | 0.24 | 12.0 | 1.61 | 0.22 | – |
| IDaaAs in Oliveira et al. (2010) | c2d ID (SSTc2dJ) | Spectral Type | Teff | Lstar | Ldisk | AV | Age (Myr) | Mass (M⊙) | Accreting? |
|---|---|---|---|---|---|---|---|---|---|
| 101b | 18292679+0039497 | M8 | 2640 | 0.06 | 3.86 | 10.0 | 2.02 | 0.12 | – |
| 103b | 18292824-0022574 | M6 | 3050 | 166.68 | 0.06 | 25.0 | – | ||
| 104b | 18292833+0049569 | M5 | 3240 | 0.12 | 0.10 | 6.0 | 2.16 | 0.21 | – |
| 105b | 18292864+0042369 | M5 | 3240 | 0.09 | 0.00 | 5.0 | 2.91 | 0.21 | – |
| 106 | 18292927+0018000 | M3 | 3470 | 0.25 | 0.02 | 5.0 | 3.10 | 0.47 | no |
| 107b | 18293056+0033377 | M8 | 2640 | 0.12 | 0.04 | 13.0 | 0.63 | 0.12 | – |
| 109b | 18293300+0040087 | M7 | 2940 | 0.22 | 0.19 | 7.0 | 1.16 | 0.25 | – |
| 111b | 18293337+0050136 | M5 | 3240 | 0.07 | 0.11 | 7.0 | 4.26 | 0.20 | – |
| 113 | 18293561+0035038 | K7 | 4060 | 2.32 | 0.03 | 6.0 | 0.68 | 0.13 | yes |
| 114 | 18293619+0042167 | F9 | 6115 | 3.68 | 0.07 | 9.5 | 14.29 | 116.38 | no |
| 115 | 18293672+0047579 | M0.5 | 3785 | 0.50 | 0.17 | 7.0 | 4.58 | 0.87 | no |
| 116b | 18293882+0044380 | M5 | 3240 | 0.21 | 0.05 | 9.0 | 0.93 | 0.21 | – |
| 117b | 18294020+0015131 | M7 | 2940 | 0.02 | 9.47 | 1.0 | 3.14 | 0.06 | yes |
| 119 | 18294121+0049020 | K7 | 4060 | 0.46 | 0.02 | 6.0 | 4.86 | 0.73 | yes |
| 120 | 18294168+0044270 | A2 | 8970 | 25.13 | 0.00 | 8.0 | 6.69 | 2.24 | no |
| 122 | 18294410+0033561 | M0 | 3850 | 1.10 | 0.03 | 4.0 | 1.43 | 0.96 | yes |
| 123 | 18294503+0035266 | M0 | 3850 | 0.72 | 0.12 | 9.0 | 2.63 | 0.92 | no |
| 124 | 18294725+0039556 | M0 | 3850 | 0.27 | 0.08 | 4.0 | 9.68 | 0.81 | no |
| 125 | 18294726+0032230 | M0 | 3850 | 0.58 | 0.07 | 6.0 | 3.45 | 0.90 | yes |
| 127 | 18295001+0051015 | M2 | 3580 | 0.48 | 0.03 | 4.0 | 2.35 | 0.63 | yes |
| 129b | 18295016+0056081 | M7 | 2940 | 0.22 | 1.32 | 4.0 | 1.23 | 0.25 | – |
| 130 | 18295041+0043437 | K6 | 4205 | 1.33 | 0.22 | 7.0 | 2.16 | 0.91 | yes |
| 131 | 18295130+0027479 | A3 | 8720 | 25.57 | 0.00 | 4.0 | 6.49 | 2.23 | no |
| 134b | 18295244+0031496 | M8 | 2640 | 0.08 | 0.74 | 17.0 | 1.30 | 0.12 | – |
| 136b | 18295304+0040105 | M5 | 3240 | 0.17 | 0.04 | 5.0 | 1.44 | 0.21 | – |
| 137b | 18295305+0036065 | M2 | 3580 | 1.56 | 0.31 | 20.0 | 1.01 | 0.89 | – |
| 139 | 18295422+0045076 | A4 | 8460 | 33.71 | 0.00 | 5.0 | 4.77 | 2.43 | no |
| 142 | 18295592+0040150 | M4 | 3370 | 0.17 | 0.26 | 3.0 | 3.05 | 0.36 | yes |
| 143b | 18295620+0033391 | M8 | 2640 | 0.07 | 2.02 | 10.0 | 1.76 | 0.12 | – |
| 144b | 18295701+0033001 | M8 | 2640 | 1.43 | 1.90 | 0.0 | – | ||
| 145 | 18295714+0033185 | G2.5 | 5845 | 19.73 | 0.05 | 13.0 | 3.19 | 2.47 | no |
| 146 | 18295772+0114057 | M4 | 3370 | 0.34 | 89.13 | 0.0 | 1.65 | 0.42 | yes |
| 147b | 18295872+0036205 | M5 | 3240 | 0.31 | 0.10 | 5.0 | 0.37 | 0.20 | – |
| 148 | 18300178+0032162 | K7 | 4060 | 0.83 | 0.04 | 5.0 | 2.58 | 0.70 | yes |
| 149 | 18300350+0023450 | M0 | 3850 | 0.42 | 0.04 | 4.0 | 5.82 | 0.85 | yes |