New Belle results on mixing
Marko Starič111on behalf of the Belle collaboration.
J. Stefan Institute, Jamova 39, 1000 Ljubljana, Slovenia
We report the new measurement of mixing in decays to and final states that is based on the total Belle data sample of 976 fb-1. The preliminary results are and .
PRESENTED AT
The 5th International Workshop on Charm Physics (Charm 2012)
14-17 May 2012, Honolulu, Hawaii 96822.
1 Introduction
Mixing of neutral mesons occurs when the flavor eigenstates differ from the physical mass eigenstates of the meson-antimeson system. In case of mesons mass eigenstates are expressed as , with . If the two mass eigenstates are CP-even and CP-odd; otherwise is violated. Charm mixing is characterized by two parameters: and , where and are the mass and decay width differences of mass eigenstates, respectively, and is the average decay width.
Mixing in decays to eigenstates, such as , manifests in a lifetime that differs from the lifetime of decays to flavor eigenstates, such as . The quantity
| (1) |
is equal to the mixing parameter if is conserved. If is violated the lifetimes of and decaying to the same eigenstate also differ and the lifetime asymmetry, defined as
| (2) |
becomes non-zero. The quantities and are connected to the mixing parameters and by [1] and , where and .
2 Event selection
The decays and are reconstructed in the decay chain in order to suppress background and to tag the flavor at production. To reject candidates coming from decays, we require that the momentum measured in the center-of-mass system (CMS) of the collisions be greater that 2.5 GeV/c; for a fraction of data taken at we increase this threshold to 3.1 GeV/c.
Besides using our standard kaon and pion selection criteria, based on , threshold aerogel Cherenkov counters and time-of-flight, and vertex fits, we select candidates using two kinematic variables: the invariant mass of the decay products and the energy released in the decay . The proper decay time of the candidate is calculated from the projection of the vector joining the two vertices, , onto the momentum vector: , where is the nominal mass [4]. The decay time uncertainty is evaluated event-by-event from the error matrices of the production and decay vertices.
The sample of events for the lifetime measurements is selected using , and . These selection criteria are optimized on Monte Carlo (MC) simulation by minimizing the statistical error on . Background is estimated from sidebands in ; the sideband position has also been optimized in order to minimize the systematic uncertainty. The yields of selected events are (), () and (), with signal purities of 98.0%, 92.9% and 99.7%, respectively.
3 Lifetime fit
By studying the proper decay time distribution of decays we observe a significant dependence of its mean value on , where is the CMS polar angle. Using MC simulation we find that the generated proper decay time distribution of selected events agrees well in each bin with an exponential distribution and that the lifetime is consistent with the generated value. The observed dependence is thus due to the resolution function offset that depends on . Therefore, to reduce systematic uncertainties arising from the resolution function parameterization the measurement is performed in bins of ; an additional requirement is imposed to suppress the events with the largest offsets (about 1% of events).
The fitting procedure in each bin is similar to the one used in our previous measurement [2], where we performed a binned simultaneous fit to , and samples. The resolution function is constructed similarly, from normalized distribution of using a double or triple Gaussian PDF for each bin. The widths and fractions of these Gaussian distributions are obtained from fits to the MC distribution of pulls . The procedure is repeated for each bin. The parameterization reads:
| (3) |
where represents a Gaussian distribution of mean and width , and is the fraction of events in the -th bin of the distribution. The mean and width are parameterized as:
| (4) |
where are the width scaling factors for each of the Gaussian’s, is the resolution function offset, and is a parameter to model a possible asymmetry of the resolution function. The parameters , and are free parameters in the fit.
The proper decay time distribution is parameterized with
| (5) |
with the following free parameters: , , , and . A sideband subtracted distribution is used to construct . The term describes background and is fixed with a fit to the sideband distribution.
Background is parameterized as a sum of two lifetime components, a component with zero lifetime and a component with an effective lifetime :
| (6) |
The background resolution function is assumed to be symmetric () and is composed of three Gaussian’s with . The fraction of zero-lifetime component is found to be dependent; its value is fixed in each bin using MC simulation. The parameters , , and are determined from a fit to sideband distribution summed over bins. However, the shape in individual bins remains bin-dependent since distribution, and depend on .
To extract and the decay modes are fitted simultaneously in each bin using a binned maximum likelihood fit. The parameters shared between decay modes are and ( and ), and (all decay modes) and parameters , and up to an overall scaling factor. The fit has been tested with the generic MC simulation equivalent to six times the data statistics. The fitted and are found to be consistent with the input zero value and the fitted lifetime is found to be consistent with the generated value. A linearity test performed with MC simulated events re-weighted to reflect different shows no bias.
4 Results
The experimental data were taken with two different silicon vertex detector (SVD) configurations: for the first 153 fb-1 a 3-layer SVD was used, while for the rest of the data a 4-layer SVD was used. We treat both running periods separately, since the resolution function differs.
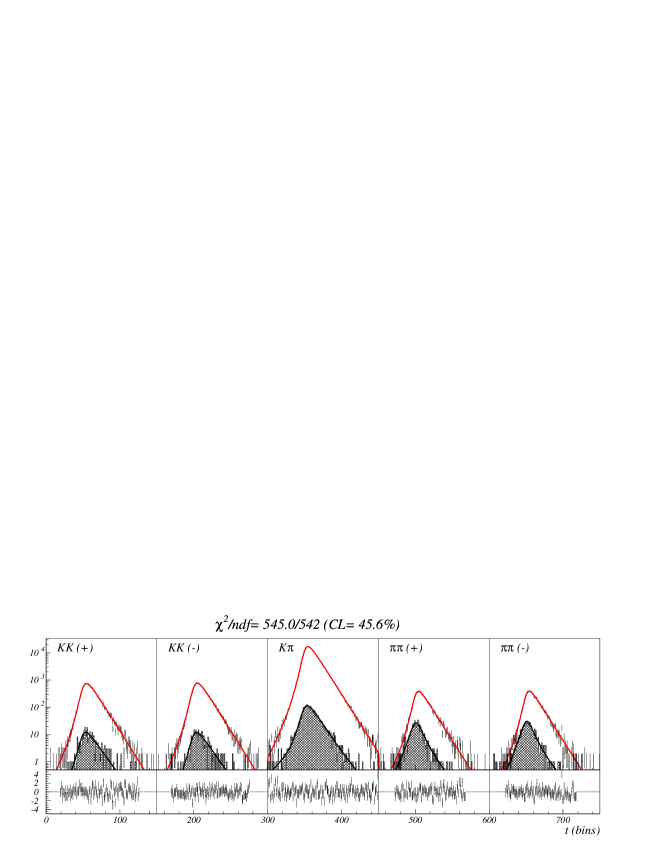
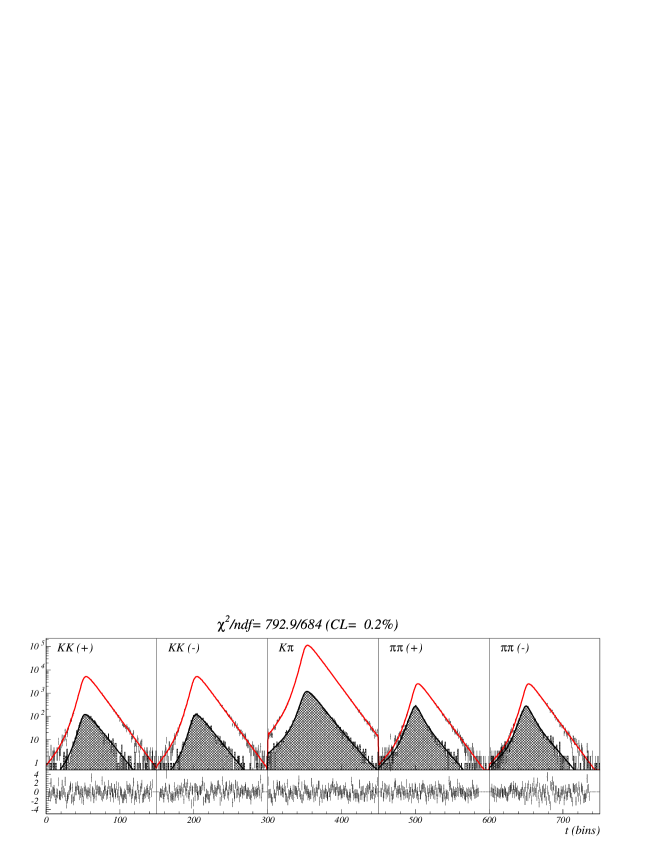
The proper decay time distributions are fitted simultaneously as discussed in the previous section. The results of the fits are shown in Fig. 1. Fit confidence levels (CL) are above 5% (except one with CL=3.3%) and are distributed uniformly ***We use Pearson’s definition of and take only the bins with the fitted function greater than one.. The plots in Fig. 1 are obtained by summing the histograms and functions in all fitted bins. The residuals show no significant structure. The normalized Pearson’s are 1.01 (SVD1) and 1.16 (SVD2).
Fig. 2 shows the results of the fits in bins of for , and the lifetime . The average is obtained by a least square fit to a constant. We find , and , where the errors are statistical only. The results for individual running periods are consistent with each other. The measured lifetime is also consistent with the current world average [4].


5 Systematics
The systematic uncertainties are summarized in Table 1. The largest contribution is found to arise from possible SVD misalignments. The impact of misalignments has been extensively studied using a special signal MC simulation with different local and global SVD misalignments. We find that the SVD misalignment affects the resolution function considerably, especially its offset , and it can explain the differences seen between MC and data. However, the effect on the resolution function is very similar for , and decay modes, and thus mainly cancels when relative lifetime measurements such as and are performed.
Other sources of systematics arise from possible impact of selection criteria to the acceptance, from the position of mass window , from background parameterization and from background statistical fluctuations, from resolution function parameterization and from binning in and . The total systematic uncertainties are estimated to 0.11% for and 0.08% for .
| source | (%) | (%) |
|---|---|---|
| acceptance | 0.050 | 0.044 |
| SVD misalignments | 0.060 | 0.041 |
| mass window position | 0.007 | 0.009 |
| background | 0.059 | 0.050 |
| resolution function | 0.030 | 0.002 |
| binning | 0.021 | 0.010 |
| sum in quadrature | 0.11 | 0.08 |
6 Summary
With the full Belle data set of 976 fb-1, we obtain the preliminary results
| (7) | |||||
| (8) |
where the first error is statistical and the second is systematical. The significance of is 4.5 when both errors are combined in quadrature, and 5.1 if only the statistical error is considered. The result for is consistent with no indirect violation. Both results are in good agreement with our previous measurement [2] as well as with the BaBar measurements in the same decay modes [5, 6].
ACKNOWLEDGEMENTS
We thank the KEKB group for the excellent operation of the accelerator; the KEK cryogenics group for the efficient operation of the solenoid; and the KEK computer group, the National Institute of Informatics, and the PNNL/EMSL computing group for valuable computing and SINET4 network support. We acknowledge support from the Ministry of Education, Culture, Sports, Science, and Technology (MEXT) of Japan, the Japan Society for the Promotion of Science (JSPS), and the Tau-Lepton Physics Research Center of Nagoya University; the Australian Research Council and the Australian Department of Industry, Innovation, Science and Research; the National Natural Science Foundation of China under contract No. 10575109, 10775142, 10875115 and 10825524; the Ministry of Education, Youth and Sports of the Czech Republic under contract No. LA10033 and MSM0021620859; the Department of Science and Technology of India; the Istituto Nazionale di Fisica Nucleare of Italy; he BK21 and WCU program of the Ministry Education Science and Technology, National Research Foundation of Korea Grant No. 2010-0021174, 2011-0029457, 2012-0008143, 2012R1A1A2008330, BRL program under NRF Grant No. KRF-2011-0020333, and GSDC of the Korea Institute of Science and Technology Information; the Polish Ministry of Science and Higher Education and the National Science Center; the Ministry of Education and Science of the Russian Federation and the Russian Federal Agency for Atomic Energy; the Slovenian Research Agency; the Basque Foundation for Science (IKERBASQUE) and the UPV/EHU under program UFI 11/55; the Swiss National Science Foundation; the National Science Council and the Ministry of Education of Taiwan; and the U.S. Department of Energy and the National Science Foundation. This work is supported by a Grant-in-Aid from MEXT for Science Research in a Priority Area (“New Development of Flavor Physics”), and from JSPS for Creative Scientific Research (“Evolution of Tau-lepton Physics”).
References
- [1] S. Bergmann et al., Phys. Lett. B 486, 418 (2000)
- [2] M. Starič et al.(Belle Collaboration), Phys. Rev. Lett. 98, 211803 (2007)
- [3] B. Aubert et al.(BaBar Collaboration), Phys. Rev. Lett. 98, 211802 (2007)
- [4] K. Nakamura et al.(Particle Data Group), J. Phys. G: Nucl. Part. Phys. 37 (2010) 075021
- [5] B. Aubert et al.(BaBar Collaboration), Phys. Rev. D78 (2008) 011105
- [6] B. Aubert et al.(BaBar Collaboration), Phys. Rev. D80 (2009) 071103