Soft Mode in cubic PbTiO3 by Hyper-Raman Scattering
Abstract
Hyper-Raman scattering experiments allowed collecting the spectra of the lowest -symmetry mode of PbTiO3 crystal in the paraelectric phase up to K as well as down to about 1 K above the phase transition. It is realized that this mode is fully responsible for the Curie-Weiss behavior of its dielectric permittivity above . Near the phase transition, this phonon frequency softens down to 17 cm-1 and its spectrum can be well modeled as a response of a single damped harmonic oscillator. It is concluded that PbTiO3 constitutes a clean example of a soft mode-driven ferroelectric system.
pacs:
77.80.-e, 78.30.-j, 63.20.-e, 77.80.B-Since the seminal works of Frohlich, Ginzburg, Cochran and Landauer,Froh49 ; Ginz49a ; Ginz49b ; Coch59 ; Land87 it is well understood that high dielectric constant of many practically exploited polar materials is directly related to the presence of a low frequency polar excitation – through the Lyddane-Sachs-Teller relationship. In displacive-type ferroelectrics, this excitation has a character of a vibrational lattice mode, so-called soft mode. Soft mode frequencies are typically found in 0.1-1 THz frequency range, so that the high permittivity persists throughout the whole MHz-GHz range and it is usually quite a robust intrinsic property. Other materials may reveal high static permittivities also for other reasons, for example due to mobile ferroelectric domain walls, space-limited conductivity at various structural inhomogeneities etc.Lunk02 ; LiuJ04 ; LiMi09 As a rule, such mechanisms usually lead to high permittivities only at very low frequencies and the dielectric properties of these materials are also much more susceptible to various fatigue phenomena. Therefore, the THz-range frequency dispersion of the dielectric permittivity provides the key information needed to understand the potential of practical use of the high permittivity materials.
A nice example of a material owing its high permittivity to a well-defined THz-range frequency polar vibration is the quantum paralectric SrTiO3.Bark62 ; Rupp62 In most of its ferroelectric counterparts, however, soft polar fluctuations cannot not be described by a single DHO oscillator.Petz87 In fact, it is tempting to conclude that there is some kind of additional central mode in the vicinity of the all ferroelectric phase transitions. At least, additional THz range excitations related to the soft phonon degree of freedom have been quite neatly experimentally identified in rather different perovskite polar materials, such as tetragonal ferroelecric BaTiO3Hlin08 on one hand and in a pseudocubic relaxor ferroelectric PbMg1/3Nb2/3O3ZeinSM on the other hand. Seemingly similar phenomena may probably be of a rather different nature, but in both cases the presence of the additional excitation in the dielectric spectrum is crucial for explaining the magnitudes of the measured static permittivity.
Therefore, it seems also important to provide clean examples of ferroelectric materials where the THz range permittivity is actually well described by a single polar soft mode excitation. Originally, the paraelectric PbTiO3 has been considered as the example of such a simple soft mode system.Shir70 The presence of central peak was later proposed to exist there as well, but only in a GHz frequency range.Font90 ; Font91 ; Girs97 In reality, the measurements of the soft mode spectra above the fairly high ferroelectric phase transition temperature (TC=760 K) of PbTiO3 turned out to be technically quite challenging. Already the pioneering inelastic neutron scattering (INS) study of Shirane et al.Shir70 reported that accurate measurements in the vicinity of the Brillouin zone center are difficult and the data reported there are in fact extrapolated from phonon dispersion relations. Similar difficulties have been encountered in subsequent INS experiments,Kemp06 ; Tome12 and even less straightforward is the analysis of the confocal Raman light scattering spectra reported in Ref. Soon08, .
In fact, there are quite sizable disagreements among the published estimates for soft mode frequency and its temperature dependence in the paraelectric phase. For example, the extrapolation of the soft mode frequency to the phase transition temperature gives about 11 cm-1 according to Ref. Tome12, , 20 cm-1 according to Ref. Shir70, , and more than 60 cm-1 according to Ref. Soon08, .
The aim of this paper is to report new set of reference spectral data in the vicinity of a ferroelectric phase transition, demonstrating that the paraelectric PbTiO3 can be indeed considered as such a clean case where the THz response can be well modeled by a single DHO.
A clear-cut answer to these issues was obtained here by means of Hyper-Raman scattering (HRS). Previously, soft modes has been studied by this technique in a range of polar perovskite materials. Pre83 ; Heh07 ; Ali08 In principle, state-of-art instrumental resolution allows measurements of polar modes in the paraelectric phase by HRS down to a few cm-1. Present HRS experiments have been performed using the setup described in Ref. Ali08, , only upgraded with an optical microscope.
The sample was a 1 mm thick platelet of a PbTiO3 single crystal grown at University of Silesia,Kani06 with a natural surface normal to the [001] (-axis). It was mounted in a hot stage with the [100] () and [010] () crystallographic axes parallel to the horizontal (H) and vertical (V) direction, respectively. The data were collected in the backscattering geometry with [001]. A broadband half-wave plate followed by a Glan-Thomson polarizer allowed for analysis of the scattered light polarized along V or H. A 1800 grooves/mm grating and a 150 m entrance slit give rise to a spectral resolution of 3 cm-1. Cooling and heating rates did not exceed 10 K/min with a temperature stabilized within 1 K. Since the strong SHG signal in the ferroelectric phase persists up to the phase transition the soft mode spectra could be measured only in the paraelectric phase. On the other hand, the onset of SHG and Raman scattering at allowed us to determine quite precisely the measured temperatures with respect to .
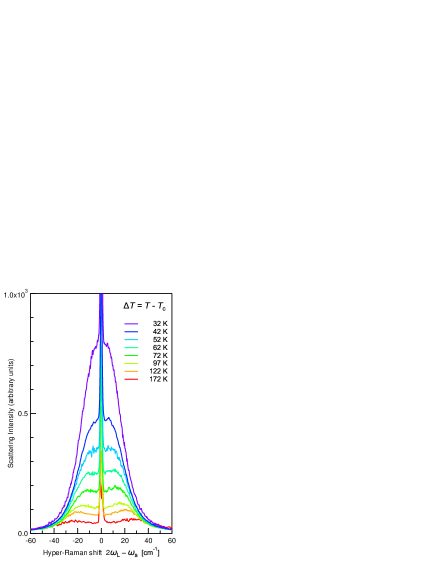
The simple (Z=1) perovskite structure of paraelectric PbTiO3 has four zone center optic modes, three polar modes and one non-polar vibration, all being triply degenerate and active in HRS. The lowest frequency is known to play the role of the soft mode. A representative set of resulting HRS spectra revealing this mode is shown in Fig. 1. All these spectra show a broad soft mode response and a resolution-limited central line. Up to about 50 K above , the broad soft mode gives a bell-like response centered at zero energy. Above this temperature the response function clearly shows two broad maxima, corresponding to the Stokes and anti-Stokes spectral bands.
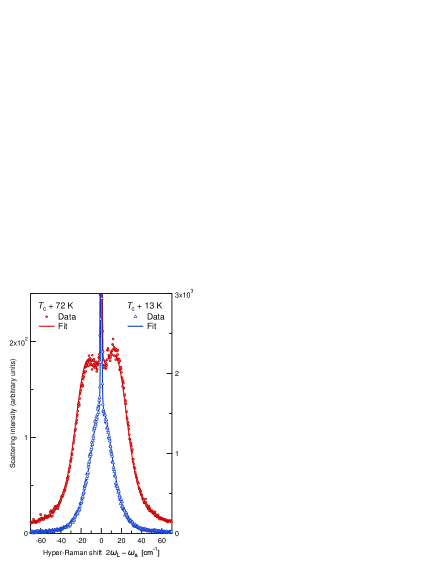
The narrow central line probably contains both surface sensitive elastic and resolution-limited quasielastic scattering, so that we focused here on the analysis of the broad, phonon part of the spectrum. In fact, at all temperatures, this part of the spectrum could be nicely adjusted to the model of a single DHO, see Fig. 2. Strictly speaking, the measured intensity was adjusted to the sum of a flat background, a narrow Gaussian peak standing for the resolution limited central line and the standard one-phonon scattering lineshape modelVog88
| (1) |
where is the frequency of the scattered field, is the Bose-Einstein population factor, and are the polarization vectors of the incident (L) and detected (S) photons, the index distinguishes different HRS tensors of a degenerate mode, and is the normalized response function of the mode described by
| (2) |
where and are DHO frequency and damping, respectively.
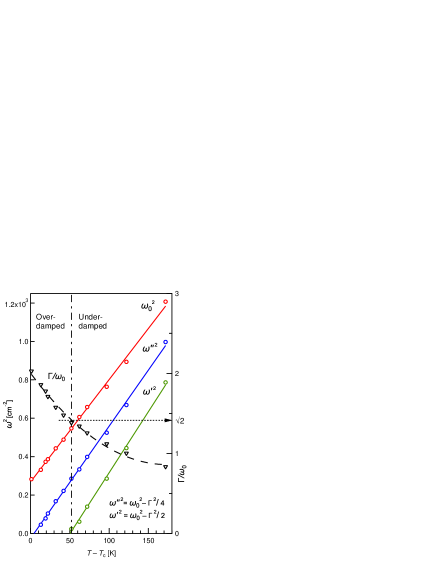
The resulting least-squared fit values of as a function of temperature are displayed in Fig. 3. This temperature dependence is visibly fairly linear, and its adjustment to Cochran law provides cm-2K-1 and K. The value of parameter has shown only a very small variation (from about 35 cm-1 at K to about 30 cm-1 at K). Nevertheless, the value of is comparable with the soft mode frequency itself ( determined from the present experiments extrapolates to 17 cm-1 at ). Therefore, we have also shown in Fig. 3 the two auxiliary frequency parameters and . The former quantity gives the position of the maximum of the one-phonon DHO scattering spectral function of eq.(2) in the high temperature limit () as long as the DHO is underdamped (). It is clear from Fig. 3 that the overdamped/underdamped crossover temperature at which approaches zero is at about 50 K above .
The latter quantity, preferred over by some authors,Soon08 defines the periodic factor in the temporal response of the oscillator coordinate in the absence of driving forces for (). Accidentally, happens to extrapolate to zero quite close to (see Fig. 3).
We have noted that the present values of reported in Fig. 3 fall within the error bars of the corresponding values measured by INS in a recent paper by Tomeno et al.Tome12 The frequencies deduced from the original work of Shirane et alShir70 are a bit higher but still in a reasonable agreement with the present experiment. Independent attempt to determine paraelectric soft mode frequency with INS technique was reported by Kempa et al.Kemp06 Values estimated there implied even higher soft mode frequencies. We now believe that the main source of differences among these INS data is the effect of momentum resolution, which was somewhat coarser in the experiment of Ref. Kemp06, . The soft mode dispersion of PbTiO3 is indeed very steep,Tome12 so that the admixture of the response of the modes with the phonon wave vectors away from the Brillouin zone center could considerably upshift the apparent zone center frequency. Another possibility could be oxygen or lead vacancies in the sample (as mentioned in Ref. Tome12, ) but since the sample used in the present HRS measurements was prepared under similar conditions as that of the Ref. Kemp06, , it seems less likely.
The paraelectric soft mode frequency of PTO was also recently deduced from confocal Raman scattering spectra in Ref. Soon08, . However, the paraelectric soft mode is not active in Raman scattering, so that the measured spectral data did not originate from a standard first-order scattering. The theoretical analysis of Ref. Soon08, , inspired by idea of defect-induced Raman scattering is most likely not appropriate for qualitative determination of the soft mode parameters at all, as the data obtained there are in a very strong disagreement with the present measurement - the soft mode frequencies obtained in Ref. Soon08, are even higher than that of the INS estimates of Ref. Kemp06, .
The Cochran constant from the present experiments (5 cm-2K-1) has the lowest value among the reported ones (about 8.4 cm-2K-1 is obtained in Refs. Shir70, ; Tome12, , and about 35 cm-2K-1 is provided in Ref. Soon08, . The latter estimate is probably biased by the very indirect analysis of the cubic phase Raman spectra, while the somewhat higher values reported in Refs. Shir70, ; Tome12, could be perhaps related to a broader temperature interval in which the soft mode was followed (INS data extended up to 1175 K in Ref. Tome12, ). Such a systematic dependence of the Cochran constant on the fitting temperature range could indicate a coupling of the soft mode to a central mode. On the other hand, the HRS and INS measurements both agree that the Cochran-law temperature is about 50 K below the phase transition . Present HRS data, taken in the same temperature region as the dielectric measurements, shows that is close to 55 K, and so within the experimental uncertainty, the present Cochran-law temperature coincides with the temperature at which the inverse static susceptibility extrapolates to zero (the Curie-Weiss law extrapolating temperature of Ref. Reme70, is 43 K below ). Thus, although the present experiment could not directly probe the GHz range central peak in paraelectric phase of PTO, we can conclude that if it exists, it has only a very small contribution to the static permittivity and also the shift of the phase transition is much less than it was sometimes assumed.Girs97 ; Kemp06
In fact, this simple soft mode picture is also consistent with the observed relative change of the permittivity at the phase transition. Probably the most reliable MHz-range dielectric data of Ref. Li96, suggest that at the phase transition, the paraelectric permittivity is about 10 times larger than the axial ferroelectric permittivity (). From the LST relation, assuming that only the soft mode frequency has changed at the transition, the same ratio could be expressed as , where is the frequency of the soft mode in the ferroelectric phase. Indeed, the present HRS value of cm-1 together with the earlier measuredFont91 ; Jang09 values of cm-1 leads us also to the ratio of . In summary, we can conclude that the PbTiO3 can be considered as a model soft-mode driven ferroelectric system.
Acknowledgements.
This work has been supported by the Czech Ministry of Education (Project MSMT ME08109).References
- [1] H. Fröhlich, Theory of Dielectrics, Clarendon Press, Oxford (1949).
- [2] V. L. Ginzburg, Usp. Fiz. Nauk 38, 490 (1949).
- [3] V. L. Ginzburg, Zh. Eksp. Teor. Fiz. 19, 36 (1949).
- [4] W. Cochran, Phys. Rev. Lett. 3, 412 (1959).
- [5] R. Landauer, Ferroelectrics 73, 27 (1987).
- [6] P. Lunkenheimer, V. Bobnar, A. V. Pronin, A. I. Ritus, A. A. Volkov, and A. Loidl, Phys. Rev. B 66, 052105 (2002).
- [7] J. Liu, C.-G. Duan, W.-G. Yin, W. N. Mei, R. W. Smith, and J. R. Hardy, Phys. Rev. B 70, 144106 (2004).
- [8] M. Li, Z. Shen, M. Nygren, A. Feteira, D. C. Sinclair, and A. R. West, J. Appl. Phys. 106, 104106 (2009).
- [9] A. S. Barker and M. Tinkham, Phys. Rev. 125, 1527 (1962).
- [10] G. Rupprecht and R. O. Bell, Phys. Rev. 125, 1915 (1962).
- [11] J. Petzelt, G. V. Kozlov, and A. A. Volkov, Ferroelectrics 73, 101 (1987).
- [12] J. Hlinka, T. Ostapchuk, D. Nuzhnyy, J. Petzelt, P. Kuzel, C. Kadlec, P. Vanek, I. Ponomareva, and L. Bellaiche, Phys. Rev. Lett. 101, 167402 (2008).
- [13] A. Al-Zein, J. Hlinka, J. Rouquette, and B. Hehlen, Phys. Rev. Lett. 105, 017601 (2010).
- [14] G. Shirane, J. D. Axe, J. Harada, and J. P. Remeika, Phys. Rev. B 2, 155 (1970).
- [15] M. D. Fontana, H. Idrissi, and K. Wojcik, Europhys. Lett. 11, 419 (1990).
- [16] M. D. Fontana, H. Idrissi, G. E. Kugel, and K. Wojcik, J. Phys.: Condens. Matter 3, 8695 (1991).
- [17] Y. Girshberg and Y. Yacoby, Solid State Commun. 103, 425 (1997).
- [18] M. Kempa, J. Hlinka, J. Kulda, P. Bourges, A. Kania, and J. Petzelt, Phase Transitions 79, 351 (2006).
- [19] I. Tomeno, J. A. Fernandez-Baca, K. J. Marty, K. Oka, and Y. Tsunoda, Phys. Rev. B 86, 134306 (2012).
- [20] H. P. Soon, H. Taniguchi, Y. Fujii, M. Itoh, and M. Tachibana , Phys. Rev. B 78, 172103 (2008).
- [21] H. Presting, J. A. Sanjurjo, and H. Vogt, Phys. Rev. B 28, 6097 (1983).
- [22] B. Hehlen, G. Simon, and J. Hlinka, Phys. Rev. B 75, 052104 (2007).
- [23] A. Al-Zein, B. Hehlen, J. Rouquette, and J. Hlinka, Phys. Rev. B 78, 134113 (2008).
- [24] A. Kania, A. Slodczyk and Z. Ujma, J. Cryst. Growth 289, 134 (2006).
- [25] H. Vogt, Phys. Rev. B 38, 5699 (1988).
- [26] J. P. Remeika and A. M. Glass, Mat. Res. Bull. 5, 37 (1970).
- [27] Z. Li, M. Grimsditch, C. M. Foster, and S.-K. Chan, J. Phys. Chem. Solids 57, 1433 (1996).
- [28] H. M. Jang, M.-A. Oak, J.-H. Lee, Y. K. Jeong, and J. F. Scott, Phys. Rev. B 80, 132105 (2009).
- [29] H. Fröhlich, Theory of Dielectrics, Clarendon Press, Oxford (1949).
- [30] V. L. Ginzburg, Usp. Fiz. Nauk 38, 490 (1949).
- [31] V. L. Ginzburg, Zh. Eksp. Teor. Fiz. 19, 36 (1949).
- [32] W. Cochran, Phys. Rev. Lett. 3, 412 (1959).
- [33] R. Landauer, Ferroelectrics 73, 27 (1987).
- [34] P. Lunkenheimer, V. Bobnar, A. V. Pronin, A. I. Ritus, A. A. Volkov, and A. Loidl, Phys. Rev. B 66, 052105 (2002).
- [35] J. Liu, C.-G. Duan, W.-G. Yin, W. N. Mei, R. W. Smith, and J. R. Hardy, Phys. Rev. B 70, 144106 (2004).
- [36] M. Li, Z. Shen, M. Nygren, A. Feteira, D. C. Sinclair, and A. R. West, J. Appl. Phys. 106, 104106 (2009).
- [37] A. S. Barker and M. Tinkham, Phys. Rev. 125, 1527 (1962).
- [38] G. Rupprecht and R. O. Bell, Phys. Rev. 125, 1915 (1962).
- [39] J. Petzelt, G. V. Kozlov, and A. A. Volkov, Ferroelectrics 73, 101 (1987).
- [40] J. Hlinka, T. Ostapchuk, D. Nuzhnyy, J. Petzelt, P. Kuzel, C. Kadlec, P. Vanek, I. Ponomareva, and L. Bellaiche, Phys. Rev. Lett. 101, 167402 (2008).
- [41] A. Al-Zein, J. Hlinka, J. Rouquette, and B. Hehlen, Phys. Rev. Lett. 105, 017601 (2010).
- [42] G. Shirane, J. D. Axe, J. Harada, and J. P. Remeika, Phys. Rev. B 2, 155 (1970).
- [43] M. D. Fontana, H. Idrissi, and K. Wojcik, Europhys. Lett. 11, 419 (1990).
- [44] M. D. Fontana, H. Idrissi, G. E. Kugel, and K. Wojcik, J. Phys.: Condens. Matter 3, 8695 (1991).
- [45] Y. Girshberg and Y. Yacoby, Solid State Commun. 103, 425 (1997).
- [46] M. Kempa, J. Hlinka, J. Kulda, P. Bourges, A. Kania, and J. Petzelt, Phase Transitions 79, 351 (2006).
- [47] I. Tomeno, J. A. Fernandez-Baca, K. J. Marty, K. Oka, and Y. Tsunoda, Phys. Rev. B 86, 134306 (2012).
- [48] H. P. Soon, H. Taniguchi, Y. Fujii, M. Itoh, and M. Tachibana , Phys. Rev. B 78, 172103 (2008).
- [49] H. Presting, J. A. Sanjurjo, and H. Vogt, Phys. Rev. B 28, 6097 (1983).
- [50] B. Hehlen, G. Simon, and J. Hlinka, Phys. Rev. B 75, 052104 (2007).
- [51] A. Al-Zein, B. Hehlen, J. Rouquette, and J. Hlinka, Phys. Rev. B 78, 134113 (2008).
- [52] A. Kania, A. Slodczyk and Z. Ujma, J. Cryst. Growth 289, 134 (2006).
- [53] H. Vogt, Phys. Rev. B 38, 5699 (1988).
- [54] J. P. Remeika and A. M. Glass, Mat. Res. Bull. 5, 37 (1970).
- [55] Z. Li, M. Grimsditch, C. M. Foster, and S.-K. Chan, J. Phys. Chem. Solids 57, 1433 (1996).
- [56] H. M. Jang, M.-A. Oak, J.-H. Lee, Y. K. Jeong, and J. F. Scott, Phys. Rev. B 80, 132105 (2009).