Measurement of Coherent Polarons in the Strongly Coupled Antiferromagnetically Ordered Iron-Chalcogenide Fe1.02Te using Angle-Resolved Photoemission Spectroscopy
Abstract
The nature of metallicity and the level of electronic correlations in the antiferromagnetically ordered parent compounds are two important open issues for the iron-based superconductivity. We perform a temperature-dependent angle-resolved photoemission spectroscopy study of Fe1.02Te, the parent compound for iron chalcogenide superconductors. Deep in the antiferromagnetic state, the spectra exhibit a “peak-dip-hump” line shape associated with two clearly separate branches of dispersion, characteristics of polarons seen in manganites and lightly-doped cuprates. As temperature increases towards the Neel temperature (TN), we observe a decreasing renormalization of the peak dispersion and a counterintuitive sharpening of the hump linewidth, suggestive of an intimate connection between the weakening electron-phonon (e-ph) coupling and antiferromagnetism. Our finding points to the highly-correlated nature of Fe1.02Te ground state featured by strong interactions among the charge, spin and lattice and a good metallicity plausibly contributed by the coherent polaron motion.
pacs:
74.25.Jb, 74.70.Xa, 79.60.-i, 71.38.-kThe role of many-body interactions is one of the central questions for unconventional superconductivity. For the recently discovered iron-based superconductors, the strength of electronic correlations is still an unsettled issue Paglione and Greene (2010); Wang et al. (2011). For one of them, iron chalcogenides, a strong correlation scenario has been proposed by theory Turner et al. (2009); Aichhorn et al. (2010) and supported by experiments Tamai et al. (2010); Nakayama et al. (2010); Zhang et al. (2010); Homes et al. (2010); Yamasaki et al. (2010); Hu et al. (2011); Liu et al. (2010); Chen et al. (2009). For their parent compound Fe1+yTe, while the high-temperature paramagnetic (PM) state shows similar signs for localized physics as in the undoped high-Tc cuprates in transport Liu et al. (2010) and optical Chen et al. (2009) experiments, the metallic behavior in the low-temperature antiferromagnetic (AFM) state (at TTN, TN=72 K for y=0.02) Liu et al. (2010, 2009) seems, prima facie, to deviate from localized physics and questions the importance of strong correlations.
In terms of the strength of coupling between itinerant electrons and other degrees of freedom including the localized spins, a recent theoretical work Yin et al. (2010) has pointed out similarities between iron chalcogenides and colossal magnetoresistive (CMR) manganites, a strongly-correlated prototype system also with a (ferro)magnetically ordered metallic ground state. A salient manifestation of strong coupling with collective modes in CMR manganites is the self-energy effect seen in the single-particle spectral function measured by angle-resolved photoemission spectroscopy (ARPES), which is characterized by a characteristic “peak-dip-hump” line shape that has been attributed to polaron formation Mannella et al. (2005, 2007). In this letter, we present temperature-dependent ARPES study on Fe1.02Te. Our result shows that the spectra in the AFM state contain signature of polarons reminiscent of those found in CMR manganites Mannella et al. (2005); Sun et al. (2006) and deeply underdoped cuprates Shen et al. (2004); Damascelli et al. (2003). This observation thus raises an intriguing perspective that the good metallicity of Fe1.02Te at low temperature arises from coherent polaron motion, as proposed for the manganites case Mannella et al. (2007). Different from the manganites case, however, the temperature evolution of the polaron feature shows signs of concomitant weakening of the strong-coupling polaron behavior and the magnetic ordering upon the increase of temperature. This in turn suggests the electronic correlations likely strengthen, rather than weaken as generally thought, in the AFM state. The observed intimate tracking of polaron behavior with the magnetic ordering points to a cooperation between lattice and magnetism as a key factor driving the low-temperature system towards the strong-coupling limit.
High quality Fe1.02Te single crystals were synthesized using flux method Liu et al. (2009). Excess Fe ratio was kept as low as possible and was determined by energy-dispersive X-ray spectrometry to be around 2. ARPES measurements were performed at beamline 5-4 at Stanford Synchrotron Radiation Lightsource (photon energy eV). The energy(angle) resolution is 7 meV(0.3∘). The samples were cleaved in situ, and measured in ultrahigh vacuum with pressure better than Torr.
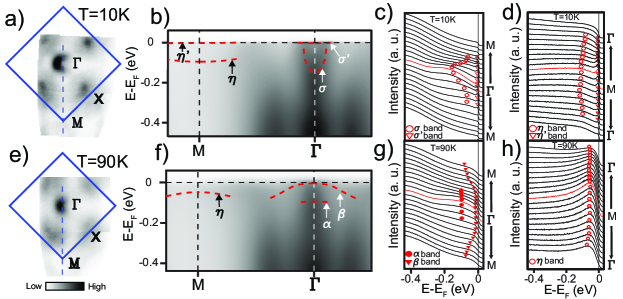
We first compare the electronic structure of Fe1.02Te above (90 K) and below (10 K) the AFM transition (Fig. 1). The electronic structure in the PM state [Fig. 1(e)-(h)] is characterized by overall broad features. Along the high symmetry -M direction in 2-Fe unit cell Brillouin zone, we can identify two hole-like bands (, ) around and one hole-like band () around M. The observed band dispersions show partial agreement with the DFT calculation Subedi et al. (2008): the and bands roughly follow the calculated dispersion, with the calculated bandwidth renormalized by a factor of 5. The predicted outermost hole-like band at and electron-like band at M may be suppressed by the polarization matrix elements. The photoemission intensity observed around X as shown on the Fermi surface plot [Fig. 1(e)] is not predicted by the calculation. We note that we do not see well-defined hole-like band duplicating feature at X as previously reported in Ref. Xia et al. (2009). Our spectra would be similar to those in Ref. Zhang et al. (2010) if their Brillouin zone definition is rotated by 45o [][WeusedX-raydiffractiontoalignthesamples; insuchawaythatisjustifiedbyacomprehensiveSe-concentrationdependencestudyofthebandstructureofFe$_1+y$Se$_x$Te$_1-x$; whichwillbereportedelsewhere.]liunextpaper.
Comparing with the PM state, electronic structure of Fe1.02Te in the AFM state is drastically different [Fig. 1(a)-(d)]: One electron-like feature is identified around the point ( band). The band at M shifts further away from EF. The and bands are characterized by very broad humps in EDCs and do not appear to cross EF. In the vicinity of EF, sharp quasiparticle peaks with small spectral weight are observed at both (’ band) and M (’ band). Note that these two sharp quasiparticle bands are not predicted in the bandstructure calculation for the AFM state Ma et al. (2009), nor do they look like extrinsic effects (such as impurity induced features) since they only appear close to EF where and features are observed.
We next focus on the and ’ bands inspired by their intimate dispersion relationship observed [Fig. 2(a)-(c)]. To track the features close to and above EF, we divide each EDC by the corresponding Fermi-Dirac function at the measurement temperature convolved with the instrument resolution [Fig. 2(a)]. We then perform background subtraction to highlight the and ’ features. An EDC far away from where and ’ bands both have vanishing intensity is chosen as the background and subtracted from all the EDCs around Kaminski et al. (2004).
The EDC plot of the and ’ bands [Fig. 2(b)] show canonical two-pole spectral functions, commonly referred to as the peak-dip-hump line shape Damascelli et al. (2003). Local minima (the dips) are observed at 18 meV below EF and break the dispersion into two branches. The high energy branch, the band, shows a broad hump feature which can be well fitted by a Gaussian function. The maxima of the hump overall follow the band dispersion determined by a parabolic fitting of the momentum distribution curve (MDC) peaks [Fig. 2(c)]. But it starts to deviate from the MDC derived dispersion, levels off and tends to bend back when getting close to around 60 meV below EF. The low energy branch, electron-like ’ band, is characterized by a sharp quasiparticle peak and could be well fitted by a Lorentzian function. It also has small bandwidth: A parabolic fitting shows its effective mass of 18 me at 30 K, which is 90 times larger than the band mass derived from the MDC dispersion, which was previously demonstrated to produce a band dispersion akin to the LDA predicted bareband Mannella et al. (2005). Similar features are also observed in the and ’ bands at the M point (see below).
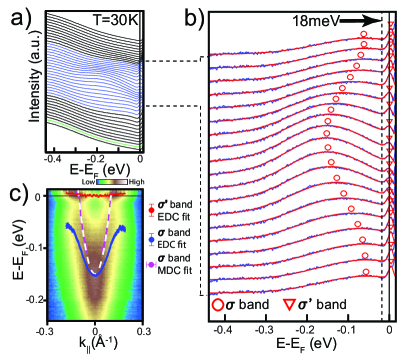
Such self-energy effect in the single-particle spectral function of Fe1.02Te bears strong resemblance to that seen in deeply underdoped cuprates Shen et al. (2004); Damascelli et al. (2003) and CMR manganites La2-2xSr1+2xMn2O7 Mannella et al. (2005); Sun et al. (2006). A widely-accepted interpretation for those features in cuprates and manganites is due to the strong coupling between electrons and some bosonic collective modes, which leads to the formation of, e.g., polarons in the case of manganites. In this scenario, the hump feature describes the incoherent excitations of electrons strongly coupled to a bath of bosons (phonons) and the small quasiparticle peak which forms a heavily renormalized band associated with the coherent polaron motion Mannella et al. (2007). Our observation of the peak-dip-hump structure in the spectra and large effective mass enhancement of the quasiparticle band in Fe1.02Te is consistent with the polaron interpretation. In such a picture, the energy scale of the involved collective mode can be estimated from the dip position in the EDCs to be about 18 meV, which is very close in energy to the A1g phonon mode observed in Raman spectroscopy Xia et al. (2009); Okazaki et al. (2011) but rather different from the reported (,0) magnetic resonance mode at 7 meV Zaliznyak et al. (2011); Stock et al. (2011). This comparison suggests that the phonon is more likely the direct agent involved in the polaron formation, but as we will see below that the e-ph coupling alone might not be sufficient.
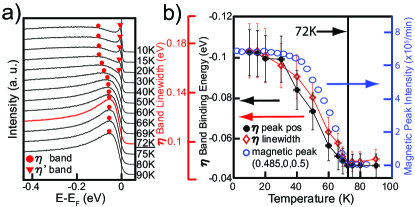
The temperature evolution of the ARPES spectra, especially across the AFM to PM phase transition, provides deeper insights into the polaron scenario in Fe1.02Te. In Fig. 3(a), we show the M point EDCs at various temperatures. As temperature increases, we observe distinct evolution behavior of the hump ( band) and the peak (’ band) features: the quasiparticle peak in the ’ band quickly loses spectral weight and becomes indiscernible eventually for T50 K; Meanwhile, the peak in the band first stays almost unchanged below 30 K. At 30 KTTN, the maximum position shifts towards lower binding energy (BE) and the linewidth of the hump becomes narrower. Finally above TN, the band stays basically unchanged again.
The distinct behavior of the and ’ bands together reveals how polarons evolve with temperature. A similar spectral weight reduction of the quasiparticle peak is also observed in the temperature evolution of the polaron line shape in manganites Mannella et al. (2007); de Jong et al. (2007) and was interpreted therein as loss of coherence of condensed polarons. The motion of coherent polarons at low temperature has been proposed to be an important factor (in addition to the double exchange mechanism) that contributes to the low-temperature metallicity of manganites. The observed temperature dependence of the ’ band is consistent with the polaron scenario and, by analogy, we propose that the coherent polaron motion might also play an important role in the metallic transport in the AFM state of Fe1.02Te - an important possibility that, to our knowledge, has been overlooked so far.
The evolution of the hump ( band) feature shows some onset behaviors at the magnetic ordering transition, different from the manganite case. In manganites the humps are broader and shift to higher BE at higher temperatures Mannella et al. (2007); de Jong et al. (2007). In contrast, in Fe1.02Te, the humps get narrower at higher temperatures [Fig. 3(a)] - a trend opposite to the expectation for the mere thermal smearing Hashimoto et al. (2010) - and shift toward low BE as temperature increases. We plot the BE and the hump linewidth of the band together with the Fe magnetic moment as a function of temperature in Fig. 3(b) and find that all of them show concomitant changes tied to TN. The linewidth change of the hump shows the weakening of electron incoherence (likely by phonon scattering) as Fe magnetism decreases rapidly across TN. While the observed band shift is certainly related to the AFM ordering, it cannot be directly explained by the resulting band reconstruction, because the ordering vector is in -X direction instead of -M and the bandstructure calculation did not reproduce the observed shift Ma et al. (2009). Alternatively, this apparent band shift could be taken as a natural consequence of the disappearing of the EDC “dip” that sets the peak and hump apart at low temperatures but can no longer be clearly resolved at T50 K. Therefore, the entire evolution of the band hump likely suggests the dissociation, rather than decoherence, of polarons, as a result of a weakened e-ph coupling upon approaching the magnetic ordering transition, which does not seem to occur in manganites.
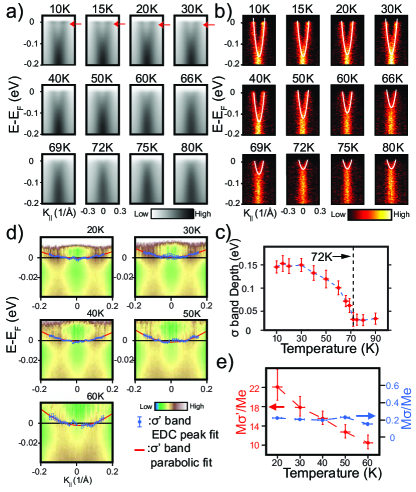
Such a unique aspect of the polaron formation in Fe1.02Te is further supported by a similar temperature evolution of the and ’ bands observed at the point, despite the complications therein introduced by the band reconstruction due to the AFM ordering (Fig. 4; see the supplemental material for a detailed discussion): the band shifts up from 150meV to 30meV below EF and becomes a part of the band around as the temperature increases, while the “vertical dispersion” sitting at the point [Fig. 4(a)(b)] becomes more prominent at high temperatures and is identified to be the band. The existence of the ’ band is indicated by the red arrows in Fig. 4(a) pointing to positions where the ARPES spectra break up into two dominant parts (the dips). Up to 30K the dips are clearly discernible and the positions unchanged, whereas they become increasingly obscure upon raising temperature. At T60 K (at ), both branches merge into one. Additionally, we could extract the effective mass of the ’ band from detailed EDC analysis at temperatures where the ’ band is discernable [Fig. 4(d)]. While the effective mass of the band does not show significant variation, the effective mass of the ’ band decreases as the temperature increases [Fig. 4(e)]. Such observation at provides a complementary angle to see how the e-ph coupling decreases when the AFM order diminishes.
Taken collectively, the observed temperature evolutions of the polaron features at both and M suggest that the e-ph coupling weakens along with the demise of the AFM. Consistent with these, a recent Raman experiment shows that the linewidth of the characteristic A1g phonon mode of the appropriate energy of the dip (20 meV) is broader at low temperature and narrower at high temperature, and the change is most dramatic across TN Gnezdilov et al. (2011).
From a theoretical perspective, antiferromagnetism could either reduce or increase the critical e-ph interaction for a polaron crossover. On one hand, carriers are slowed down due to surrounding spin flip clouds which make them subject to stronger e-ph interactions and a polaron formation at a smaller critical coupling; however, strong electronic correlations needed for antiferromagnetism can suppress charge fluctuations and the associated e-ph interaction, which would make polaron formation more difficult. This problem has been studied with several approaches in the context of the underdoped cuprates. Diagrammatic quantum Monte Carlo studies of a single hole in the t-J model coupled to optical phonons found that antiferromagnetism reduced the critical e-ph coupling for polaron formation Mishchenko and Nagaosa (2004). In contrast, dynamical mean field theory studies of polaron formation in the Hubbard-Holstein model have found an increase in the critical e-ph coupling for polaron formation in both PM Sangiovanni et al. (2005) and AFM Sangiovanni et al. (2006) state, yet the increase is much smaller in AFM state. A study utilizing the dynamic cluster approximation has found a synergistic interplay between antiferromagnetism and polaron formation, and a reduction in the critical coupling for polaron formation Macridin et al. (2006). These theoretical proposals suggest that the presence of antiferromagnetism helps polaron formation, compatible with our observations. Such a picture of the polaron formation as the result of a cooperative interplay among the magnetism and e-ph coupling sets Fe1.02Te uniquely apart from manganites.
We thank A. S. Mishchenko, A. F. Kemper, B. Moritz, D. J. Singh and J. S. Wen for enlightening discussions. This work is supported by the Department of Energy, Office of Basic Energy Sciences, Division of Materials Science. The work at Tulane is supported by the NSF under Grant No. DMR-0645305 and the LA-SiGMA program under Award No. EPS-1003897.
References
- Paglione and Greene (2010) J. Paglione and R. L. Greene, Nat Phys, 6, 645 (2010).
- Wang et al. (2011) F. Wang et al., Science, 332, 200 (2011).
- Turner et al. (2009) A. M. Turner, F. Wang, and A. Vishwanath, Phys. Rev. B, 80, 224504 (2009).
- Aichhorn et al. (2010) M. Aichhorn, S. Biermann, T. Miyake, A. Georges, and M. Imada, Phys. Rev. B, 82, 064504 (2010).
- Tamai et al. (2010) A. Tamai et al., Phys. Rev. Lett., 104, 097002 (2010).
- Nakayama et al. (2010) K. Nakayama et al., Phys. Rev. Lett., 105, 197001 (2010).
- Zhang et al. (2010) Y. Zhang et al., Phys. Rev. B, 82, 165113 (2010).
- Homes et al. (2010) C. C. Homes et al., Phys. Rev. B, 81, 180508 (2010).
- Yamasaki et al. (2010) A. Yamasaki et al., Phys. Rev. B, 82, 184511 (2010).
- Hu et al. (2011) J. Hu et al., Phys. Rev. B, 83, 134521 (2011).
- Liu et al. (2010) T. J. Liu et al., Nat Mater, 9, 718 (2010).
- Chen et al. (2009) G. F. Chen et al., Phys. Rev. B, 79, 140509 (2009).
- Liu et al. (2009) T. J. Liu et al., Phys. Rev. B, 80, 174509 (2009).
- Yin et al. (2010) W.-G. Yin, C.-C. Lee, and W. Ku, Phys. Rev. Lett., 105, 107004 (2010).
- Mannella et al. (2005) N. Mannella et al., Nature, 438, 474 (2005).
- Mannella et al. (2007) N. Mannella et al., Phys. Rev. B, 76, 233102 (2007).
- Sun et al. (2006) Z. Sun et al., Phys. Rev. Lett., 97, 056401 (2006).
- Shen et al. (2004) K. M. Shen et al., Phys. Rev. Lett., 93, 267002 (2004).
- Damascelli et al. (2003) A. Damascelli et al., Rev. Mod. Phys., 75, 473 (2003).
- Subedi et al. (2008) A. Subedi, L. Zhang, D. J. Singh, and M. H. Du, Phys. Rev. B, 78, 134514 (2008).
- Xia et al. (2009) Y. Xia et al., Phys. Rev. Lett., 103, 037002 (2009a).
- (22) .
- Ma et al. (2009) F. Ma, W. Ji, J. Hu, Z.-Y. Lu, and T. Xiang, Phys. Rev. Lett., 102, 177003 (2009).
- Kaminski et al. (2004) A. Kaminski et al., Phys. Rev. B, 69, 212509 (2004).
- Xia et al. (2009) T.-L. Xia et al., Phys. Rev. B, 79, 140510 (2009b).
- Okazaki et al. (2011) K. Okazaki, S. Sugai, S. Niitaka, and H. Takagi, Phys. Rev. B, 83, 035103 (2011).
- Zaliznyak et al. (2011) I. A. Zaliznyak et al., Phys. Rev. Lett., 107, 216403 (2011).
- Stock et al. (2011) C. Stock, E. E. Rodriguez, M. A. Green, P. Zavalij, and J. A. Rodriguez-Rivera, Phys. Rev. B, 84, 045124 (2011).
- Lipscombe et al. (2011) O. J. Lipscombe et al., Phys. Rev. Lett., 106, 057004 (2011).
- de Jong et al. (2007) S. de Jong et al., Phys. Rev. B, 76, 235117 (2007).
- Hashimoto et al. (2010) M. Hashimoto et al., Nat Phys, 6, 414 (2010).
- Gnezdilov et al. (2011) V. Gnezdilov et al., Phys. Rev. B, 83, 245127 (2011).
- Mishchenko and Nagaosa (2004) A. S. Mishchenko and N. Nagaosa, Phys. Rev. Lett., 93, 036402 (2004).
- Sangiovanni et al. (2005) G. Sangiovanni, M. Capone, C. Castellani, and M. Grilli, Phys. Rev. Lett., 94, 026401 (2005).
- Sangiovanni et al. (2006) G. Sangiovanni, O. Gunnarsson, E. Koch, C. Castellani, and M. Capone, Phys. Rev. Lett., 97, 046404 (2006).
- Macridin et al. (2006) A. Macridin, B. Moritz, M. Jarrell, and T. Maier, Phys. Rev. Lett., 97, 056402 (2006).