Boolean network-based model of the Bcl-2 family mediated MOMP regulation
Abstract
Mitochondrial outer membrane permeabilization (MOMP) is one of the most important points, in majority of apoptotic signaling cascades. Decision mechanism controlling whether the MOMP occurs or not, is formed by an interplay between members of the Bcl-2 family. To understand the role of individual members of this family within the MOMP regulation, we constructed a boolean network-based mathematical model of interactions between the Bcl-2 proteins. Results of computational simulations reveal the existence of the potentially malign configurations of activities of the Bcl-2 proteins, blocking the occurrence of MOMP, independently of the incoming stimuli. Our results suggest role of the antiapoptotic protein Mcl-1 in relation to these configurations. We demonstrate here, the importance of the Bid and Bim according to activation of effectors Bax and Bak, and the irreversibility of this activation. The model further shows the distinct requirements for effectors activation, where the antiapoptic protein Bcl-w is seemingly a key factor preventing the Bax activation. We believe that this work may help to describe the functioning of the Bcl-2 regulation of MOMP better, and hopefully provide some contribution regarding the anti-cancer drug development research.
keywords:
Boolean network , Bcl-2 family , apoptosis , mitochondria1 Introduction
Apoptosis is a process of programmed cellular death, distinct from necrosis [1, 2], which can be well distinguished by its morphology [3]. It is an important homeostatic mechanism, defects of which may cause variety of serious diseases, including the neurodegenerative disorders [4], autoimmune diseases [5], or even a cancer [6, 7, 8]. Signals leading to an apoptosis initiation can originate from an extracellular environment or from a cell’s internal space [9, 8]. Apoptotic signals further proceed through an apoptotic signaling and regulatory network, that contains several control points [9, 8]. One, highly important of such points is formed by a family of Bcl-2 (B-cell lymphoma 2) proteins [10, 11]. An interplay between the Bcl-2 family’s members controls one of the most crucial apoptotic events - the mitochondrial outer membrane permeabilization (MOMP) [12, 13].
MOMP allows release of apoptotic key players - Smac/DIABLO and a cytochrome c, from a mitochondrial intermebrane space to a cytosol [12, 13]. In presence of ATP, released cytochrome c binds to a cytosolic protein Apaf-1, causing Apaf-1 oligomerization and a recruitment of an inactive pro-caspase-9, leading to formation of a multi-protein complex known as an apoptosome [14, 15, 16]. Within the apoptosome, pro-caspase-9 subsequently undergoes processing and activation [14, 15, 16]. The active caspase-9 proteolytically activates caspase-3 [17]. Smac/DIABLO, once released to the cytosol, inhibits XIAP (X-linked inhibitor of apoptosis) - the most prominent suppressor of caspases -3 and -9 [18]. Caspase-3 and other effector caspases (caspases -6 and -7) are the primary executioners of the apoptosis [19, 8]. Activation of these makes the point of no-return, after which apoptosis irreversibly occurs [20]. Although, mitochondria-independent apoptotic signaling pathways are currently well known [21], the mitochondrial (also known as intrinsic) pathway currently remains to be considered as the major one [22].
The Bcl-2 family mediated control of MOMP is carried in ”all or nothing” manner, giving no possibility of intermediate MOMP. A mechanism of controlling such a decision resembles what a complex systems science describes as a bistable switch. Currently the steady-state bistability is considered as the most suitable framework for a description of the apoptosis control. This interesting system properties have made Bcl-2 family an attractive subject of a mathematical modeling and computer simulations. There are several works regarding a modeling and a simulation of the Bcl-2 family and the control of MOMP, revealing and examining a variety of non-linear system behaviors such as robustness, stimulus-response ultrasensitivity [23] and bistability [24, 25, 26]. Besides these, Bcl-2 family was involved in several other, more general models of apoptosis signaling [27, 28, 29].
All the above-mentioned models were utilized to dynamically simulate the chemical reaction kinetics of the studied biological system. Complexity of such models is often reduced by grouping of several functionally similar species together. Moreover, the most prominent group’s member is taken as the model’s representation of the whole group of species. Although previous models of Bcl-2 regulatory network are on the various levels of details, they all adopt such simplification. This is done usually by grouping the Bcl-2 family’s members into three groups according to their structural and functional classification. Such division provides reasonable trade-off between model’s simplicity and plausibility. However, when grouped together, certain important functional specificities of Bcl-2 family’s individuals are ignored.
The critical limitation in the development of the detailed, quantitative model of the Bcl-2 family is the absence of biological data. The identification of the quantitative parameters (e. g. reaction rates and/or physiological concentrations of species) is dependent on the relevant experimental in vivo measurements, which are still a systems biology bottle neck [30]. In absence of quantitative data, such detailed models of Bcl-2 family must be limited to a qualitative manner.
In this work we provide a qualitative model of the Bcl-2 family mediated regulation of MOMP based on the Boolean network modeling. The boolean network (BN) approach is one of the most suited to a qualitative modeling of complex biological systems, even with a limited biological knowledge [30, 31]. BN, first introduced in the late 1960s [32], has been originally used to model gene regulatory networks and signaling pathways [33]. Although, BN does not model dynamics of the studied system, it may reveal and examine many interesting complex-system properties [33]. The certain members of the Bcl-2 family appeared for the first time in BN-based model in work of Calzolari et al [34], involved in the model of an apoptosis gene network. Mai and Liu [31] and few months later Schlatter et al [30], published currently the most recent BN-based models of apoptosis, both containing simplified mechanism of Bcl-2 family MOMP control. However, as far as we know, there haven’t been published any BN-based model, focused solely on the Bcl-2 family.
2 Materials and methods
2.1 Model’s structure and its biological relevance
Bcl-2 family’s members are functionally classified as either antiapoptotic, or proapoptotic. Structurally, Bcl-2 proteins can be categorized according to the number of Bcl-2 homology domains (BH) in their -helical regions [35, 8]. Antiapoptotic members (Mcl-1, A1, Bcl-xL, Bcl-2, Bcl-w and Bcl-B) are characterized by the presence of four BH domains (BH1-4) [36, 37]. Their role is to prevent MOMP by inhibition of proapoptotic family members [36, 37]. Proapoptotic members can be divided to BH3-only proteins and multidomain proteins - effectors [8]. BH3-only proteins can be further subdivided based upon their role in apoptotic signaling. BH3-only subgroup members, termed sensitizers (Noxa, Bad, Puma, Hrk, Bmf and Bik), can only bind to antiapoptotic Bcl-2 proteins, forming inactive dimers [35]. Members of another BH3 subgroup, termed activators (Bim and Bid), can act in the same way [35], but in addition, activators can directly activate effectors [36, 38]. Effectors, once activated, undergo oligomerization and form pores in mitochondrial outer membrane (MOM), leading eventually to MOMP. [39, 13]. Therefore, effectors are primary target of inhibition by their antiapoptotic relatives [38].
Altogether, interactions between Bcl-2 family members can be classified into only three types: i) Binding and mutual inhibition between antiapoptotic and BH3-only proteins. ii) Binding and mutual inhibition between antiapoptotic proteins and effectors. iii) Activation of effectors by BH3 only proteins. However, the situation ceases be so simple when we focus on the interaction between individual molecules. E.g., the BH3 only sensitizer Noxa can bind to and inhibit only two antiapoptotic proteins (see Table 1) [40, 35, 8], but the other BH3 only sensitizer, Puma is able to inhibit five of six major antiapoptotic proteins [40, 35, 8]. On the other hand, while it seems that antiapoptotic protein Bcl-B is not bound and inhibited by any of the BH3 only proteins [41], the other anti-apoptotic protein Bcl-xL is bound by seven of them [40, 8]. There is also a strong asymmetry in the level of inhibition of effectors by antiapoptotic proteins. While Bak is inhibited only by three antiapoptotic proteins, Bax is inhibited by all six of them [35, 8].
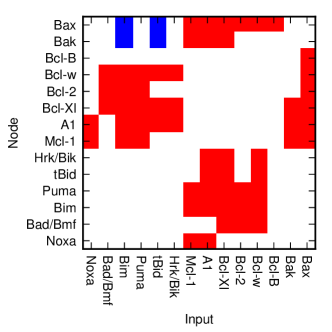
Knowledge about interaction between Bcl-2 family’s members, was translated to the boolean-based model we present here. The model contains 14 nodes, representing the Bcl-2 family’s members. Each member of the Bcl-2 family is represented by one of the model’s nodes. Except of the proteins Bad and Bmf that are coupled together and represented by a single node, and similarly the proteins Hrk and Bik. The proteins that were coupled together, share the same intra-familiar interaction profiles (see Table 1). The model contains 34 connection between nodes, each representing one molecular interaction.
| Bcl-2 | Bcl-2 | Full name of the protein | Binds to and inhibits | Ref. |
|---|---|---|---|---|
| family class | family member | |||
| Antiapoptotic | ||||
| members: | ||||
| Mcl-1 | Myeloid cell leukemia sequence-1 | Noxa, Bim, Puma, Bax, Bak | [40, 8] | |
| Bcl-2 | B-cell lymphoma 2 | Bad, Bim, Puma, Bmf, Bax | [40, 8] | |
| A1 | Bcl-2 related protein | Noxa, Bim, Puma, Bid, Hrk, Bik, Bax, Bak | [40, 8] | |
| Bcl-xL | Bcl-2-like | Bad, Bim, Puma, Bid, Hrk, Bmf, Bik, Bak, Bax | [40, 8] | |
| Bcl-w | Bcl-2-like-2 | Bad, Bim, Puma, Bid, Hrk, Bmf, Bik, Bax | [40, 8] | |
| Bcl-B | Bcl-2-like-10 | Bax | [41] | |
| BH3-only | ||||
| members: | ||||
| Noxa | Phorbol-12-myristate-13-acetate-induced protein 1 | Mcl-1, A1 | [40, 35, 8] | |
| Bad | Bcl-2 antagonist of cell death | Bcl-xL, Bcl-w, Bcl-2 | [40, 35, 8] | |
| Bim | Bcl-2like-11 | Bcl-xL, Bcl-w, Bcl-2, Mcl-1, A1 | [40, 35, 8] | |
| Puma | Bcl-2-binding component-3 | Bcl-xL, Bcl-w, Bcl-2, Mcl-1, A1 | [40, 35, 8] | |
| tBid | truncated BH3-interacting domain death agonist | Bcl-xL, Bcl-w, A1 | [40, 35] | |
| Hrk | Harakiri | Bcl-xL, Bcl-w, A1 | [40] | |
| Bmf | Bcl-2-modifying factor | Bcl-xL, Bcl-w, Bcl-2 | [40, 35] | |
| Bik | Bcl-2-interacting killer | Bcl-xL, Bcl-w, A1 | [40] | |
| Effectors: | ||||
| Bak | Bcl-2-antagonist/killer-1 | Bcl-xL, Mcl-1, A1 | [35, 8] | |
| Bax | Bcl-2-associated X protein | Bcl-xL, Bcl-w, Bcl-2, Bcl-B, Mcl-1, A1 | [35, 8] |
2.2 Transition rules
In a given time, each of the model’s nodes can be in either the active or inactive state. Each of the nodes is affected by received inputs from one or several other upstream nodes. The state of the node in the next time step is defined by the following transition rule:
| (1) | |||||
| (5) |
Here, specifies the relation of the -th node to -th node, and may have three possible values: if -th node activates -th node, if -th node inhibits -th node and , if nodes and are not connected (the relationships between each of the model’s nodes are depicted in the Figure 1). The value of defines the expression of the protein represented by the -th node (see Section 2.3). Since Bcl-2 family members inhibit each other by mutual binding and formation of inactive dimers, our model treats the inhibitory relationships between two nodes as bipartite (if , then ).
2.3 Influence of the external conditions
The transition function of the -th node is dependent on the value of . The value of vector () represents here, what we termed the ”expression” of the the Bcl-2 family proteins. The value , corresponds to the cellular conditions allowing the synthesis and, if required, the post-translational/post-transcriptional activation (e. g. activation of Bid requires proteolytic cleavage by Caspase-8 [42]) of the -th protein. Alternatively, the value , corresponds to the conditions preventing the synthesis and/or post-translations activation of the -th protein.
Since the model contains 14 nodes, the vector of expressions could have of possible values. However, since other than BH3-only mediated activation of Bax/Bak is irrelevant in our work (the subject of our study is the Bcl-2 family mediated regulation of MOMP), we exclude here the expression vectors where or , reducing thus the number of possible values to . The value of the vector remains constant during each simulation span.
2.4 Model’s ending states
The simulation is terminated in the time if state of the model () is satisfying the following condition:
| (6) |
The condition described in the eq. (6), can imply either that the model converged to the steady-state (), the model is oscillating between two different states (), or the model is periodically orbiting through the set of states ().
The state , satisfying the condition (6) is the model’s ending state . If the involves the states of both effectors, and , then the is denoted as the ”survival” state. If the involves the states of one of the effectors, , or , then the is simply denoted as the ”pro-momp” state.
3 Results
3.1 We have revealed 1046 of the ”survival” states, in which the model can persist while the effectors Bak and Bax remain inactive.
The very first step, in order to investigate the properties of the model, was to find the ending states in which model is allowed to persist without the activation of effectors (Bak and Bax) - survival states (see 2.4).
Therefore, for each of the expression vectors (see 2.3) we performed, simulations spans, each span starting from one of the of the initial states (, that is the number of possible initial states).
We have identified of the unique survival states. The of these states are logical steady-states, remaining of the survival states are oscillating. Hereafter, we assume that under normal cellular conditions the Bcl-2 regulatory mechanism can persist only within one of these 1046 states. In any of these states, the model may persist only under certain expression vectors. As we change the expressions, the model may relocate from the given survival state to the opposite one.
In the next step, we have investigated the transitions from the survival states to other ending states. To analyze this transitions, for each of the of the survival states, we have performed simulation spans, each span using one of the expression vectors. For each simulation, the given survival state has been used as the initial state of the model.
Around of the millions () of simulations led to survival, remaining of the simulations led to pro-momp ending states, where at least one of the effectors was found active.
3.2 We discovered 200 of the ”tumor” states – once accessed by the model, the model remains trapped, unable to turn out, to any functionally distinct state.
During the analysis of the transitions between the survival states and the pro-momp states, we have revealed interesting finding. We have discovered, the existence of survival states, from which the model is unable to be turned to pro-momp states, regardless of the vector of expressions. Moreover, the model, once located in such a ”trapping” state, can only be turned to other trapping state. The trapping of the Bcl-2 regulatory mechanism in one of these states, would cause fatal malfunctioning of the momp regulation, that could possibly result in a tumorgenesis. Therefore, we denoted these states as the ”tumor” states.
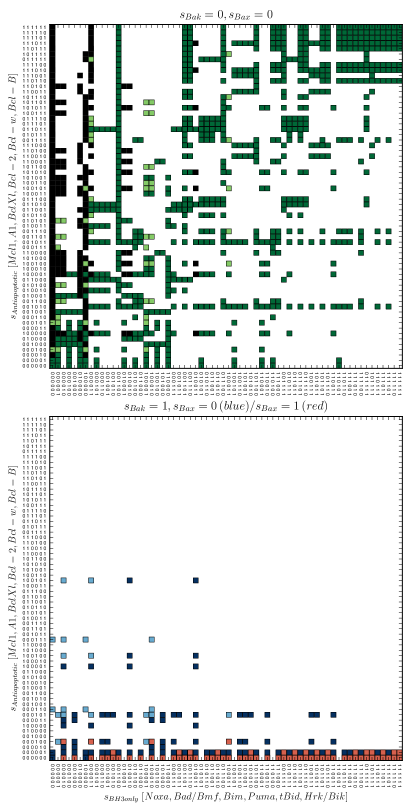
These states (see the black squares in the Fig 2, top) can be characterized by strong imbalance in activity of antiapoptotic vs BH3-only proteins. The tumor states are especially abundant among the survival states involving the activity of Mcl-1. Although the activity of Mcl-1 is not necessary, nor sufficient condition to classify a given model’s state as tumor state, it seems that Mcl-1 plays a certain role here.
3.3 There are two functionally distinct subsets of survival states. Those which allow model to activate the Bak, but not Bax and the states allowing activation of both effectors.
Remaining survival states, can further be classified in two groups. From the survival states of the first group, model can relocate only to pro-momp states where the only active effector is Bak. From the survival states of the second group, model can be turned to states with a single effector (Bak) activity, as well as to the pro-momp states, where both effectors are active. While, the first group we denoted as ”semioptimal” (the light green squares in Fig 2, top), the second one we denoted as ”optimal” (the dark green squares in Fig 2, top).
Similarly, we may distinguish several functionally distinct subsets among the pro-momp states. Firstly, the every pro-momp state may be classified according to the activity of effectors. We have found of the pro-momp states, in which, the Bak is being active, but Bax remains inactive (the blue squares in Fig 2, bottom). Besides these, we also have found of the pro-momp states, in which both effectors are being active (the red squares in Fig 2, bottom). However, we haven’t found any such ending state, where the Bax was active, while the Bak not, indicating that such state is unaccessible by the model, regardless of expressions or initial conditions.
Secondly, the first of the mentioned groups – Bak-active only, can further be divided in two functionally distinct subgroups: states which allow additional activation of Bax (the light blue squares in Fig 2, bottom), and those which doesn’t (the dark blue squares in Fig 2, bottom).
It is very interesting that, while the first subgroup is accessible only from the ”optimal” survival states, the second one, can be accessed from both, ”optimal” and ”semioptimal” survival states.
3.4 Survival to momp transition is irrevesible.
We have performed another series of simulations, repetitively simulating the model under each of the expressions vectors, while using the pro-momp states as the initial conditions. We have found out that it is impossible to turn the model from any of the pro-momp states back to the survival one, regardless of the expressions.
3.5 The transitions from the survival to momp are caused by expression changes of four distinct types.
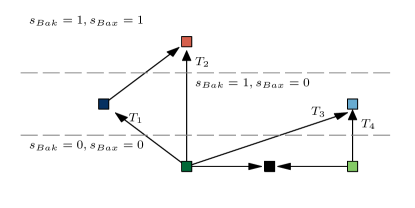
When taking previous results together, we may distinguish six distinct groups of model’s ending states. Where three of these groups associate survival states, involving no effectors activity, two of them associate pro-momp states, involving the activity of Bak, but not Bax, and the one group associating the states involving the activity of both effectors. Assuming that, the occurrence of momp requires only the single effector activation, four types of survival-to-momp transitions can be distinguished ( – , see Fig 3).
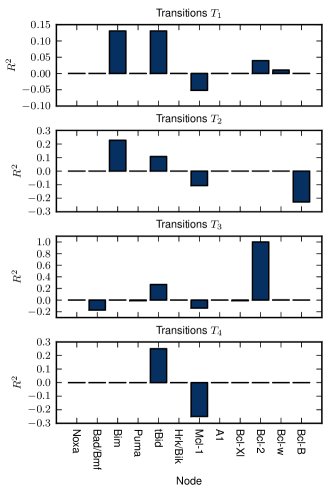
By calculation of the coefficient of multiple correlation (for more details see A) – , we have analyzed the influence of the expression of the given protein on the initiation of these transitions. In addition to this, we also have studied the importance of the individual proteins’ expression, to obtain the picture about how these affect the momp initiation.
The results we have gained (see Fig 4) show that regardless of the transition type, the continuous expression of at least one of the activators (Bim, tBid) is, as expected, the key factor determining whether the transition to momp occurs or not. On the other hand it seems that the continuous expression of the Mcl-1 is the factor that prevents the momp at the most, compared to expressions of other antiapoptotic proteins. It seems that the statistical importance of the expression of activators and the absence of Mcl-1 is common for both and . Nevertheless, the transitions of type - the activation of both effectors, additionally relies on the lack of Bcl-B expression. This finding is not surprisable as the Bcl-B is the model’s major inhibitor of Bax that is not suppressed by any of the BH3-only proteins. Furthermore, model predicts that after the transition of the type drives the model to the Bak-active pro-momp state, subsequent downregulation of Bcl-B could cause the additional activation of Bax (the arrow pointing from the dark blue square to the red one, Fig 3)
Transitions of the type differs from previous types, since it occurs in the presence of the Bcl-2 expression, exclusively. The transitions of type are caused by lack of the Mcl-1 expression while involve the tBid expression. However, the type of transitions may probably occur only rarely, since the number of ”semioptimal” states is very small compared to the number of ”optimal” ones.
Besides the survival-to-momp transitions we have been interested about the causes of the transition from ”optimal”/”semioptimal” to ”tumor” states. We have found (data not shown) that the trapping of the model within the ”tumor” state simply occurs as the anti-apoptotic expression disproportionately dominates over the expression of BH3-only proteins. This points to the necessity of the balance between the presence and synthesis of the both pro- and anti-apoptotic Bcl-2 proteins within the cell.
4 Discussion
We have analyzed the Bcl-2 family interaction network using the boolean network-based computational model. Bcl-2 family members have been represented by model’s nodes, which activity was binary encoded. The active (ON state) of the given node represents the biologically active form of the represented protein. Nodes are mutually interacting according to the given transition rules, and pre-defined relationship matrix, representing the chemical interactions among the Bcl-2 proteins. In addition, the model behavior has been influenced by the vector of expressions, that is representing the biological conditions, change of which is the primary driving force of the Bcl-2 regulatory mechanism. The expression here is a mean to include the post-translational and/or post-transcriptional activation of zymogens, if relevant for given protein.
Computational simulations of the model, suggest that the Bcl-2 family can withstand wide variety of signals controlling the activity of its pro- and anti-apoptotic members, without causing the activation of Bax or Bak. While allowing the cell survival, the Bcl-2 family may preserve in one of the many different states. However, our results show, that once the anti-apoptotic proteins significantly overwhelm the BH3-only proteins’s activity, the Bcl-2 family regulation may be seriously harmed. Our model predicts, that once this happens, even the subsequent activation of pro-apoptotic BH3-only proteins, cannot reverse the MOMP regulation malfunctioning. Moreover, our results suggest that the presence of the anti-apoptotic protein Mcl-1 may play an important role here. However, the existence of such ”tumorgeneric” trap shows the importance of the equilibrium, dynamically preserved by the continuous expression of both anti- and pro-apoptotic proteins.
According to our simulations, depending on the current state of the Bcl-2 family, certain configurations of the incoming signals can cause state transition including the activation of effectors Bak, and/or Bax. As the most important factors among such signals are the activation of Bid (its truncation to tBid) and/or the activation of Bim and the downregulation of Mcl-1. It seems that the activation of Bak is much less stimuli-demanding compared to the activation of Bax. However, it seems that the activation of Bax strongly benefits from the Bcl-w downregulation. Finally, our results confirm the irreversibility of the effectors activation.
Despite the limited predictive and explanatory power of the boolean-based approach, we believe that the proposed model sheds a light on the modus operandi of the Bcl-2 mediated regulation of momp. In future we would like to focus our attention on the system properties of the same model, including its robustness and responsivity.
Appendix A Calculation of multiple determination coefficients
This analysis is proposed to compare the importance of the presence/absence of particular proteins expression, regarding the transition from certain group of states to another group of states. Here we describe the methodology we used in these analyses.
Let’s have set of unique expression vectors – that cause the studied transition. For each couple of nodes , we can calculate the phi coefficient:
| (7) |
where , , , , are counts of the following combinations of values , across the set of expression vectors:
| total | |||
| total |
The phi coefficient is a measure of association for two binary variables, similar to Pearson correlation coefficient.
The matrix of phi coefficients - , is then used as to calculate the coefficient of multiple determination – :
| (8) |
where the is the vector of values . is actually the vector of correlations between the independent variables and the target variable – . is the transpose of . The is the matrix , reduced by removing the -th line and -th column. is actually the matrix of correlations between the independent variables and is the inverse of the matrix .
Finally, the was multiplied by if the count of appearances greater than of the , across the set of expressions – the expression of the -th node was mostly absent among the expression vectors causing the given transition.
In the case that the values of protein expression had no variability – either , or among all the expression vectors, the was arbitrary set either to , or , respectively. The correlations of any of the other expression with the were then excluded from any other calculations. Such situation occurs in case of expression of Bcl-2 among the transitions of the type (see Fig 4)
References
- [1] E. Ulukava, C. Acilan, Y. Y, Apoptosis: why and how does it occur in biology?, Cell Biochemistry and Function 29 (2011) 468–80.
- [2] A. H. Wyllie, ”where, o death, is thy sting?” a brief review of apoptosis biology, Molecular Neurobiology 42 (2010) 4–9.
- [3] S. Elmore, Apoptosis: A review of programmed cell death, Toxicologic Pathology 35 (2007) 495–516.
- [4] M. P. Mattson, Neuronal life-and-death signaling, apoptosis, and neurodegenerative disorders, Antioxidants & Redox Signaling 8.
- [5] S. Nagata, Apoptosis and autoimmune diseases, Annals of the New York Academy of Sciences 1209 (2010) 10–16.
- [6] C. Burz, I. Berindan-Neagoe, O. Balacescu, A. Irimie, Apoptosis in cancer: Key molecular signaling pathways and therapy targets, Acta Oncologica 48 (2009) 811–821.
- [7] S. Fulda, Tumor resistance to apoptosis, International Journal of Cancer 124 (2009) 511–515.
- [8] A. Strasser, S. Cory, J. M. Adams, Deciphering the rules of programmed cell death to improve therapy of cancer and other diseases, EMBO Journal 30 (2011) 3667–3683.
- [9] A. Strasser, L. O’Connor, V. M. Dixit, Apoptosis signaling, Annual Review of Biochemistry 69 (2000) 217–245.
- [10] N. N. Danial, S. J. Korsmeyer, Cell death: Critical control points, Cell 116 (2004) 205–219.
- [11] J. E. Chipuk, D. R. Green, How do bcl-2 proteins induce mitochondrial outer membrane permeabilization?, Trends in Cell Biology 18 (2008) 157–164.
- [12] S. W. G. Tait, D. R. Green, Mitochondria and cell death: outer membrane permeabilization and beyond, Nature Reviews Molecular Cell Biology 11 (2010) 621–632.
- [13] T. Landes, J. C. Martinou, Mitochondrial outer membrane permeabilization during apoptosis: the role of mitochondrial fission, Biochimica et Biophysica Acta 1813 (2011) 540–545.
- [14] P. D. Mace, S. J. Riedl, Molecular cell death platforms and assemblies, Current Opinion In Cell Biology 22 (2010) 828–836.
- [15] E. Perez-Paya, M. Orzaez, L. Mondragon, D. Wolan, J. A. Wells, A. Messequer, M. J. Vincent, Molecules that modulate apaf-1 activity, Medical Research Reviews 31 (2011) 649–675.
- [16] A. V. Kulikov, E. S. Shilov, I. A. Mufazalov, V. Gogvadze, S. A. Nedospasov, B. Zhivotinsky, Cytochrome c: the achilles’ heel in apoptosis, Cellular and Molecular Life Sciences 69 (2012) 1787–1797.
- [17] M. L. Wurstle, M. A. Laussmann, M. Rehm, The central role of initiator caspase-9 in apoptosis signal transduction and the regulation of its activation and activity on the apoptosome, Experimental Cell Research 318 (2012) 1213–1220.
- [18] G. Martinez-Ruiz, V. Maldonado, G. Caballos-Cancino, J. P. Grajeda, J. Melendez-Zajgla, Role of smac/diablo in cancer progression, Journal of Experimental & Clinical Cancer Research 27.
- [19] M. Olsson, B. Zhivotinsky, Capases and cancer, Cell Death & Differentiation 18 (2011) 1441–1449.
- [20] D. R. Green, G. B. Amarate-Mendes, The point of no return: mitochondria, caspases, and the commitment to cell death, Results and Problems in Cell Differentiation 24 (1999) 45–61.
- [21] D. Wallach, T.-B. Kang, A. Kovalenko, The extrinsic cell death pathway and the elan mortel, Cell Death & Differentiation 15 (2008) 1533–1541.
- [22] J. Estaquier, F. Vallette, J. L. Vayssiere, B. Mignotte, The mitochondrial pathways of apoptosis, Advances in Experimental Medicine and Biology 942 (2012) 157–183.
- [23] C. Chen, J. Cui, W. Zhang, P. Shen, Robustness analysis identifies the plausible model of the bcl-2 apoptotic switch, FEBS Letters 581 (2007) 5143–5150.
- [24] J. Cui, C. Chen, H. Lu, T. Sun, P. Shen, Two independent positive feedbacks and bistability in the bcl-2 apoptotic switch, PLoS ONE 3 (2008) 1469.
- [25] T. Sun, X. Lin, Y. Wei, Y. Xu, P. Shen, Evaluating bistability of bax activation switch, FEBS Letters 584 (2010) 954–960.
- [26] T. Tokar, J. Ulicny, Computational study of bcl-2 apoptotic switch, Physica A.
- [27] E. Z. Bagci, Y. Vodovotz, T. R. Billiar, G. B. Ermentrout, I. Bahar, Bistability in apoptosis: Roles of bax, bcl-2, and mitochondrial permeability transition pores, Biophysical Journal 90 (2006) 1546–1559.
- [28] J. G. Abeck, J. M. Burke, B. B. Aldridge, M. Zhang, D. A. Lauffenburger, P. K. Sorger, Quantitative analysis of pathways controlling extrinsic apoptosis in single cells, Molecular Cell 30 (2008) 11–25.
- [29] H. Harrington, K. L. Lo, S. Ghosh, K. Tung, Construction and analysis of a modular model of caspase activation in apoptosis, Theoretical Biology and Medical Modelling 90 (2008) 1546–1559.
- [30] R. Schlatter, K. Schmich, I. Avalos Vizcarra, P. Scheurich, T. Sauter, C. Borner, M. Ederer, I. Merfort, O. Sawodny, On/off and beyond–a boolean model of apoptosis, PLoS Computational Biology 5.
- [31] Z. Mai, H. Liu, Boolean network-based analysis of the apoptosis network: Irreversible apoptosis and stable surviving, Journal of Theoretical Biology 259 (2009) 760–769.
- [32] S. A. Kauffman, Metabolic stability and epigenesis in randomly constructed genetic nets, Journal of Theoretical Biology 22 (1969) 437–467.
- [33] T. Helikar, N. Kochi, J. Konvalina, J. A. Rogers, Boolean modeling of biochemical networks, The Open Bioinformatics Journal 5 (2011) 16–25.
- [34] D. Calzolari, D. Paternostro, P. L. J. Harrington, C. Piermarocchi, P. M. Duxbury, Selective control of the apoptosis signaling network in heterogenous cell populations, PLoS One 2.
- [35] R. Elkholi, K. V. Floros, J. E. Chipuk, The role of bh3-only proteins in tumor cell development, signaling, and treatment, Genes Cancer 2.
- [36] J. E. Chipuk, T. Moldoveanu, F. Llambi, M. J. Parsons, D. R. Green, The bcl-2 family reunion, Molecular Cell 37 (2010) 299–310.
- [37] W. J. Placzek, J. Wei, S. Kitada, D. Zhai, J. C. Reed, M. Pellecchia, A survey of the anti-apoptotic bcl-2 subfamily expression in cancer types provides a platform to predict the efficacy of bcl-2 antagonists in cancer therapy, Cell Death and Disease 6.
- [38] D. Westhpal, G. Dewson, P. E. Czabotar, R. M. Kluck, Molecular biology of bax and bak activation and action, Biochimica Biophysica Acta 4 (2011) 521–531.
- [39] L. M. Dejean, S. Y. Ryu, S. Martinez-Caballero, O. Teijido, P. M. Peixoto, K. W. Kinnally, Mac and bcl-2 family proteins conspire in a deadly plot, Biochimica Biophysica Acta 1797 (2010) 1231–1238.
- [40] L. Chen, S. N. Willis, A. Wei, B. J. Smith, J. I. Fletcher, M. G. Hinds, P. M. Colman, C. L. Day, J. M. Adams, D. C. S. Huang, Differential targeting of prosurvival bcl-2 proteins by their bh3-only ligands allows complementary apoptotic function, Molecular Cell 17 (2005) 393–403.
- [41] G. J. P. Rautureau, C. L. Day, M. G. Hinds, The structure of boo/diva reveals a divergent bcl-2 protein, Proteins 78 (2010) 2181–2186.
- [42] C. Kantari, H. Walczak, Caspase-8 and bid: caught in the act between death receptors and mitochondria, Biochimica Biophysica Acta 4 (2011) 558–563.