Thomson Scattering and Collisional Ionization in the X-rays Grating Spectra of the Recurrent Nova U Scorpii
Abstract
We present a Chandra observation of the recurrent nova U Scorpii, done with the HRC-S detector and the LETG grating on day 18 after the observed visual maximum of 2010, and compare it with XMM-Newton observations obtained in days 23 and 35 after maximum. The total absorbed flux was in the range 2.2-2.6 erg cm-2 s-1, corresponding to unabsorbed luminosity 7-8.5 10(d/12 kpc)2 for N(H)=2-2.7 1021 cm-2. On day 18, 70% of the soft X-tray flux was in a continuum typical of a very hot white dwarf (WD) atmosphere, which accounted for about 80% of the flux on days 23 and 35. In addition all spectra display very broad emission lines, due to higher ionization stages at later times. With Chandra we observed apparent P Cygni profiles. We find that these peculiar profiles are not due to blue shifted absorption and red shifted emission in photoionized ejecta, like the optical P Cyg of novae, but they are rather a superposition of WD atmospheric absorption features reflected by the already discovered Thomson scattering corona, and emission lines due to collisional ionization in condensations in the ejecta. On days 23 and 35 the absorption components were no longer measurable, having lost the initial large blue shift that displaced them from the core of the broad emission lines. We interpret this as indication that mass loss ceased between day 18 and day 23. On day 35, the emission lines spectrum became very complex, with several different components. Model atmospheres indicate that the WD atmospheric temperature was about 730,000 K on day 18 and reached 900,000 K–one million K on day 35. This peak temperature is consistent with a WD mass of at least 1.3 M⊙.
keywords:
stars: novae, cataclysmic variables – stars: winds, outflows — stars: individual (U Scorpii) – white dwarfs – X-rays: binaries – X-rays: individual (U Scorpii)1 Introduction
The recurrent nova (RN) U Scorpii is one of a handful of such objects known in the Galaxy, although this class may be much more numerous than we have been able to assess so far. “Recurrent” means that the thermonuclear flash is repeated on a human timescale. The outburst supposedly recurs also in classical novae, however the time scales can be as long as several times 105 years on WD at the low end of the nova mass distribution (0.6-0.7 M⊙), accreting matter at a low rate of M⊙ year-1 (see Yaron et al. 2005 and references therein). The models predict that RN occur either with moderately high accretion rate on WD of about 1 M⊙, or at very high (M10-8 M⊙ year-1) on WD with M 1.2 M⊙. The velocity of the ejecta increases, and the duration of the outburst decreases, with the WD mass. About half of all RNe are symbiotic novae, that is systems with a giant secondary and a hot WD, with orbital periods of hundred of days (as opposed to most classical novae, which have orbital periods of hours and main sequence companions).
U Sco has an orbital period of 1.23 days and belongs to the class of RNe with a near-main sequence or moderately evolved secondary (Schaefer 1990, Schaefer & Ringwald 1995). The secondary spectrum is not detected in optical spectra at quiescence, but at a late post-outburst phase Anupama & Dewangan (2000) measured the spectral features of a K2 subgiant. In the previous outbursts the ejecta were extremely depleted in hydrogen (Barlow et al. 1981), so the secondary must have lost a significant fraction of its hydrogen rich envelope. At quiescence, He II lines are dominant in optical spectra and the hydrogen lines are absent or weak, a fact that has been interpreted as accretion of He rich material from a H-depleted secondary (e.g. Duerbeck et al. 1993). Although Maxwell et al. (2011) cast doubts on the high He abundance, the possibility of very enhanced helium in U Sco is very interesting as it may result in a type Ia SN (SN Ia) without a hydrogen rich envelope, which is consistent with the upper limits on hydrogen in the SNe Ia spectra.
The short and luminous outburst of U Sco was observed 10 times (1863, 1906, 1917, 1936, 1945, 1969, 1979, 1987, 1999, 2010), with peak magnitude V7.5, decay times by 2 and 3 optical magnitudes, t2=1.2 and t3=2.6 days respectively, and a return to quiescence within 67-68 days. These parameters indicate a very massive WD, such that sufficient pressure for a thermonuclear runaway is built up at the base of the envelope even with a small accreted envelope (e.g. few 10-7 M⊙, see Starrfield et al. 1988). We adopt 122 kpc as distance to the nova, measured thanks to its eclipse in the optical (Schaefer et al. 2010).
Since U Sco has shown outbursts on an almost regular timescale of 102 years (assuming a couple of eruptions were missed because they occurred when the nova was behind the sun), Schaefer (2010) was able to predict the last eruption of January of 2010 with an uncertainty of only one year. When the event occurred, a strategy was in place to observe the outburst at all wavelengths.
In this paper we present grating X-ray spectra, the only means to probe the effective gravity, chemical composition and effective temperature of the underlying white dwarf once the photosphere shrinks back to the WD radius (e.g. Nelson et al. 2008 and references therein). One observation was proposed by us, 17 days after the visual maximum with the Chandra LETG grating. We adopt here the epoch of the observed visual maximum 2010-01-28.1 (JD 2,455,225,605) as the initial time (although Schaefer, 2010, extrapolated the light curve concluding that the peak had occurred a few hours earlier). Two XMM-Newton observations were done on 2010-02-19 at 15:41:09 UT, and on 2010-03-14 at 14:33:32 UR, 22 and 35 days after maximum, respectively (note that for the different XMM-Newton detectors the beginning of the observations varies slightly, and for details see also Orio et al. 2011, Ness et al., 2011a and 2012).
In addition to presenting and analysing the early Chandra spectrum, in this paper we compare it with the XMM-Newton RGS grating spectra. The proposers of one of these observations, Ness et al. (2012) have analysed the X-rays and UV data and examine the time variability in these two bands in detail. They find that a partial eclipse of the X-ray continuum can be explained only if the hot central source is observed after having been Thomson scattered, a conclusion that we reached independently (Orio et al. 2011), and with which we fully agree. These authors remark about the lack of absorption lines, expected and usually observed in novae in outburst in X-rays, and attribute it to possible “smearing” by Thomson scattering. They also describe and examine the spectra, proposing lines identifications and attributing the emission lines to resonant scattering. In this work, we found that the nova development with time, including the XMM-Newton observations, is fundamental to fully understand the physics of the X-ray grating spectra. Without the intent to replicate Ness et al.’s (2012) work, we analyse and attempt to model with detailed physics all the grating X-ray spectra, thereby reaching different conclusions than the above authors on the origin of the emission lines observed with XMM-Newton and on the reason for the lack of absorption features at late stages.
In Section 2 we describe the observations, the data extraction method, and when the observations occurred in the context of the long term X-ray evolution. In Section 3 we show the short term light curve, which we find relevant to understand the physics of the spectra. In Section 4 we discuss the apparent P Cyg profiles observed in the Chandra spectrum. After having analysed the origin and meaning of these features, we performed atmospheric fitting for all spectra, and evaluated temperature evolution and peak temperature (Section 4). In Section 5 we discuss the physical mechanisms producing the emission lines and how we attempted a global fit; finally conclusions are presented in Section 6.
2 The observations, and their position in the long term light curve
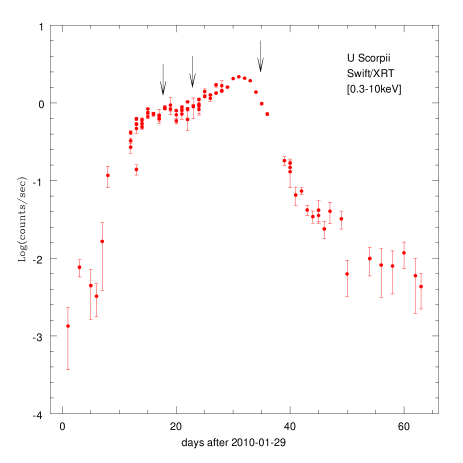
The Swift satellite monitored U Sco almost daily on all dates when it was technically possible. We extracted the Swift data and present the XRT X-ray light curve in Fig. 1. Although this paper’s focus is on the longer observations done with Chandra and the comparison with the RGS of XMM-Newton data, the Swift-XRT long term light curve puts the data in the context of the outburst evolution. The arrows indicate the times at which the grating observations were done. The X-ray flux was still on the rise during both the 2010-02 observations (days 18 and 23), while the maximum X-ray flux was recorded around the date of the third and final X-ray grating observation in March, on day 35. The X-ray spectrum remained remarkably soft during the whole post-outburst phase, with more than 95% of the counts below 0.7 keV. A sharp decay followed the March observation until day 67, when the nova was almost back to X-ray minimum. Further information on the UV and X-ray evolution observed with Swift can be found in Ness et al. (2012).
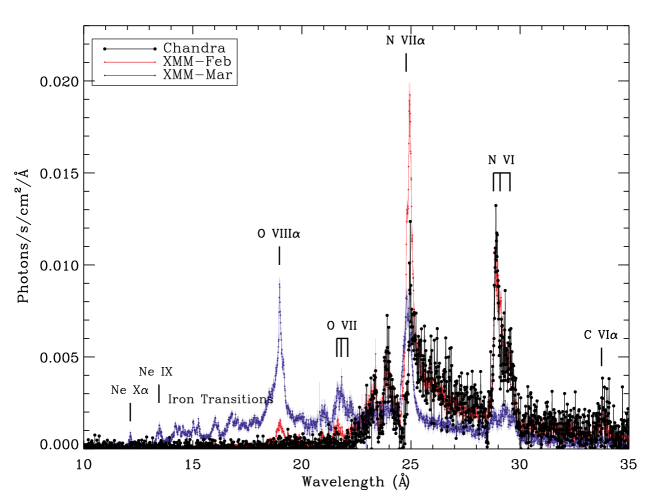
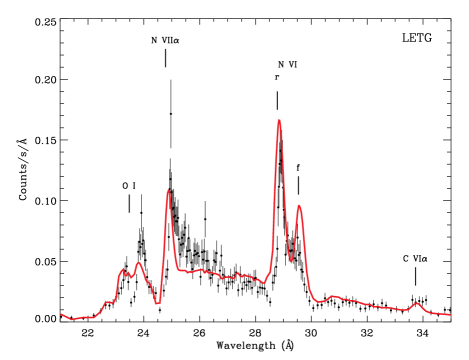
The first grating observation of U Sco was proposed by us and was done with the LETG/HRC-S instrument of the Chandra observatory on 2010-02-14, at 11:38:22 UT. As stated above, this was day 18 after optical maximum in the V band (see Schaefer et al. 2010). The exposures lasted for 23 ks (6.38 hours). The observed count rate spectrum is shown in Fig.2, while Fig. 3 shows the fluxed spectrum, compared with the spectra measured with the XMM-Newton RGS gratings on days 23 and 35. Fig. 2 also shows a model fit, discussed in detail in Sections 4 and 5. In order to extract the LETG spectrum, we applied the most updated calibration to the LETG pipeline processed level 2 event and pha Chandra data files. Response matrices and ancillary response (effective area) files were created using the tools mkgrmf and mkgarf, part of the CIAO v4.2 package. We measured a summed 1 orders count rate of 0.4770.008 cts s-1 in the 0.2-0.8 keV energy range in which flux is measurable above the background (corresponding to approximately 15-60 Å in wavelength range). We measured an unabsorbed flux 2.20.2 erg cm-2 s-1. In Fig. 3, the strongest lines of the three spectra are labelled (for additional lines identification, see Table 1).
We see in Fig. 2 that for at least three lines (the Ne VI He line with rest wavelength 23.77 Å, the N VII hydrogen line, with rest wavelength 24.78 Å, and the resonance line of the N VI triplet at 28.78 Å) the emission portion appears red-shifted and the absorption wing blue-shifted. This is intriguingly similar to the P Cyg profiles observed in optical spectra.
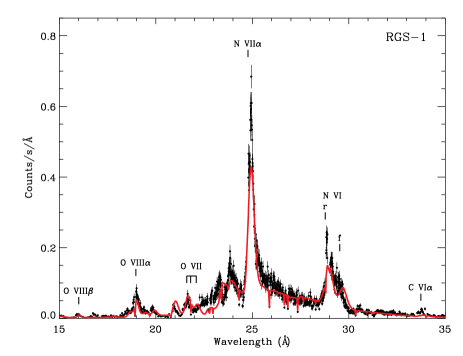
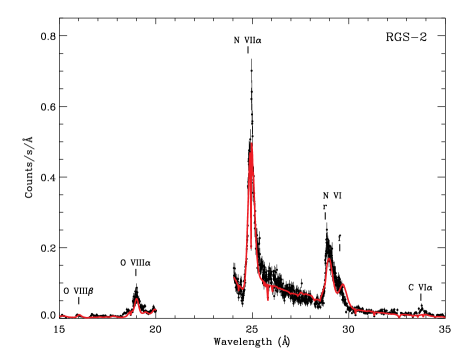
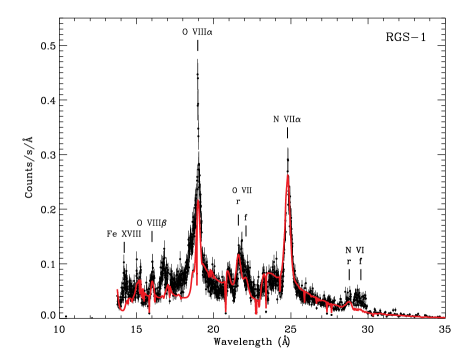
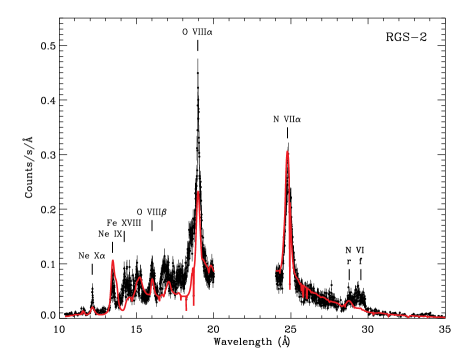
We compared the Chandra spectrum with archival XMM-Newton grating spectra obtained on 2010-02-19 at 15:41:09 UT and on 2010-03-3 at 14:33:32 UT, (5 and 17 days later, respectively days 23 and 35). The XMM-Newton spectra were extracted with XMM-SAS version 11.0.2. There was variability during both XMM-Newton observations, as we discuss in the next Section, but in February (day 23 after the outburst) we measured average count rates 0.8810.004 cts s-1 and 0.8240.004 cts s-1 with the RGS1 and RGS2 gratings respectively, while in March (day 35) the average count rates were 1.0370.005 cts s-1 and 0.9510.004 cts s-1. The unabsorbed flux seems was rising moderately, and we measured 2.50.2 and 2.60.2 in the second and third observation, respectively. All XMM-Newton instruments were observing the nova simultaneously, including the Optical Monitor (OM), and the broad band X-ray imagers EPIC-pn and MOS1 and MOS2. The RGS spectra are shown in Figures 3 to 5. Figures 4 and 5 present the count rate spectrum (like Fig. 2 for Chandra). The fit with atmospheric and plasma emission models, also shown in the Figures, are discussed in detail in Sections 4 and 5.
3 The short-term light curve: a simultaneous X-ray and optical eclipse
At optical wavelengths, the eclipse of the accretion disk by the K dwarf companion was discovered and measured at quiescence by Schaefer & Ringwald (1995), and it was observed again in the outburst by Schaefer et al. (2011), indicating that the accretion disk had already been reestablished by the third week after the optical maximum. The orbital period of U Sco is 1.23054695 days (Schaefer & Ringwald 1995). For the ephemeris we assume in this paper the result of the linear fit for the whole 1999-2010 inter-eruption interval, with a HJD time of the optical minima 2451234.5387 + N1.23054695. We caution that the many observed eclipses during the last four eruptions show significant deviations of the minimum from this ephemeris, with the offsets changing throughout the eclipse. This means that the center of optical light curve changes throughout the eruptions, and is not exactly at the same position during the quiescent periods.
We did not detect significant variability in the Chandra zero order light curve, but all the observation occurred outside the eclipse observed in optical. The exposure started at orbital phase 0.4463 and covered almost a quarter (22%) of the period.
| Chandra 02-14 | XMM 02-19 | XMM 03-05 | |||||
|---|---|---|---|---|---|---|---|
| line | (Å) | (Å) | flux | (Å) | flux | (Å) | flux |
| C VI Ly | 33.7342 | 33.780.02 | 0.39 | 33.780.05 | 0.43 | 33.750.05 | |
| N VI f | 29.5346 | 29.500.02 | 0.93 | 29.500.03 | 1.23 | 29.600.05 | 0.35 |
| N VI i | 29.0819 | 29.160.02 | 0.91 | 29.200.02 | 1.65 | 29.220.05 | 0.42 |
| N VI r | 28.7800 | 28.930.02 | 2.20 | 28.820.05 | 2.10 | 28.800.05 | 0.31 |
| C VI Ly | 26.990 | 26.800.02 | |||||
| N VI He | 24.90 | 3.8 | 24.950.01 | 1.3 | |||
| NVII Ly | 24.78 | 24.940.03 | 1.71 | 24.920.03 | 5.64 | 24.800.02 | 2.51 |
| N VI He | 23.771 | 23.810.05 | 0.43 | 23.810.05 | 0.60 | 23.820.02 | 2.70 |
| O VII f | 22.097 | 22.1080.050 | 22.130.05 | 0.30 | |||
| O VII i | 21.801 | 21.8070.020 | 0.24 | 21.800.02 | 0.49 | ||
| O VII r | 21.602 | 21.6030.050 | 0.35 | 21.610.02 | 0.39 | ||
| O VIII Ly | 18.969 | 19.050.03 | 0.74 | 19.000.02 | 3.21 | ||
| O VII He | 18.627 | 18.570.05 | 18.550.02 | ||||
| Fe XVII | 16.78 | 16.780.05 | 16.800.05 | ||||
| O VII Ly | 16.00 | 15.950.03 | 16.000.02 | 0.44 | |||
| Fe XVII | 15.262 | 15.300.05 | 15.250.05 | 0.10 | |||
| Fe XVII | 15.01 | 15.150.02 | 15.030.05 | 0.12 | |||
| Fe XVIII | 14.207 | 14.220.03 | 0.13 | ||||
| Fe XIX | 14.667 | 14.700.05 | 14.670.03 | ||||
| Ne IX f | 13.6984 | ||||||
| Ne IX i | 13.5503 | 13.570.05 | 0.12 | ||||
| Ne IX r | 13.4474 | 13.450.02 | 13.480.05 | 0.15 | |||
| Ne X | 12.1321 | 12.140.05 | 0.15 | ||||
| Ne IX He r | 11.55 | 11.600.10 | |||||
| Mg XI He r | 9.09 | 9.200.03 | 9.200.03 |
Both XMM-Newton observations covered about 60% of the orbital period and thus overlapped with the optical eclipse time. The day 23 observation started at phase 0.84, and the one of day 35 started at phase 0.55.
In Fig. 6 we present the XMM-Newton EPIC pn light curves and compare them with the optical light curves of Schaefer et al. (2010) measured in the same two weeks during which the two X-ray data sets were taken. All light curves are folded over the optically measured orbital phase and repeated twice. For the X-ray light curve, we plotted a quantity that is 2.5 times the logarithm of the X-ray flux normalized to its minimum vale, for a direct comparison with optical magnitudes. The EPIC-pn exposures are 63185 and 62318 seconds long respectively.
On day 23 in the X-ray light curve the most evident oscillation is a pronounced one with a semi-regular (albeit not regular) period of about 3 hours, extensively discussed by Ness et al. (2012). These authors also extracted the spectrum in and out of the oscillation, showing no variation of the emission lines. The authors attribute the phenomenon to large clumps, of absorbing material at a distance about 3.5 R⊙ from the WD, intersecting the line of sight in the direction of the accretion stream, during the process of re-establishment of the disk. We do not wish to further discuss these oscillations, although we suggest that this semi-regular period (even if it is associated with ejection of parcels of material), may represent the disk rotation period, which may be slightly variable while the disk is still being formed.
A clear orbital modulation in the day 35 spectrum was noted by us and by Ness et al. (2012). These authors also stress that almost all emission lines observed in the spectra are not eclipsed, while the continuum is, and we agree with their analysis. However, we cast some doubts regarding the dimming in eclipse of only one specific line, the O VIII Ly (the above authors remark this is the only line that seems to vary, even there is clearly no variation of the O VII triplet). Extracting the spectrum over the short duration of the eclipse we find a variation of this line only at the 2 level, so we suggest that this is not statistically significant. In any case, the main purpose of Fig. 6 is to show that the orbital modulation seems already clearly present in the XMM-Newton EPIC-pn light curve of day 23, although it is not as pronounced as on day 35. On day 35, the average count rate during orbital phases 0 to 0.12 and 0.88 to 1 is 0.75 and 0.84 cts s-1 with RGS1 and RGS2 respectively, while we measured 1.10 and 1.05 cts s-1 with RGS1 and RGS2 respectively during the rest of the observation. We find that the variation in count rate in and out of eclipse, outside the 3 hours oscillations, is by at least 25% even on day 23.


Because the eclipse takes out only about 50% of the flux in the X-ray continuum, on day 35 a large portion of this continuum must originate in a much more extended region. We assume that this is a Thomson scattering corona, re-processes a fraction of the WD radiation in an achromatic way (Ness et al. 2011a, 2012, Orio et al. 2011). The inclination angle in U Sco is 82.7 (Thoroughgood et al. 2001), so it is quite conceivable that we did not observe most of the WD flux directly. The accretion disk was placed by Schaefer et al. (2011) at 3.4 R⊙ distance from the WD in a light curve model for day 35. Because of the nearly edge-on inclination, the short-duration and deep X-ray eclipse does not appear to be due to the disk. We assume that the source of the continuum is eclipsed by the secondary, exactly like for the eclipse of the disk by the secondary observed at quiescence at optical wavelength. Following the reasoning of Schaefer et al. (2011, see their Fig. 13 for the optical eclipse) we conclude that most of the continuum is observed as reflected at a distance equal or larger than the a 3.4 R⊙ distance from the WD at which Schaefer et al. place the outer rim of the disk.
We intend to show that the Chandra spectrum with its absorption features is best explained assuming that this scattering corona was already present, and at comparable distance from the WD, on day 18, although no X-ray observations at eclipse minimum were done.
4 Fitting the spectrum, step by step: the WD
4.1 The absorption lines observed with Chandra
Two puzzles are immediately apparent when we examine Figures 2 to 5. First of all, the Chandra spectrum shows deep absorption features of nitrogen, while the XMM-Newton ones do not display any features in absorption. Although model atmospheres show that the absorption becomes less pronounced at high temperatures (Rauch et al. 2010), the models predict deep absorption features of nitrogen, always detected in the previous X-ray gratings’ observations of other novae (e.g. Rauch et al. 2010, Ness et al. 2011b). The other surprising element, as we already noted, are the apparent P Cyg-like profiles in the Chandra spectrum. P-Cyg profiles are typical of the optical spectrum of novae in X-rays, but they have never been observed in their X-ray grating spectra, except (possibly) in the first XMM-Newton spectrum of another fast recurrent nova, LMC 2009 (Orio 2012).
Emission lines attributed to the ejecta were observed in the X-rays spectra of several other novae (Drake et al. 2003, Ness et al. 2003, Nelson et al. 2008, Rauch et al. 2010). Are the absorption wings of these “P Cyg profiles” in this U Sco spectrum produced in the nova shell, instead of being due to the WD? At least one profile cannot be a P Cyg in the conventional sense, and it is the one of the N VI He line. The absorption in this case is not the same line, but it is mainly of another overlapping line at zero velocity, due to the OI 1s–2p transition at 23.476 Å, which does occurs in the ISM along the line of sight to U Sco. The fact that this absorption feature was hardly measurable in N LMC 2009, in one LETG spectrum that appears similar to this one (Orio et al. 2011, and 2012 article in preparation), confirms the identification because N LMC 2009 is in a direction of much lower interstellar absorption (N(H) cm-2). Thus, we realize that at least this particular P Cyg-like profile is in fact only a sort of “pseudo P Cyg”, composed of an absorption and an emission feature that do not have origin in the same medium.
We examine now the P Cyg profiles of the other two strong lines, shown in Fig. 7, to understand whether they may be due to the “real”, classic P Cyg phenomenon. As Fig. 7 shows in velocity space, the N VII emission appears blue-shifted by 2200200 km s-1 in absorption, and red-shifted by the same amount in emission. The N VI resonance line with rest wavelength 28.78 Å is instead blue-shifted by 2700300 km s-1, in absorption, and red-shifted by 1500300 km s-1 in emission, so the two components do not cross around zero, but rather towards the red. In optical spectra of novae, crossing in the red is observed in spectra taken shortly before the P Cyg profile disappears. Typically, the P Cyg profile is no longer observed in the following weeks because the blue-shifted absorption becomes negligible compared to the emission. Fig. 8 shows the same line profile in velocity space in the RGS spectra of days 23 and 35.
P Cyg profiles in X-ray spectra in general are rarely observed, and the absorption wing, if measurable, is very shallow. This is because in X-rays we are likely to observe outflows and nebulae around compact objects, while in optical we observe them around stars with at least hundred of times larger radii. This includes the optical (as opposed to X-rays) spectra of classical and recurrent novae, where P Cyg profiles at optical wavelengths are observed when the photosphere around the WD has not receded to WD dimensions yet, but is still of the order of at least a solar radius. However, this typically occurs weeks or months before the supersoft X-ray phase, and we expect it only in the first few days, or even in the first hours, in a very fast nova like U Sco. P Cyg profiles at optical wavelengths are due mainly to resonance transitions. The blue-shifted absorption is observable only where the material moves in our direction, that is along the line of sight of the photo-ionizing central object. The optical P Cyg absorption features occur, like the emission, in the “wind” or nebula around a photo-ionizing central object, but they are observed in a cylinder with the radius of the central object, and only as long as the radius of the cylinder is not negligible compared to the rest of the shell, from which we observe the emission lines.
Luminous supersoft X-ray continuum - observed in the Chandra spectrum as well as in the XMM-Newton ones - in novae arises when the central object has shrunk and regained compact dimensions, with a radius of the order of at most 109 cm, or else the X-ray luminosity would be largely super-Eddington. Shortly after the outburst, velocities up to 5000 km s-1 were measured by Yamanaka et al. (2010), and on day 35 (the day of the last XMM-Newton observation), Mason et al. (2012) estimated an expansion velocity of 4000 km s-1 from the full width at half maximum of the optical lines. Assuming this value for the expansion velocity, the nebular ejecta around U Sco at the time of the Chandra observation (day 18) had reached a distance from the WD representing almost 300,000 times the WD radius of a very massive WD (1.3 M⊙). The region in which emission occurred was overwhelmingly large in comparison with the cylinder around the line of sight towards the WD. We conclude that the absorption features observed with Chandra cannot have been produced in the ejecta. By day 18, any absorption features of the ejecta would already be hidden and embedded in the broad emission lines. There is no evidence of nebular X-rays absorption lines in the ejecta, but in other novae absorption lines were always observed, and they are usually attributed to the WD atmosphere. There is only a recent case in which the blue-shifted lines were attributed instead to collisional ionization in a thin outer shell, that of V2491 Cyg (Pinto et al. 2012), but the absorption lines of U Sco are so broad compared to this model, that we can rule out this origin.


We concluded that the velocity of the absorption features also for U Sco was due to a different phenomenon, one causing an intrinsic velocity that had an almost abrupt end, so that the features were still significantly blue shifted on day 18, but not any more a few days later. This process must be mass loss from the nova. Absorption lines in X-ray grating spectra of other novae in the early phases were significantly blue-shifted, with comparable blue shift to the apparent “absorption wing” of the “P Cyg” in the Chandra spectrum of U Sco (e.g. Ness et al. 2003 and Rauch et al. 2010 for V4743 Sgr, Ness et al. 2011b for V2491 Cyg). In RS Oph many of the same absorption lines as in the former two novae were observed without measurable blue-shift (Nelson et al. 2008). Since the emission lines were strong in a very different range, there was no overlap with WD lines and no apparent P-Cyg profile. We conclude that the P Cyg profiles in the Chandra spectrum were not “real P Cyg”, but they were rather due to superimposed absorption and emission arising in different regions and different mechanisms. The absorption features were produced in the outmost layer of the WD atmosphere, which was still loosing mass, and reflected at a distance of a few solar radii by the Thomson scattering corona of the WD. The corona’s “reflection” allowed the lines to be detectable, despite the high inclination angle of the WD in U Sco. Since this corona must have already been present on day 23, we assume that it existed already on day 18 (even if we could not measure a light curve to prove it).
An intrinsic blue-shift that lasted while the WD was still loosing material in a wind, explains why the features were still observable on day 18, even if the emission features are so broadened in U Sco that they should hide the atmospheric absorption. Once the wind from the WD ceased, the absorption lines velocity became close to zero, so they were embedded in the center of the emission lines and were not measurable any longer.
Whatever absorption features may have actually been produced in the ejecta by photo-ionization, if there was such a phenomenon, were embedded in the emission features long before day 18, due to the small dimensions of the absorption region compared to the fast ejecta. It is also conceivable that the Thomson scattering corona changed in geometry and the WD absorption lines may have become more smeared out between day 18 and 23, and perhaps better “hidden”. In any case the transition giving rise to absorption lines in the atmosphere, even when not observable and measurable, must have occurred until the WD turned off.
4.2 Atmospheric models: the hottest WD
Because of the conclusions above, in order to fit the Chandra spectrum, we assumed that the observed absorption components were not produced by photo-ionization of the ejecta like in the optical P Cyg profiles of novae, but that they originated inside the WD atmosphere, and were reflected at large distance (3 R⊙) by the Thomson scattering. We fitted only the continuum of the XMM-Newton spectrum. We assume that on day 23 and 25 the atmospheric absorption lines were simply unobservable, hidden by the unusually broad emission lines of this nova once the mass outflow, and with it the blue shift, ceased. Of course in the Chandra spectrum the observed absorption may have been more pronounced if it was not super-imposed on emission, so we can only obtain lower limits on the abundances and effective gravity.
Although the Chandra spectrum absorption features were eroded by the blue wing of the partially overlapping emission lines, we note that they were still remarkably close in depth and broadening to those observed in other novae without X-ray eclipses, such as V4743 Sgr (Rauch et al, 2010) and RS Oph (Nelson et al. 2008). We adopted the atmospheric models developed by coauthor Thomas Rauch, publicly available on the web site http://astro.uni-tuebingen.de/ rauch and developed for very hot white dwarfs, e.g. RS Oph (Nelson et al. 2008) and V4743 Sgr (Rauch et al. 2010). We fitted the spectra with XSPEC, v12.6, assuming that the absorption features were blue-shifted by 2000 km s-1 (as in Rauch et al. 2010). To date, Rauch’s models represent the best approximation to the atmosphere of a hydrogen burning white dwarf, although residual outflows that produce blue-shifted absorption are not accounted for in these static models. Models including elements with atomic number up to the one of oxygen are available for a grid of values of effective gravity, with a log(g) grid from 5 to 9 with 1 step increments. The most recent grid of models, including all elements up to magnesium, was calculated for the hottest white dwarfs, with temperatures above 500,000 K and is suitable for the hot continuum of the U Sco spectra. Since above 500,000 K, the WD must be very compact. and the luminosity would become largely super-Eddington with log(g)9, are published only for log(g)=9.


Model 201 in Rauch’s web page was developed specifically with similar abundances to the ejecta of U Sco measured using the optical spectra in the previous outbursts: depleted hydrogen ([He]=0.489 or a helium mass fraction of 70%, and almost 50 times enhanced nitrogen with respect to the solar value ([N]=1.668). We fitted models of this grid with XSPEC, after blue-shifting the absorption features by 2000 km s-1. We do not obtain the best fit with model 201, but rather with model 003, with [He]=0.382 and [N]=1.803. This is not surprising, because the abundances in the burning layer can be quite different from those of the ejecta, where mixing with unburned material has occurred.
The final product in our fit, shown in Fig. 2 for the Chandra LETG, is a composite model of WD atmosphere and superimposed emission lines, but for the Chandra spectrum we started by performing an experiment, ignoring the channels containing the strong emission lines (24.8–25.6 Å for N VII Ly , and 28.7–30.0 Å for the N VI triplet), so that the model fit was better constrained by the continuum and by the absorption features. For the composite fits plotted in blue in Figures 2, 4 and 5 we binned the data with 30 to 50 counts per bin, but for the initial experiment, in order to retain the high spectral resolution of the LETG, we binned the data only by a factor of 4 resulting in wavelength bins of 0.01 Å. With a low resulting number of counts in each bin, we used the C-statistic (Cash, 1979) rather than the more commonly used statistic. We found that the C parameter is smallest for the smallest C/N ratio (typical of CNO ashes), and steadily increases as the C/N ratio increases. The decrease of the “C” parameter with C/N ratio is about 20% from model 011 to model 003 of Rauch’s grid. All models with solar abundances yield poor fits to the Chandra LETG spectrum. The temperature for the “truncated-emission” spectrum in the 2 confidence range ( 2) is 650,000-750,000 K. The best fit yielded a temperature of 730,000 K, N(H)=2.5 1021 cm-2, and an absorbed flux 1.64 10-11 erg cm-2 s-1, corresponding to an unabsorbed flux 4.2 10-10 erg cm-2 s-1. The bolometric luminosity of the WD in this model is 7.2 10(d/12 kpc)2.
We fitted also the spectra observed later with XMM-Newton, although there are no absorption features to better constrain the temperature range. The fit returns almost the same temperature for day 18 and 23. In the spectrum of day 35 the fit yields instead a higher temperature, in the range 900,000 to 1,100,000 K, and is unvaried if we add the emission component, discussed in Section 5. The WD temperature at maximum X-ray luminosity is tightly correlated with WD mass. We know from the models that the effective temperature exceeds 900,000 K only for WD mass around 1.3 M⊙ (Yaron et al. 2006).
The models yield an absorbed WD luminosity around 7 1036, which at 12 kpc distance is a factor of 5-10 smaller than the luminosity so far measured in other WD with even lower peak temperature (e.g. Balman et al. 1998, Orio et al. 2003a, Nelson et al. 2008). For the other novae, the WD luminosity at peak was several times 1037 erg s-1. We explain also this puzzle, like the one posed by the apparent P Cyg profiles, if we assume U Sco we did not observe the WD directly. The reprocessing factor for the WD radiation must have been of the order of 10%.
We note that after the previous outburst in 1999, Kahabka et al. (1999), fitted the BeppoSAX low resolution, low S/N LECS spectrum with a WD atmospheric model. They derived a luminosity in the range 2.7 to 18 1037 d2/12 kpc) 19-20 days after the optical maximum, and an effective temperature of 75 eV (870,000 K). The count rate was however only 0.06 cts s-1, a value that appears too low by a factor of about 2 if translated into both the Chandra or XMM Newton count rates with PIMMS for a blackbody at 75 eV and N(H)=2.5 cm-2. The BeppoSAX observation lasted for about 14 hours, so the low count rate is not explained with orbital variability. We cannot reconcile it with the lower luminosity of the present WD component. Probably the atmospheric model had significant differences from the most recent and detailed models of Rauch, but we also cannot rule out that the fit was correct, and the Thomson scattering corona may have been very different, or not present, in the previous outburst.
5 The origin of the emission lines: shocks, condensations and an evolving violent medium
In the Chandra spectrum 20% of the flux was in the emission features, and in the RGS spectra about 30 %, while the remaining flux was due to the continuum. Despite small uncertainties in the relative calibration of the Chandra and XMM-Newton instruments, as we see in Fig. 3, the spectra are remarkably similar on days 18 and 23. However, two striking changes happened: the absorption features seem to have disappeared except for O I at 23.476 Å, which we identified as interstellar in origin, and oxygen emission lines suddenly appeared. The O VIII line, which is not measurable in absorption in the WD atmosphere on day 18 but is clearly detected in emission with XMM-Newton on day 23, was almost symmetric around zero velocity since it appeared, consistently with no erosion by a nearby blue-shifted absorption line. This does not imply that the line did not exist at all in the WD atmosphere, because the level of the WD continuum in that energy range is too low to measure absorption (see Rauch et al., 2010)
In emission, the full width at half maximum of this line is approximately 4000 km s-1, consistently with the velocity measured in the optical spectra of Mason et al. (2012). As can be seen comparing Fig. 7 with Fig. 8, the emission features in the third spectrum appear symmetrical around the rest wavelength of the line, and have an almost triangular shape, indicating that lines are produced in an optically thin expanding medium. In contrast, the profiles of the emission lines in the optical spectra of novae after the P Cyg profiles have disappeared usually appear flat-topped, indicating that the expanding medium is optically thick.
We measured the emission line fluxes by fitting the strongest lines with Gaussian profiles, and we attempted a fit to a few weak lines with triangles. The photon flux is given for each line in the three spectra in Table 1. We estimate that our measurements are accurate to within 10% for isolated lines and flux above approximately 0.4 10-4 photons cm-2 ks-1 (which were fitted with a Gaussian). The accuracy is probably not more than 25% below this value (where we fitted a few lines with a triangle, especially for the day 35 spectrum). We did not attempt to measure line fluxes below 0.12 photons cm-2 ks-1, because the uncertainty seems very large below this value, but in some cases we can still identify lines with probably almost an order of magnitude lower flux (e.g. Mg XI in the last spectrum).
The emission lines, much less strong in this wavelength range in other novae, in the U Sco spectra are very pronounced and broad (compared with thermal and instrumental broadening, see e.g. Brinkman et al. 2000, Ness et al. 2003). We attribute the line broadening to the expansion velocity of the nova shell, like the broadening often observed in the optical spectra. The recurrent novae LMC 2009 (Orio et al. 2011) and T Pyx (Tofflemire et al. 2012) have been the only other ones with broad emission features. We also note that the carbon lines are much weaker than those of nitrogen. Only the C VI Ly line in emission at 33.900.12 Å (rest wavelength 33.7342 Å) is clearly detected.
5.1 A comprehensive spectral fit: days 18 and 23
In Fig. 2, 4 and 5 we plotted in red the fit to the lines and continuum obtained with physical models. These models can be regarded as a sort of first order approximation to the correct model, to explore the relevant physical mechanisms in these spectra. We have not reached a perfect fit, as the value of the reduced in these fits varies from 2.7 (Fig. 2) to 4 (Fig. 5). Rather than obtaining a statistically significant fit, we focused on a good qualitative agreement and on reproducing the emission line ratios as well as possible. We think that, as novae observations are continued in the next few years, we should be able to gather many more details of the nova physics, that will allow to fine tune these models of the very complex phenomena occurring in novae WD atmospheres and in their ejected shells.
On days 18 and 23, the relative line strength, combined with the lack of a broad radiative recombination RRC feature of N VI at 22.5 Å, which should be clearly present in the case of photoionization (e.g. X-ray spectra of planetary nebulae or some AGN, see Fig. 5 of Kinkhabwala et al., 2002), indicate that the transitions are due to collisional ionization. We used the XSPEC package, v12.6, adding to the atmospheric model of the previous Section and a component of collisional ionization, namely the BVAPEC model, that allows to include velocity broadening (1 value, which corresponds to the half width at half maximum of the lines). Table 2 gives relevant parameters of the spectral fits shown in the Figures. We assumed that helium in the plasma component is enhanced 10 times with respect to solar values. In order to improve the fit to the emission lines, we need a large overabundance of nitrogen not only in the also in the BVAPEC component, at least 10 times the solar value, and even up to 70 times like in the fit we show in Fig. 2 for the Chandra spectrum (this is the best fit with only two components, although we obtained sightly worse, but similar fits with an enhancement by a factor of 10 and a slightly different set of parameters). We note that the WD unabsorbed luminosity resulting from these fits is reduced by up to 30% with respect to the values contained in the “experiment” in Section 4.1, in which we fitted only the continuum, cutting the prominent emission features.
Figures 2 and 4 show that we can reproduce the relative strength of most lines by assuming collisional ionization lines with the Table 2 models for days 18 and 23. However, the BVAPEC collisional ionization model in XSPEC assumes a low density limit and does not predict that the forbidden line is quenched compared to the intercombination line. We see in Figures 2 and 4 that the N VI 29.5446 forbidden line ii the N VI triplet on days 18 and 23, and the O VII 22.097 line at day 23 are less strong than in the models shown in the Figures.
We attribute this phenomenon to line formation in a zone of such high density that the collisional de-excitation rates are close to the radiative decay rates. When the two rates are comparable, the radiative decay fraction from an excited level are reduced and so the emission becomes weaker. The electron density ne at which the N VII forbidden line is de-excited is a few times 109 cm-3 (Ness et al. 2001, Chen et al. 2004). This density is not unheard of for novae shells in the first few weeks after the outburst. ne of order of 1012 cm-3 was derived by Neff et al. (1978) from the analysis of the optical spectra of V1500 Cyg.
This high density is higher than the value derived from the emission measure in the fit in Table 2, ne = a few 107 with the assumptions of the model, if the ejected shell volume is uniformly filled. Since estimates of the ejecta mass of U Sco converge vary from a few M⊙ to a few M⊙ (see Schaefer 2011, Starrfield et al. 1988), assuming uniform filling of the shell, we expect that ne does not exceed a few times 105 at day 18, and it should be decreasing as the ejecta expand. This discrepancy implies an emitting volume of the order of only the volume of the shell. The explanation seems to be that line emission occurs in dense condensations. We note that the large clumps that explain the light curve 3 hours period in the Ness et al. (2012) model occupy a much smaller fraction of the shell volume corresponding to only a few 10-9. Clumpiness is not completely unexpected, and it has often been invoked to explain novae optical spectra, starting with the pioneering work of Gallagher & Anderson (1976). Interestingly, already in 1992 Lloyd et al. discussed how the X-ray emission from a nova shell, albeit observed only with a broad band instrument (ROSAT), implies compact clumps in the ejecta as emitting regions.
In our spectral fits, whose parameters are given in Table 2, the appearance of oxygen lines on day 23 depends on the interplay of plasma temperature and emission measure. Increasing the plasma temperature by only 30%, or increasing the emitting volume by a factor of a few (assuming for instance that additional mass is being ejected) the oxygen lines are predicted, but then it becomes difficult to reproduce the other lines, correctly modeled only with a plasma temperature in the 100-120 eV range. The strength of the O VIII Ly feature is much stronger than all the lines of the O VII He-like triplet, indicating an overlapping component at higher temperature. In conclusion, in order to reproduce both the soft and hard portion of the spectrum, we need at least two components at different temperatures. An additional component at 180 eV reproduces the relative strength of the oxygen features. The component that explains the nitrogen lines, at 120-130 eV, fails instead to reproduce the “harder” lines. It is thus likely that on day 23 the condensations in which emission lines originated were not at uniform temperature.
| Parameter | 2010-02-14 | 2010-02-22 | 2010-03-05 |
| N(H) (1021 cm-2) | 2 | 2.7/2.2/2 | 2.4 |
| TWD (K) | 739,000 | 727,000 | 1,050,000 |
| FWD (erg cm-2 s) | 1.79 | 1.33 | 1.77 |
| FWD (unabs.) (erg cm-2 s) | 3.94 | 3.9 | 3.6 |
| Tp,1 (eV) | 93 | 130 | 223 |
| Tp,2 (eV) | 182 | ||
| Em. measure 1.72 1057 cm3 | 12 | 32/3 | 20 |
| N/H | 70 | 20 | 20 |
| v (1, in km s-1) | 1500 | 1680/1350 | 1800 |
| Ftot (erg cm-2 s) | 2.40 | 2.46 | 2.57 |
| Ftot (unabs.) (erg cm-2 s) | 4.9 | 4.9 | 4.22 |
5.2 A complicated structure on day 35
We are able to understand the emission line spectra of days 18 and 28 with collisional ionization alone, making the assumptions of clumpiness, and adding a second temperature component on day 23, with only 10% of the emission measure of the cooler plasma, and larger oxygen abundance ([O/H]=1.56 versus only 0.2 in the cooler emitting region). This model thus would also imply either inhomogeneous mixing of the elements in the ejecta, or emission of two shells with different abundances. We fitted less accurately the spectrum of day 35, which appears more complex. The emission lines on day 35 remained at least as broad as in the Chandra observation of days 18 and 23, while harder flux progressively emerged and lines due to higher ionization stages gradually appeared. However, the spectrum became also more complex and seemed to indicate several different components. The emission lines in Fig. 5 are the same as those of the permanent supersoft X-ray source Cal 87 (see Orio et al. 2004), but the lines were much broader in U Sco.
As shown in the compared fluxed spectra in Fig. 3, on day 35 N VI became much weaker. Fig. 3 also shows that in N VI He-like triplet and in the O VII triplet at day 35 there is also a definite shift in the relative resonance, forbidden and intercombination line strengths since the February observations. In the February spectra, the resonance line is dominant, but on the day 35, this was still true only for the newly appeared Ne IX triplet, while the resonance lines of the O VII and N VI triplets are weak. For the oxygen triplet, the intercombination line is clearly the strongest.
The line ratios did not became typical of “simple” photoionization, but we suggest they are explained with photoionization in the presence of an additional strong UV source, which causes the strong intercombination line and weak forbidden line (see Behar et al. 2004). While the unperturbed value (low density, no UV additional source) of the f/i ratio is 4.4, a much lower ratio like in our case indicates a nearby source of UV flux transferring flux from the forbidden to the intercombination line (Gabriel & Jordan 1969). Since these lines are not eclipsed, we cannot conclude that they were produced close to the WD, so at day 35 at least some of the emission lines were due to photoionization, with a strong, additional UV flux from a nearby region. We hypothesize that this UV flux originated in hot condensations of shocked ejecta.
We also identify iron lines that cannot be explained in the context of either collisional ionization or photo-ionization, no matter how high the iron abundance. These features are Fe XVII at 16.78 Å (already marginally detected on day 23), Fe XVIII at 14.207 Å, and Fe XIX at 14.667 Å. We note that these lines are very typical of quiescent, accreting CV’s and have been observed also in in quiescent novae (Mukai et al. 2003, Mukai & Orio 2005). Mason et al. (2012) attribute also some specific emission features in optical spectra of U Sco on the very same day, to additional emission from the accretion disk. We hypothesize that also these iron lines, never detected before in previous nova outbursts, arise in an accretion flow. It is significant they were observed in U Sco, which we know to have resumed accretion early during the outburst, and not in other erupting novae.
Finally, we mention two unsolved problems. Going back to the Chandra spectrum of day 18 we see at least one unidentified lines at 26.2 Å and possibly one or two at 26.7 and 26.9 Å. These lines are measured with low S/N, but since they were marginally detected also in RS Oph (see Ness et al. 2011b, Table 5), they are likely to be real. The second puzzle concerns the N VII Ly line, which merges with the weaker N VI He line. On day 35, this appears to be a broader and more structured complex than all others. It is certainly much broader than all other lines, and we can only speculate that this line may be produced in several different layers of ejecta with different velocity.
6 Conclusions
We concluded that the absorption features observed with Chandra arose in the WD atmosphere, and the velocity dropped close to zero at the base of the WD atmosphere in the following days, so that the absorption lines were hidden almost at the center of the broad emission features in the spectra taken with the XMM-Newton RGS on days 23 and 35. Fig. 7 shows in fact how the apparent red emission wings of the N VII and N VI lines receded towards zero velocity, as their profile gradually became symmetric (Fig. 8). The profiles of emission lines that do not have corresponding strong WD atmospheric absorption features, in stark contrast with the N VI and VII features shown in Fig. 7, were almost symmetric around the rest wavelength from the beginning.
From these observations, we inferred that the nova wind almost completely ceased between day 18 and 23 after the optical maximum. No other recurrent or classical nova has been known to have such a short mass loss period, but also the short optical light curve decay time and the large velocity measured in optical spectra were extreme for U Sco.
We agree with previous interpretations of the X-tray eclipse observed on day 23 and 35. It must be due to a Thomson scattering corona, and we propose that the eclipses, although not occurring during the exposures, already existed on day 18. Because of the inclination angle of U Scorpii, we did not observe the hot WD directly, but we mostly measured the flux from Thomson scattered radiation, which conserves the WD spectral shape and features, but gives a lower limit on the true WD luminosity.
Atmospheric models indicate that the WD was already extremely hot on day 18 and reached almost 1 million K on day 35. This high temperature is expected only on WD with mass close to the Chandrasekhar limit, above 1.3 M⊙.
We find that collisional ionization explains the X-ray emission lines observed in the February 2010 spectra of days 18 and 23. This conclusion is unexpected for a nova without copious circumstellar material around the system. In RS Oph, the red giant wind has left so much dense material, that violent shocks can be expected (O’Brien & Lloyd 1994, Nelson et al. 2008). In U Sco the emission line spectrum is in the very soft energy range, unlike in RS Oph. In any case, the only conclusions we can draw from the X-ray spectral diagnostics are that mass loss was not a smooth process. Faster material probably collided with slower one emitted just a few days earlier, and the ejecta had condensations or clumps of dense material that emitted the accretion lines. This may indicate also non isotropic outflows, or even small clumps like in the old shell of T Pyxidis (Schaefer et al. 2010).
The line ratios and the absence of radiative recombination continua rule out photo-ionization at least in February, but it seems clear that mass loss in this nova was not a smooth, continuous phenomenon. A description of the nova in terms of a steady radiation wind (see e.g. Hachisu & Kato 2010 and references therein) probably describes only slow novae accurately, while in cases of fast and frequent outbursts the physics of the mass outflow seems to become quite complicated.
On day 35, after mass loss from the system had ended, the emission lines spectrum became more complex. We identified different components, including collisional ionization, photoionization in presence of an additional UV source, and emission lines of iron, associated with the resumed accretion and probably not with the ejecta. We have not been able to fit all the spectral characteristics of the three spectra accurately, but we propose a sort of “zero order model”, making a first step in the direction of physical understanding. We examined and analysed in this paper the complexity and non homogeneity of a nova shell and its evolution.
X-ray grating observations of novae are precious not only because they allow to probe the WD peak temperature, temperature evolution and effective gravity, but also because of what we can learn on the mass outflow itself. It seems that there is still much work ahead of us - both modelling and observing new outbursts - in order to describe the nova physics accurately. Novae are such interesting laboratories of extreme physics, that we think they are worth the effort.
References
- [anu] Anupama, G.C., & Dewangan, G.C. 2000, AJ, 119, 1359
- [bal] Balman, S. Krautter,, J., & Ögelman, H. 1998, ApJ, 499, 345
- [bar] Barlow, M.J., et al. 1981, MNRAS, 195, 61
- [beh] Behar, E., et al. 2004, ApJ, 612, L65
- [] Brinkman A.C., et al. 2000, ApJ, 530, L111
- [] Cash, W. 1979, ApJ, 228, 939
- [] Chen, H., et al. 2004, ApJ, 611, 298
- [diaz] Diaz, M.P., Williams, R. E., Luna, G. J., & Takeda, L. 2010, ApJ, 140, 1860
- [] Gabriel, A.H., & Jordan, C. 1969, MNRAS, 145, 241
- [gal] Gallagher, J. S., & Anderson, C.M. 1976, ApJ, 203, 625
- [gc] Greiner, J., Di Stefano, R.; Kong, A.; Primini, F. 2003, RMXAA, 610, 261
- [] Hachisu, I., & Kato, M 2010, ApJ, 709, 680
- [] Kahabka, P., Hartmann, H.W., Parmar, A.N., & Neguerela, I. 1999, A&A, 347, L43
- [] Kinkhabwala, A., et al. 20002, ApJ, 575, 732
- [] Lloyd, H.M., et al. 1992, Nature, 350, 222
- [] Mason, E., Ederoclite, A., Williams, R.E., Della Valle, M., & Setiawan, J. 2012, A&A, 544, 149
- [] Maxwell, O., et al. 2011, MNRAS, 419, 1465
- [Mu] Mukai, K., Kinkhabwala, A., Peterson, J.R., Kahn,S.M., Paerels, F. 2003, ApJ, 582, 184
- [tn] Nelson T., et al. 2008, ApJ, 673, 1067
- [nf] Neff, J.S., Smith, V.V., & Katelsen, D.A. 1978, ApJSS, 38, 98
- [] Ness, J.-U., et al. 2001, A&A, 367, 282
- [] Ness, J.-U., et al. 2011a, see web site “The X-ray Universe 2011, Presentations of a Conference held in Berlin, 27-30 June 2011”
- [] Ness, J.-U., et al. 2011b, ApJ, 733, 70
- [] Ness, J.-U., et al 2012, ApJ, 745, 43
- [] O’Brien, T.J., & Lloyd, H.M. 1994, MNRAS, 271, 155
- [] Orio, M. Hartmann, W., Still, M., Greiner, J. 2003, ApJ, 594, 435
- [] Orio, M. 2011, HEAD 12, 11.06
- [] Orio, M. 2012, in Binary Paths to Supernovae Tipe Ia Explosions”, R. Di Stefano, M. Moe and M. Orio eds, CUP, in press
- [O03] Orio, M.; Ebisawa, K., Heise, J., Hartmann, J. 2004, RMXAA, 610, 194
- [] Ness, J-U., Brickhouse, N.S., Drake, J.J., & Huenemoerder, D.P. 2003, ApJ, 598, 1289
- [] Pinto, C., et al. 2012, A&A, 543, 134
- [004] Prialnik, D. 1986, ApJ, 310, 222
- [R10] Rauch, T., Orio, M., Gonzales-Riestra, R., Nelson, T., Still, M., Werner, K., Wilms, J. 2010, ApJ, 717, 363
- [] Schaefer, B.E. 1990, ApJ 355. L39
- [Sc05] Schaefer, B. E. 2005, ApJ, 621, L53
- [Sc-a-2011] Schaefer, B.E. 2011, ApJ, 742, 112
- [Sc95] Schaefer, B. E. & Ringwald, F. A. 1995, ApJ, 447, L45
- [Sch10] Schaefer, B., et al. 2010, AJ, 140, 925
- [Sch10] Schaefer, B., et al. 2011, ApJ, 472, 113
- [S89] Starrfield, S., Sparks, W. M., Shaviv, G. 1988, ApJ, 325, L35
- [Th] Thoroughgood, T.D., et al. 2001, MNRAS, 327, 1323
- [] Tofflemire, B., Orio, M. et al. 2012, preprint
- [Y] Yamanaka, M., et al. 2010, PASJ, 62, L37
- [Y05] Yaron, O., Prialnik, D., Shara, M.M., Kovetz, A. 2005, ApJ, 623, 398