Localized Algorithm of Community Detection on Large-Scale Decentralized Social Networks
Abstract
Despite the overwhelming success of the existing Social Networking Services (SNS), their centralized ownership and control have led to serious concerns in user privacy, censorship vulnerability and operational robustness of these services. To overcome these limitations, Distributed Social Networks (DSN) have recently been proposed and implemented. Under these new DSN architectures, no single party possesses the full knowledge of the entire social network. While this approach solves the above problems, the lack of global knowledge for the DSN nodes makes it much more challenging to support some common but critical SNS services like friends discovery and community detection. In this paper, we tackle the problem of community detection for a given user under the constraint of limited local topology information as imposed by common DSN architectures. By considering the Personalized Page Rank (PPR) approach as an ink spilling process, we justify its applicability for decentralized community detection using limited local topology information. Our proposed PPR-based solution has a wide range of applications such as friends recommendation, targeted advertisement, automated social relationship labeling and sybil defense. Using data collected from a large-scale SNS in practice, we demonstrate our adapted version of PPR can significantly outperform the basic PR as well as two other commonly used heuristics. The inclusion of a few manually labeled friends in the Escape Vector (EV) can boost the performance considerably (64.97% relative improvement in terms of Area Under the ROC Curve (AUC)).
I Introduction
In the past few years, large-scale Social Networking Services (SNS) such as Facebook, Twitter and Renren have become a major part of people’s daily life. Besides serving as a communication and information-sharing platform for their users, these Online Social Networks (OSN) also play a key role in friends discovery and community formation for users of common interests. Despite the overwhelming success of the existing SNS, the centralized ownership and control of these services have led to serious concerns in user privacy, censorship and operational robustness. Since the operator of an SNS has full knowledge of the profiles, social relationships and communication activities of their users, it is a high-value and obvious target for not only the typical attackers but also many totalitarian regimes which constantly seek to monitor and control information dissemination among their people.
To overcome the drawbacks of centralized OSNs, Decentralized Social Networks (DSN) such as Diaspora[25], Musubi[9] and OneSocialWeb[26] have recently been proposed and implemented. Under these DSN architectures, no single party possesses the full knowledge of the entire social network. For example, in the Diaspora network, a server (super-node) only has its own partial view of those users registered within it. It is even more restrictive in the Musubi network in which every user only has visibility of his/her own relationships in form of a contact book; even if a user can consult his direct friends for their friend lists, his knowledge of the network is still constrained to 2 hops. Current efforts of Decentralized Social Network (DSN) are mainly on system prototyping. Although the design of many building blocks for DSN can be adapted from prior P2P system designs, the nature of DSN imposes further challenges: Due to privacy and trust concern, available information for a single node is limited. For example, in a BT swarm, nodes are willing to exchange content with complete strangers as long as they provide each other enough upload rate. In DSN, however, people only want to share contents (profile, status, blog, album, etc) within certain scope.
While the compartmentalized approach of the DSNs can enhance user privacy and make them less vulnerable to monitoring, censorship and sabotage attacks, the lack of global knowledge for the DSN nodes makes it much more difficult to support some common but critical services such as friend discovery/ recommendations and community detection. In particular, the DSN architecture invalidates many assumptions on data availability and global network topology awareness which are required by most existing community detection algorithms.
To address this challenge, this paper considers the following problem for the DSN s: Given a user and his/her partial knowledge of the social graph, can we predict which nodes are in the same community with him? The solution of this problem can support many fundamental services of DSN including friends recommendation, targeted advertisement, automated relationship labeling and sybil defense. In particular, we will focus on the design and performance evaluation of localized and fully-decentralized community detection algorithms for large-scale DSN s based on the Personalized Page Rank (PPR) approach:
-
•
By “localized”, we mean that every node’s knowledge of the network is limited to its local neighborhood topology 111While it has been shown that one can substantially improve community detection performance by incorporating information beyond mere topological data [29, 21], as an initial study of community detection on DSN, we consider only the topological data of the network for now.. This is in contrast to other so-called localized approaches, e.g. the local graph partitioning algorithm in [4], for which global network topology is actually available even though the algorithm may choose not to fully explore or leverage such information.
-
•
By “fully-decentralized”, we mean that every individual node within the DSN can execute our proposed community detection algorithm based on its locally acquired knowledge. Explicit coordination from other nodes is not needed. In contrast, many existing “distributed community detection” algorithms, e.g. those proposed in [13] and [28], do require exchange of information and collaboration among the network nodes.
-
•
By “large-scale”, we mean that our algorithm is designed to be scalable for DSNs of sizes comparable to the existing top-tier OSNs. In fact, we evaluate our proposed algorithm in Section V-A using real data collected from the Renren social network in China (which already had 160 million registered users by 2011[36]). More importantly, even if we only consider the 2-hop local neighborhood of a target Renren user, the size of the topological data is already very substantial: on average, each user has around 350 direct friends and 75,000 friends-of-friends. In fact, the size of the local topology of a single target user in our study is already as large as many medium-sized data sets used for evaluating many global community detection algorithms reported in the literature.
In short, this paper has made the following technical contributions:
-
•
We formulate the new problem of community detection under the constraint of limited local topology awareness found in DSNs.
-
•
We adapt the Personalized Page Rank (Personalized PageRank (PPR)) algorithm for community detection under limited topology information. In particular, by interpreting PPR as an ink spilling process, we justify its applicability for community detection for a target user.
-
•
We investigate different design choices of the Escape Vector (EV) for PPR. Their impact on community detection performance are evaluated using real-world data sets collected from the large-scale Renren social network.
The rest of the paper is organized as follows. In Section II, we survey related works. In Section III, we formulate the community detection problem on 2-hop-only topology of the social network graph. In Section IV, we analyze the problem and propose our algorithm based on the PPR approach. In Section V, we evaluate the performance of our PPR proposal by comparing it with other commonly-deployed heuristics, and study the effect of different choices of PPR Escape Vectors in depth. We then conclude the this paper in Section VII.
II Related Work
II-A Community Detection Algorithms
Community detection is a classical problem of partitioning a graph into multiple (possibly overlapping) subsets (communities) while satisfying the following conditions: intra-community linkage is dense and inter-community linkage is sparse. In the literature, this principle has been realized in many different ways including Modularity maximization, Conductance minimization and Normalized Cut minimization [2]. So far, Modularity maximization [23] has been the most popular approach for community detection. However, since the resultant combinatorial optimization problem is NP-Hard, researchers have proposed many heuristics to obtain approximate solutions. Newman [24] proposed an eigen decomposition approach plus a local search algorithm. Agarwal [1] leveraged several mathematical programing techniques. Those works are the first batch that focus on detecting community based on only full topology information.
Since pure topology-based community detection algorithms are well developed by now, many researchers are trying to incorporate more side information to enhance performance of existing algorithms. In [29], Sachan et al combine social graph topology, interaction pattern, and topics to discover topically meaningful communities. In [21], Lin studies the scenario where node-level information is complete (like authors’ bag-of-words coordinates) but only part of the topology is observed. Note however that complete node-level information is still too hard to be acquired in the DSN scenario.
All of the above community detection algorithms are centralized ones requiring global information. Besides the data constraint, those global algorithms are usually computational intensive, which makes them inapplicable for large-scale OSNs. As such, our study of scalable and localized algorithms is important even under the centralized OSN settings.
It is worth to note that researchers have proposed some algorithms to tackle with large-scale graphs in centralized settings. [27] proposed a Label Propagation (LP) algorithm whose complexity for one iteration is linear of number of edges. LP initializes nodes with their unique labels and nodes switch to the majority label owned by their neighbours at each iteration. [19] conducted more experiments on the LP algorithm and proposed several improvements. Since our algorithm only requires local topology of each node, it is easy to be parallelized and scale to large graphs naturally under the centralized settings. We leave the combination of multiple runs of our localized algorithm to form a global community to future work.
II-B Friend Recommendation Systems in Practice
We mentioned several applications of community detection algorithms on DSN in Section I. In the literature, Friend Recommendation is also associated with the problem of link prediction[20]. Although many sophisticated algorithms have been developed, they also suffer from their forbidding computational requirement like global community detection algorithms do. For large-scale OSN in practice, simple heuristics are believed to be in use. Veneta [30], for example, uses Common Neighbor to do friend discovery but their focus is on how to achieve this simple heuristic securely. While no detail information is available for the proprietary friend recommendation algorithms used by commercial OSN service providers, a recent post [35] by the Tecent research team noted the deficiency of using Common Neighbors heuristic for community detection. It also expressed their concern of the computational burden of mature global optimization methods.
II-C Other Topics to Be Assisted by Community Detection
Community detection output can assist many other topics. Detecting community in decentralized scenario can also help research in those topics. In this section, we briefly discuss a few of them.
To design the DTN routing algorithm, BubbleRap[14], Pan used the knowledge of community and centrality as heuristics.
It is shown that video views preserves good locality in terms of both geo-locations[7] and social network topology[31]. The key observation is that, many interest diffusion processes have some target communities. Community detection result can help to improve the performance of those social network assisted content distribution.
Social network assisted Sybil Defense also draws a lot of attention in recent years. It includes sybil identity detection and sybil community detection[32]. The latter one is the same problem as community detection. What differs is that the structural assumptions in Sybil Defense schemes are usually stronger and its application is more sensitive to TP or FP depending on the scenario. With locally detected communities, nodes can share information to form a trust region, thus excluding nodes who are highly susceptible to be sybil.
III Problem Formulation
III-A Define Local Topology Using The Notion of Hops
We model the social network as a graph where each node corresponds to a person and each link corresponds to a relationship. For social networks in practice, relationships can be directed (like following on Twitter) or undirected (like being friends on Facebook). In this work, we focus on undirected relationship only.
Let’s denote the undirected social graph as , where is the vertex (node) set and is the edge (link) set. We also denote a node using the shorthand notation . Given a node , we denote its -hop neighbour set as . Iteratively, we can define the -hop neighbour set as , where . The set of edges that can be observed within -hop is .
Using the above notations, we can define the local topology information available to a user as follows: We call a normal user of SNS as “observer”, denoted by . How much information the observer can get depends on the application scenario. Given an observer , the -hop local topology is . To facilitate discussions, we define to be the number of nodes and to be the number of edges.
III-B Illustration of 2-Hop Topology
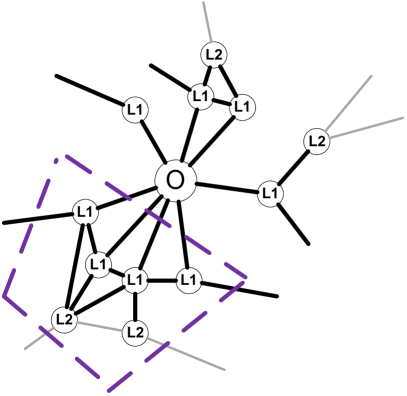
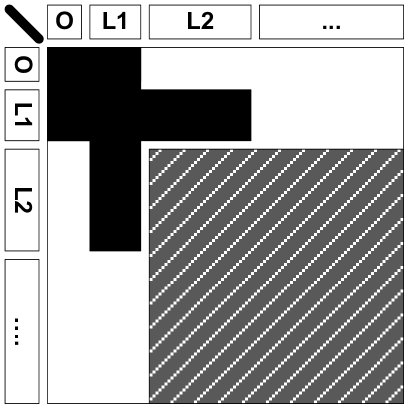
Fig. 1 gives an illustration of . In Fig. 1(a), the central biggest node(O) is the observer. Nodes denoted by “L1” are the direct friends of the observer, also referred to as the level 1 nodes (reachable within 1 hop). Similarly, nodes denoted by “L2” can be reached within 2 hops and are referred to as level 2 nodes. Dark thick edges show the links which are visible to the observer. Light thin edges show possibly existing links but the observer cannot see them within its 2 hop visibility. Dashed region shows a probable community since those nodes have dense linkage inside and sparse linkage outside. Fig. 1(b) illustrates the observer’s knowledge of the adjacency matrix. Nodes are ordered and labeled using the same convention as the left panel. The black area is the part known to the observer. The white vacancy represents zeros in the adjacency matrix. The shadowed square is unknown, including the light thin edges in the left figure.
III-C Justifications for a 2-Hop Formulation
As an initial study of community detection on DSN, we formulate the problem assuming only 2-hop topology information is available for the target user. The reasons are:
-
•
2-Hop is the smallest topology to study. The 1-hop subgraph from an observer is a simple star, and there is no further topology information to utilize.
-
•
OSN diameter continues to shrink. Dating back to 1929, Frigyes Karinthy proposed the concept of 6 degree(7 hops) separation [34]. Stanley Milgram conducted experiments in 1960 to show an average degree of 5.2 (6 hops)[33]. According to Facebook’s study in the end of 2011 [33], the separation in the Facebook network was 5.28 hops in 2008 but became 4.74 hops in 2011.
-
•
Average node degree is very high. Dunbar’s Number [10] estimates the number of stable relationships of a typical person to be 150. The Renren network (further explained in Section V-A) is much better connected than that and the size of topology data associated with a local neighborhood would increase rapidly with the hop-count.
- •
-
•
Trust concern prevents user from looking further away. In the extreme case of DSN, users only have their own first hop topology (e.g. through Musubi’s contact book). The 2-hop topology can be obtained by requesting those direct friends and is reliable. However, asking a stranger for his buddy list may risk at polluting the raw data and resulting in meaningless detection result.
III-D Community Detection As a Classification problem
Conventional community detection is formulated as a clustering problem. That is, given the full graph , partition the vertex set into subsets , such that and . The notion of community is that nodes within the same community have dense linkage and nodes from different communities have sparse linkage. To implement this concept mathematically, people proposed different quality measures on a partitioning. Thus the clustering version of community detection problem becomes (consider the non-overlapping case)
| (1) | |||||
| (2) | |||||
| (3) |
Whether the “maximize” or “minimize” operator is used depends on the nature of the quality measure. One implementation of is the Modularity proposed by Newman[23]:
| (4) |
where is the adjacency matrix of , is the degree of node , is the total number of edges. Modularity in essence measures how far the resulting partition is from a random graph and, the higher the better. There are other quality measures, e.g. Conductance. Interested readers can refer to [2] for more information.
The clustering formulation draws a lot of interest in the past. One reason is that the form is clean and highly amenable for theoretical studies. The other reason is that at the time when people started to do community detection, there were no successful large-scale OSN s. Researchers did not have ground-truth to validate whether a community partitioning is correct. So the clustering formulation and quality function evaluation became the mainstream approach in the research community.
With the wide acceptance of OSN in the recent years, labeled data become available. For instance, in the Renren social network graph, every node is associated with an institution name , representing his/her university, high school, company, etc. Note that a person may have multiple institutions in reality. For the moment, we consider the social graph with only one institution name for each node . Details regarding multiple institution names are put in Section V-A.
Since the ground-truth is available, evaluating the community detection result against the crawled ground-truth is more reasonable. Mathematically speaking, given an observer and its 2-hop local topology , we want to determine whether , where is the set of test nodes. means that we evaluate the algorithm on all nodes within 2 hops, which fits the application of friend recommendation. means that we only evaluate the algorithm on only level 1 nodes, which fits the application of automated friend categorization. Both choices of will be evaluated in Section V. We then cast this decision problem as a binary-classification problem, i.e. assign a label (the ground-truth) to each node:
| (5) |
The algorithm should take the 2-hop topology as input and output predicted labels .
The confusion matrix of classification result is shown in Fig. 2. Using the notation in the confusion matrix, we have multiple standard ways to evaluate the quality of predicted labels , such as accuracy:
| (6) |
true positive rate
| (7) |
and false positive rate
| (8) |
In Section V, we will further analyze the shortcomings of the above evaluation methods and propose to use Receiver Operating Characteristics (ROC) and Area Under the ROC Curve (AUC) to evaluate key steps of the algorithm in depth.
| # of Samples | ||
|---|---|---|
IV Analysis and Algorithm Design
In this section, we analyze the problem and propose a two-stage algorithm framework first. Then we shift our focus on the first stage, i.e. finding a reasonably good ranking function of all nodes in . Among all kinds of possibilities, we investigate the variations of PageRank (PR) and Personalized PageRank (PPR). We show PR is not informative in our setting and justifies the potential of PPR using an “ink spilling” process. In the last part of this section, we analyze the complexity of PPR computation using both conventional matrix multiplication method and ink spilling algorithm.
IV-A Two-stage Classification Framework
There are many ways to construct good classifiers. In this work, we investigate a simple framework as shown in Algorithm 1. In the first stage, we compute a ranking function , which assigns scores to all the nodes concerned. This score reflects how likely one node is positive but it does not necessarily be strict probability distribution on . In the later discussion, we also refer to as “feature”, “heuristics” and “ranking” interchangeably. We can consider the two metrics defined in Eq. 14 and Eq. 15 as two examples of . In the second stage, we compute a proper threshold and cut the nodes into positive and negative sets according to this threshold.
Note that our framework itself may not be optimal. For example, we can compute more than one feature, and train a probably better classifier. As a pilot study of the potential of only 2-hop topology, we, however, are more interested in what performance a single ranking function can achieve in this setting. The investigation on the use of multi-dimensional ranking function is left as future work.
IV-B PageRank and the Limitation of Its Basic Form
We denote the adjacency matrix of a graph by . The element of degree vector is defined as . The degree matrix is defined as . Left multiplying by the inverse degree matrix, we get the normalized adjacency matrix (also called the walk matrix): . The PR vector is obtained by solving the following fixed-point equation:
| (9) |
The solution of can also be interpreted as the stationary probability distribution of a Random Walker (RW) on the graph. In each step, the RW uniformly picks an adjacent edge and walks to the other side of the edge. We consider one situation that an RW gets bored and restarts from a random nodes uniformly(called “escaping”). The escaping probability is denoted by and the corresponding stationary distribution can be solved through the following equation:
| (10) |
where is the all ones vector, and .
The PR algorithm is very successful in web ranking context[6]. It is shown to satisfy a set of ranking axioms[3], that fits the web ranking setting very well. The RW interpretation also fits our problem. Since our partial topology is biased towards , nodes with higher proximity with should be visited more frequently by an RW. If one node has higher proximity with the observer, it is more likely to be in the same community. This intuition is the same as simple heuristics like Common Neighbour and Adamic/Adar Score[2].
The initial version of PR (Eq. 9) is not informative. This is because on an undirected and connected graph, the stationary distribution satisfies . However, higher degree does not necessarily mean higher proximity with the observer. The modified version of PR (Eq. 10) re-shares the score among nodes, and results in a different ranking. On one extreme, when , is a uniform distribution. On the other extreme, when , is the degree-proportional distribution. This version is more informative than the initial version in Eq. 9 and we will evaluate how it performs in Section V.
IV-C Personalized PageRank
Personalized PageRank(PPR), also known as topic sensitive pagerank[12] is a generalization of Eq. 10:
| (11) |
where is the personalized Escape Vector (EV), and . To simplify the notation, we denote as the normalized version of . Instead of filling all ones in , we can make the escaping probability biased towards a set of nodes. The intuition is that the RW will restart from some nodes with particular interest instead of uniformly pick a random node. In the stationary distribution, nodes close to those restarting nodes will have higher probability. If we know some positive nodes beforehand, putting them in PPR’s EV will help to rank other positive nodes higher.
IV-D The Ink Spilling Interpretation of PPR
Besides the random walk view, PPR also has a nice interpretation using ink spilling process [16, 17, 18]. To see this, we reorganize Eq. 11 as . The eigen value of is in the range , so the eigen value of is in the range . Then is invertible and we have . Since the eigen value of is in the range , we can perform the expansion by taking in the above equation:
| (12) |
Eq. 12 has an intuitive interpretation using an ink spilling process:
-
1.
Every node is initialized with amount of ink.
-
2.
At each step, of the ink dries at every node.
-
3.
The rest portion wet ink is passed to neighbors using the weighting of .
-
4.
The process repeats until all ink dries.
Based on this ink spilling interpretation, we can put some user labeled positive nodes in EV. Since the positive nodes form a community which is well connected inside and have sparse connection with the rest network, positive nodes should generally have more ink than negative nodes. If more positive nodes are put into EV, PPR should be more capable to distinguish between positive and negative nodes. We will numerically investigate the sensitivity of PPR to the size of restarting set in Section V.
IV-E Complexity of PPR
Computing PPR can be very efficient. We analyze two methods: Matrix Multiplication and Ink Spilling.
IV-E1 Matrix Multiplication
Based on Eq. 11, we can derive the straightforward iteration:
| (13) |
where . The convergence rate of Eq. 13 depends on the eigen gap of . It can be shown that [15], which provides a constant gap irrelevant of . Then iterations are needed to approximate the stationary distribution with error bounded by [18]. Basic matrix-vector multiplication costs time. In our implementation, we deal with the two parts of separately. They cost and time, respectively. The total complexity for a fixed is then As is shown before, on the 2-hop topology, is on the order of , so the computation is tractable for every single user on commodity desktop computers.
IV-E2 Ink Spilling
Note that the ink spilling process can be performed in an asynchronous manner[18]. We formalize the asynchronous version in Algorithm 2. Denote the level of wet ink at node by . At each step, we pick an arbitrary node satisfying the condition , dry portion of wet ink, and share the remaining ink among its direct neighbors. If no such node exists, i.e. , we call the current an -approximation of PPR. The termination condition implies that there is only a small fraction of wet ink at all nodes.
We denote the node selected at step by . From the iteration invariance, we know at least ink is wet at this node. Since the initial ink level is , we have . That is . In each step, it takes constant time to dry a portion of ink for the current node and time to distribute wet ink to neighbors. So the complexity of ink-spilling algorithm is [18]. To reach the same level of approximation as matrix multiplication, i.e. , we have . As is constant for a given graph size, the overall complexity is . Note that in the real application, performing excellent approximation is not necessary. So we can set to a larger value than . We also note that this analysis is not tight and in practice ink spilling algorithm can benefit from the sparse structures of many graphs.
V Performance Evaluation
We have evaluated our proposed algorithms using data sets crawled from Renren, currently the largest OSN in China.
V-A Data Set
By default, a Renren user can only view the buddy list of their direct friends. This setting incidentally restricts the network perspective of an individual Renren user to his/her 2-hop neighborhood, matching exactly the scenario we considered in Section III. We have developed a dedicated crawler to collect 2 hop buddy list information (friends and friends of friends) from any given observer. Eight volunteers have helped to run the crawler and contributed their own data. All the volunteers are active undergraduate Renren users for classes 2006 to 2008. Our study is based on the separately anonymized version of their data. As our formulation only relies on 2-hop topology of any target user, we actually have collected eight independent data sets for evaluation. Since the results for these eight data sets are qualitatively the same, in what follows, we only present the quantitative evaluation results for one observer’s data set (denoted by ) for brevity.
Manual examination of the data sets has reviewed that one’s largest and also latest community always (in our data sets) correspond to his/her undergraduate university’s community. In this initial evaluation, we are interested in the ability of our PPR approach in “re-discovering” this community based on 2-hop topology. For observers who have changed their institution name after graduation, we manually set his/her institution name to the undergraduate university. For any other nodes, we stick to the default institution name shown on the buddy list. All nodes that have the same institution name as the observer are regarded as positive nodes, and the rest are regarded as negative nodes. This preprocessing causes certain noise of the ground-truth but this is the best we can do for it’s impossible for us to get all institution names of a person by default.
V-B Evaluation Methodology
In Section III, we listed some conventional evaluation criterion for classification problem. However, simple evaluation like accuracy can be misleading. For instance, in our experiment, observer has 88238 nodes in his 2-hop neighborhood (L1 + L2 friends). 9345 of them are positive nodes and the ratio of is 0.1059. That means, the most naive algorithm which declares all nodes to be negative can reach an accuracy(Eq. 6) of 0.8941. This result is not of practical interest. Instead of accuracy, we look at True Positive Rate (TPR) and False Positive Rate (FPR) separately.
In our two-stage algorithm framework, we first calculate a ranking of all nodes in and then set a proper threshold to cut the set into positive and negative set. By varying the threshold, we can obtain a series of TPR and FPR. Plotting all those points on a 2-D graph, we can get the Receiver Operating Characteristics (ROC) curve[11]. If we rank nodes randomly, the ROC curve is approximately a straight line connecting (0,0) and (1,1). The higher the ROC curve is above the diagonal line, the more capable a ranking is to distinguish between positive and negative nodes.
Although ROC is very informative for human, it is hard to automatically compare many ROC curves directly. Instead, the Area Under the ROC Curve (AUC) [11] is a better summary metric. If the AUC is larger, the ROC curve is generally higher. AUC is equivalent to the probability that an algorithm will rank a randomly chosen positive node higher than a randomly chosen negative node[11].
V-C Validation of AUC as An Effective Metric
Although AUC reflects the expected performance of a classifier, it does not mean higher AUC curves will dominate lower AUC curves everywhere. In this section, we experimentally show that AUC is an effective metric.
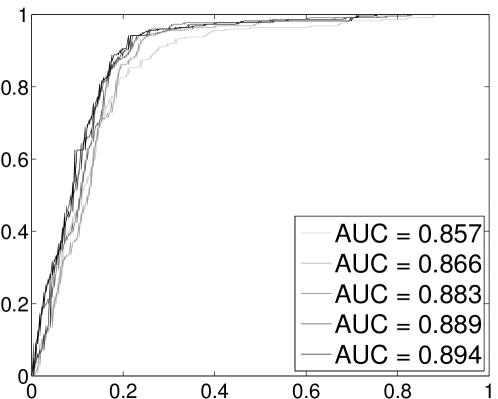
In this experiment, we configure EV of PPR randomly. We run 10 instances of simulations and plot the ROC curves in Fig. 3. The test set is set to L1 nodes (). To make the plot uncluttered, only 5 of the curves are plotted. It is shown that larger AUC in general implies higher ROC curve. This is partly because those curves come from the same family, i.e. PPR value under different settings.
For the rest of our evaluation, we will focus on comparing the AUC of different approaches.
V-D Leverage ROC to Get Classification Result
Getting a good ROC curve is just an intermediate step towards the final application. Before we extensively evaluate AUC of different approaches under different settings, we briefly note two methods to leverage the ROC curve to get classification result.
Suppose we get one ROC curve in Fig. 3. One attainable ROC point (0.1832,0.8991) can be read from the plot. In , there are 224 positive nodes and 222 negative nodes. This means that an algorithm can return negative nodes and = 201.40 positive nodes with proper threshold. The problem now becomes how to target this ROC point without knowing the ground-truth. Here are two choices:
-
•
With prior knowledge of the portion of positive nodes (obtained through statistics over the network), we can target an ROC point in the following way. For example, suppose we find (0.19,0.9) is a reasonable ROC point to target. For a typical undergraduate user, he/she usually have half of the friends come from the same university. Then we vary threshold until the number of predicted positive nodes reaches .
-
•
Another method is to look at PPR values directly and detect possibly existing sharp drops. Andersen[5] studied the local graph partitioning problem and proposed to cut the graph by detecting sharp drops of the PPR vector. We already note the difference between Local Graph Partitioning and the “localized” setting of our problem in Section I. Whether similar approaches are applicable to the current problem is left to future work.
V-E Comparison of Four Approaches
We first compare our PR and PPR proposal to two local heuristics:
-
•
Common Neighbour (Eq. 14) simply computes the size of intersection between one node’s neighborhood and the observer’s neighborhood. The intuition is that the more friends the two nodes have in common, the more likely they are in the same community.
(14) -
•
Adamic/Adar score (Eq. 15) is an intuitive improvement of Common Neighbour. It biases towards lower-degree nodes. The reason is that higher degree nodes are more popular and thus provide little information if two nodes both connect to it. On the contrary, if two nodes both connect to a low-degree node, they have a larger chance of being in the same community.
(15)
and are computed to rank node , respectively. The two simple heuristics can be computed exactly within 2-hop topology and are thus the right baseline to compare. For many other algorithms, their original settings are beyond 2-hop. Running those algorithms on our data set naturally violates their assumptions so the performance is not guaranteed.
In this experiment, the EV of PPR is simply set to 3 highest degree positive nodes plus the observer . We defer the exploration of how the choice of would influence the performance to following sections. For the basic version of PR, the EV is set to an all-one’s vector. Both PPR and PR use a transition ratio of . The results of the four approaches are evaluated on all nodes within 2-hop, i.e. .
| Common | 0.7415 | Adamic/Adar | 0.7428 |
| PR | 0.7024 | PPR | 0.8339 |
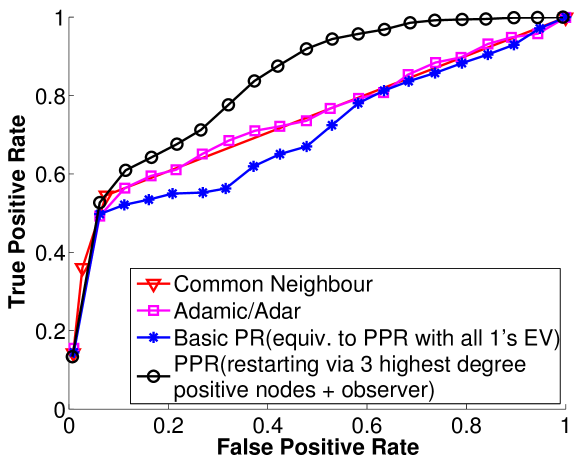
Table I shows the AUC of the four approaches and Fig. 4 shows their ROC curves. We can see that Common Neighbours and Adamic/Adar perform equally well. In the low FPR region (e.g. ), the four approaches does not have much difference. In the higher FPR region, PPR is obviously more effective than the others while pure PR even does worse than the two simple heuristics. Note that the AUC is at least 0.5 for meaningful approaches, PPR actually improves PR by 64.97% relatively. This result aligns with our analysis in Section IV.
Remark 1.
A few labels help a lot. If the user can manually label a few positive nodes, the PPR algorithm can leverage this information to yield significant improvement.
V-F Evaluation on All Nodes within 2-Hop
We already observed that a slight modification of EV can make a considerable difference in the ROC curve, whereas simple-minded all one’s performs worse than the two local heuristics. In the previous proof-of-concept experiment, we put 3 highest degree positive nodes and the observer in the EV. In this section, we explore how AUC varies with different choices of .
Among different alternatives to fill in , we choose the unweighted version of for simplicity. That is, we determine a restarting set of nodes, denoted by , and fill in as follows:
| (16) |
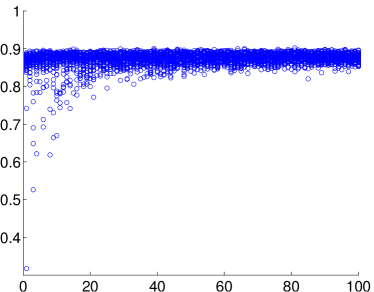
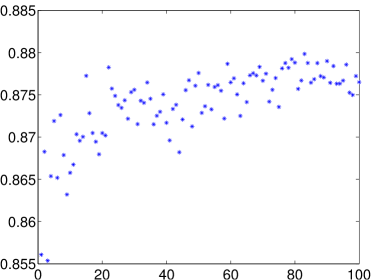
V-F1 Random Positive Nodes as Restarting Set
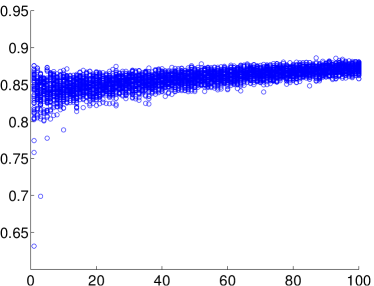
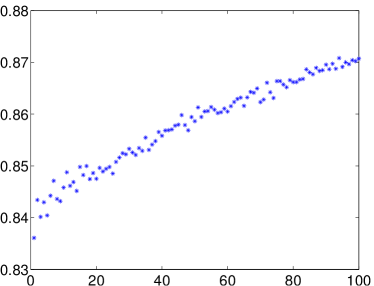
In this experiment, some random positive nodes are put into . For each size of , we repeat the experiment for 50 rounds to absorb randomness. Fig. 5(a) is the scatter plot of 5000 simulations with varying from 1 to 100. Fig. 5(b) plots the mean AUC of each . It is clear that more pre-known positive nodes help to improve the performance of PPR on our 2-hop community detection settings but there is only a little benefit ( increase of AUC from to , i.e. an 8.8% relative improvement). Besides the increase of mean, larger results in smaller variance, which is also appreciated in real applications. Manual labeling causes a cost for the users, so they need to find a trade-off between performance and cost.
V-F2 High-Degree Positive Nodes as Restarting Set
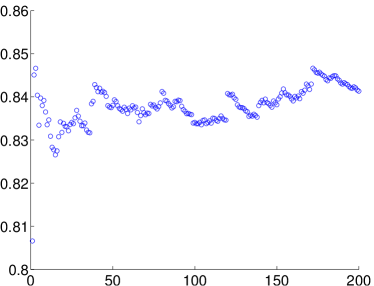
In this experiment, the highest degree positive nodes are put into . We vary from 1 to 200. Fig. 6(a) shows the scatter plot of AUC v.s. . There is no obvious pattern in this plot and high-degree heuristic generally performs worse than random positive node heuristic when is fixed. As a practical note, for the application on we suggest the user randomly label a few positive nodes.
Remark 2.
More labels help a little. In the random setting, putting more nodes in the EV results in minor linear benefit. In the high degree setting, more nodes does not improve the performance.
V-G Evaluation on Only Level-1 Nodes
In this section, we repeat the same experiment in the previous section but evaluate the result on , i.e. only L1 friends. The detection result on cannot be used to do friend recommendation, for those nodes are already connected to observer. Nevertheless, it is still meaningful for automated relationship categorization.
V-G1 Random Positive Nodes as Restarting Set
We first choose the random , and plot two similar graphs as before in Fig. 7. It shows that the mean of AUC does not increase with but the variance decreases with . Differences in Fig. 7(b) are mainly due to randomness.
V-G2 High-Degree Positive Nodes as Restarting Set
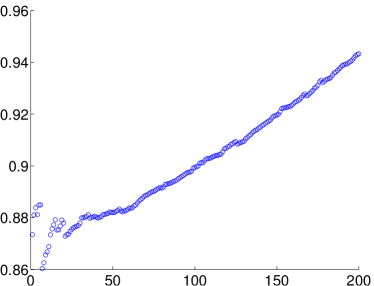
Next we evaluate high-degree heuristic and plot the result in Fig. 6(b). After a fluctuation period, the AUC goes up steadily with the increase of . Note that we are evaluating PPR on L1 nodes in this experiment. On the 2-hop topology seen by our observer, the high degree positive nodes are also mostly L1 nodes. Consider the ink spilling process. More L1 positive nodes in means they have more initial ink. At least, nodes in are guaranteed to have higher rank. The result of Fig. 6(b) is thus intuitive. Note that the curve in Fig. 6(b) waits until to reach the linear increasing part. Labeling 60 highest degree positive nodes is a prohibitive workload for a normal user and is thus unrealistic in practice.
Comparing Fig. 6(b) with Fig. 7, the high degree positive heuristic generally performs better than random node heuristic. As a practical note, for the application on , we suggest labeling several high degree positive nodes. High degree nodes in a community are not only easy to recognize, but also induce a deterministic construction of EV.
Remark 3.
is the minimum for the application on . Although PPR shows significant improvement to simple heuristics, the result on all 2-hop nodes is not good enough for practical use. This is shown by the ROC curves in Fig. 3 and Fig. 4. The evaluation on only level 1 nodes is promising, and we can find good ROC point to target in real applications.
V-H Convergence Behavior of Two PPR Algorithms
In this section, we evaluate the runtime behavior of the two candidate realizations of PPR: Matrix Multiplication and Ink Spilling. The data set is from the same observer as above sections. To show the convergence behavior, we fix and set the EV using the 5 highest degree positive nodes. By varying for the two algorithms, we obtain the convergence rate and error. All computations are done on a laptop with 2.00 GHz CPU.
Note that the analysis of matrix multiplication algorithm in Section IV-E does not depend on the choice of vector norm. We use in our implementation for both simplicity and numerical stability. Denote the result of algorithm “algo” with precision control parameter by . We choose as the benchmark. We record the difference and execution time for each . Fig. 8 plots the convergence behaviour of the two algorithms.
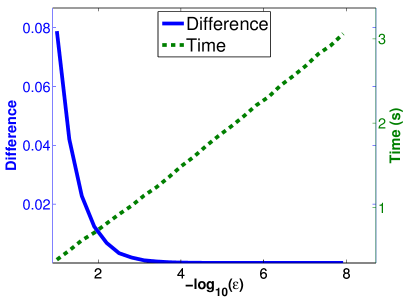
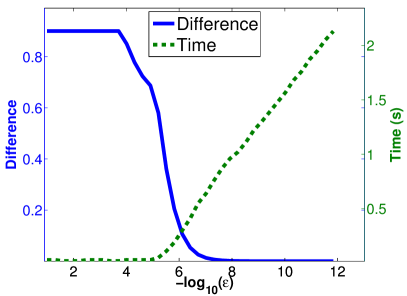
The x axis() in Fig. 8 is in log-scale. We observe a linear part in both plots. This means the two algorithms both converges exponentially fast. In around 2 seconds, both of the algorithms can converge to a ranking function with , which is more than enough for most practical purposes. The flat part of the curve in Fig. 8(b) also indicates that more stringent should be set in order for the Ink Spilling approach to converge. This is because the definition of -approximation in the Ink Spilling algorithm involves node degree. For example, suppose we have a local topology with , at least is required to make the total error upper bounded by when the algorithm converges.
VI Discussions and Future Works
The extensive simulations above show that PPR is an effective and flexible proximity measure. With appropriate parameters, the PPR score can be used as a reasonable ranking function for our binary classification framework. We have also remarked that the application of PPR on L1 nodes are more appropriate for real application. There are good ROC points to target and we mentioned some methods, e.g. using prior distribution or detecting sharp drop ,to target them. We illustrated the use of prior distribution. However, it is not trivial to set proper threshold in order to get final detection result. We leave this as a future work.
We have also remarked that 2-hop topology is not enough for detecting community of all 2-hop nodes (L1 + L2). Meanwhile, 2-hop topology is promising for community detection of L1 nodes. If we constrain the evaluation nodes to L1 nodes only, our formulation has become node classification on an ego-network. In the preparation of this manuscript, we found other similar works to tackle with node classification locally on an ego-network. In [22], the authors developed a probabilistic model that leverages both topology information and node-level information to discover social circles of an ego. DEMON [8] proposed to solve the centralized community detection of large graphs by first detecting communities locally and then combine them globally. It first uses Label Propagation [27] to detect community on ego-network of all nodes and then combine locally detected communities by thresholding their intersection. Our observations in the experiments and those works show that ego-network is a promising direction to go. Stepping back to our original problem, we see that AUC of PPR on L2 still has some improvements to basic heuristics. Although there are no good ROC points for direct application, the benefit brought by PPR may be useful in some extensions of the current problem.
One possible extension of the current problem is to allow cooperation among direct friends or a small number of collaborating observers in the network. Another direction is the development of privacy preserving protocols for DSN which can allow users to help each other to improve their personal community detection without requiring excessive trust.
It is worth to note that overlapping community detection has also drawn a lot of interest in recent years. Our PPR proposal is readily available for overlapping community detection. In essence, PPR reveals the proximity of nodes to a set of seeds. The observer can provide different sets of seeds so as to reveal different communities. The detecting result can be overlapping.
In the simulation, it seems that we used more information than topology and people concerns about privacy of the data. We briefly discuss the data source as follows: 1) 2-hop topology is natural under most settings, e.g. on many OSN’s, users can check their friends’ buddy lists; 2) in the EV allocation, the observer manually label some positive nodes (or nodes he/she believes to be positive), thus requiring no collaboration from others; 3) in the high degree heuristic, degree information can be calculated directly on 2-hop topology (however the degree of L2 node is under estimated). Note that we can not know all node labels first and then sample random positive nodes or high degree positive nodes. In practice, user just identifies a set of positive nodes regardless of other node properties. This can be implemented and the effect should be similar to random node heuristic.
VII Conclusion
In this paper, we have studied the community detection problem of any given user under the constraint of limited topology information imposed by emerging DSN’s. In particular, we consider the scenario where only 2-hop topology information is available to the given target SNS user. Instead of following the clustering approach taken by most traditional works of community detection, our formulation yields a binary classification problem which can be evaluated against ground-truth data collected from real-world OSN s. We then establish a two-stage framework for this problem and transform our problem to the finding of a good ranking function of nodes in the test set. In particular, we adapt the notion of PPR for this purpose and justify its applicability on community detection via the Ink Spilling interpretation of PPR.
Our evaluation using real-world OSN data shows that even with the topology as small as 2-hop we can “discover” a target user’s community. Our proposed PPR approach significantly outperforms the basic version of PR and two other heuristics believed to be commonly used by large-scale OSNs in practice. Our study shows that manually labeling just a few positive nodes for PPR can boost the performance.
References
- [1] G. Agarwal and D. Kempe, “Modularity-maximizing graph communities via mathematical programming,” The European Physical Journal B-Condensed Matter and Complex Systems, 2008.
- [2] C. Aggarwal, Social network data analytics. Springer-Verlag NY, 2011.
- [3] A. Altman, M. Tennenholtz, “The PageRank axioms,” in Procs. of the 6-th ACM conference on Electronic Commerce, 2005.
- [4] R. Andersen, F. Chung, K. Lang, “Local graph partitioning using pagerank vectors,” FOCS, 2006.
- [5] R. Andersen, F. Chung, “Detecting sharp drops in pagerank and a simplified local partitioning algorithm,” Theory and Apps. of Models of Computation, 2007.
- [6] S. Brin, L. Page, “The anatomy of a large-scale hypertextual web search engine,” Computer networks and ISDN systems, 1998.
- [7] A. Brodersen, S. Scellato, and M. Wattenhofer, “Youtube around the world: Geographic popularity of videos,” in WWW, 2012.
- [8] M. Coscia, G. Rossetti, F. Giannotti, and D. Pedreschi, “Demon: a local-first discovery method for overlapping communities,” KDD, 2012.
- [9] B. Dodson et al, “Musubi: disintermediated interactive social feeds for mobile devices,” WWW2012
- [10] R. Dunbar, “Youv́e got to have (150) friends,” The New York Times, The Opinion Pages, 2010.
- [11] T. Fawcett, “An Intro. to ROC analysis,” Pattern Recog. letters, 2006.
- [12] T. Haveliwala, “Topic-sensitive pagerank: A context-sensitive ranking algorithm for web search,” IEEE Trans. on Knowledge and Data Engineering, 2003.
- [13] P. Hui et al, “Distributed community detection in delay tolerant networks,” in Procs. of 2nd ACM/IEEE International workshop on Mobility in the evolving internet architecture, 2007.
- [14] P. Hui, J. Crowcroft, and E. Yoneki, “Bubble rap: social-based forwarding in delay tolerant networks,” in Proceedings of the 9th ACM international symposium on Mobile ad hoc networking and computing, 2008.
- [15] S. Kamvar, Numerical Algorithms for Personalized Search in Self-organizing Information Networks. Princeton Univ Press, 2010.
- [16] P. Berkhin, “Bookmark-coloring algorithm for personalized pagerank computing,” Internet Mathematics, 2006.
- [17] D. Spielman, “Spectral graph theory lecture notes,” 2009. [Online]. Available: http://www.cs.yale.edu/homes/spielman/561/
- [18] L. C. Lau, “Spectral algorithm lecture notes,” 2012. [Online]. Available: http://www.cse.cuhk.edu.hk/~chi/csc5160/index.html
- [19] I. Leung, P. Hui, P. Lio, and J. Crowcroft, “Towards real-time community detection in large networks,” Physical Review E, , 2009.
- [20] D. Liben-Nowell, J. Kleinberg, “The link-prediction problem for social networks,” Journal of the Amer. soc. for Information Science & Technology, 2007.
- [21] W. Lin et al, “Community detection in incomplete information networks,” WWW2012.
- [22] J. McAuley and J. Leskovec, “Learning to discover social circles in ego networks,” in Neural Information Processing Systems, 2012.
- [23] M. E. J. Newman,M. Girvan, “Finding and evaluating community structure in networks,” Phys. Rev. E, Feb 2004.
- [24] M. E. J. Newman, “Finding community structure in networks using the eigenvectors of matrices,” Phys. Rev. E, 2006.
- [25] “Diaspora.” [Online]. Available: http://diasporaproject.org/
- [26] “Onesocialweb,” 2012. [Online]. Available: http://onesocialweb.org/
- [27] U. Raghavan, R. Albert, and S. Kumara, “Near linear time algorithm to detect community structures in large-scale networks,” Physical Review E, 2007.
- [28] L. Ramaswamy, B. Gedik, and L. Liu, “A distributed approach to node clustering in decentralized peer-to-peer networks,” IEEE Transactions on Parallel and Distributed Systems, 2005.
- [29] M. Sachan et al, “Using content and interactions for discovering communities in social networks,” WWW2012.
- [30] M. Von Arb et al, “Veneta: Serverless friend-of-friend detection in mobile social networking,” IEEE WIMOB’08.
- [31] Z. Wang, L. Sun, C. Wu, and S. Yang, “Guiding internet-scale video service deployment using microblog-based prediction,” in IEEE INFOCOM, 2012.
- [32] H. Yu, “Sybil defenses via social networks: a tutorial and survey,” ACM SIGACT News, 2011.
- [33] Facebook, 2011, Anatomy of Facebook, https://www.facebook.com/notes/facebook-data-team/anatomy-of-facebook/10150388519243859
- [34] Wikipedia, http://en.wikipedia.org/wiki/Frigyes_Karinthy
- [35] Tencent QQ Quan, http://user.qzone.qq.com/19990210/blog/1332400269
- [36] Wikipedia, http://en.wikipedia.org/wiki/Renren