An X-ray and Multiwavelength Survey of Highly Radio-Loud Quasars at : Jet-Linked Emission in the Brightest Radio Beacons of the Early Universe
Abstract
We present a systematic study of the X-ray and multiwavelength properties of a sample of 17 highly radio-loud quasars (HRLQs) at with sensitive X-ray coverage from new Chandra and archival Chandra, XMM-Newton, and Swift observations. Eight of the new and archival observations are reported in this work for the first time. New Chandra observations of two moderately radio-loud and highly optically luminous quasars at are also reported. Our HRLQ sample represents the top of radio-loud quasars in terms of radio loudness. We found that our HRLQs have an X-ray emission enhancement over HRLQs at lower redshifts (by a typical factor of ), and this effect, after controlling for several factors which may introduce biases, has been solidly estimated to be significant at the 3–4 level. HRLQs at –4 are also found to have a similar X-ray emission enhancement over HRLQs, which supports further the robustness of our results. We discuss models for the X-ray enhancement’s origin including a fractional contribution from inverse Compton scattering of cosmic microwave background photons. No strong correlations are found between the relative X-ray brightness and optical/UV emission-line rest-frame equivalent widths (REWs) for radio-loud quasars. However, the line REWs are positively correlated with radio loudness, which suggests that relativistic jets make a negligible contribution to the optical/UV continua of these HRLQs (contrary to the case where the emission lines are diluted by the relativistically boosted continuum). Our HRLQs are generally consistent with the known anti-correlation between radio loudness and X-ray power-law photon index. We also found that the two moderately radio-loud quasars appear to have the hardest X-ray spectra among our objects, suggesting that intrinsic X-ray absorption () may be present. Our HRLQs generally have higher X-ray luminosities than those for the composite broad-band spectral energy distributions (SEDs) of HRLQs at lower redshift, which further illustrates and supports the X-ray emission enhancement of HRLQs. Some of our HRLQs also show an excess of mid-infrared emission which may originate from the synchrotron emission of the relativistic jets. None of our HRLQs is detected by the Fermi LAT two-year survey, which provides constraints on jet-emission models.
Subject headings:
galaxies: active — galaxies: nuclei — galaxies: high-redshift — jets: galaxies — X-rays: galaxies1. Introduction
X-ray studies of active galactic nuclei (AGNs) over the past yr have greatly improved understanding of the growth of the first supermassive black holes (SMBHs) in the early Universe, thanks to unprecedentedly powerful X-ray observatories as well as wide-field surveys in the optical/UV and radio bands. Chandra and XMM-Newton, along with other X-ray missions, have observed more than 100 quasars at , the majority of which were first identified by wide-field optical/UV surveys, e.g., the Sloan Digital Sky Survey (SDSS; York et al. 2000), or radio surveys, e.g., the Faint Images of the Radio Sky at Twenty-Centimeters (FIRST; Becker et al. 1995) survey and the NRAO VLA Sky Survey (NVSS; Condon et al. 1998). The quasar population is divided into radio-quiet and radio-loud subcategories based on the apparently bi-modal distribution of the radio-loudness parameter (e.g., Ivezić et al. 2004),111There is an ongoing debate regarding the bi-modality of the radio-loudness distribution of quasars (e.g., Kellermann et al. 1989; Ivezić et al. 2002, 2004; Cirasuolo et al. 2003; Singal et al 2011, 2012). Some recent studies with new approaches, e.g., investigating the loci of quasars in the optical/UV spectroscopic parameter space (Zamfir et al. 2008) or the quasar radio luminosity function (Kimball et al. 2011b) found two distinct populations with different radio properties, supporting the dichotomy of radio-loud vs. radio-quiet quasars (but also see, e.g., Broderick & Fender 2011). which was defined by Kellermann et al. (1989) as (rest-frame; see §3 for a detailed definition). Radio-quiet quasars (RQQs) have , while radio-loud quasars (RLQs) are those with .
The basic X-ray properties of RQQs are now well established (e.g., Kaspi et al. 2000; Brandt et al. 2001, 2002; Vignali et al. 2001, 2003a, 2003b, 2005; Shemmer et al. 2005, 2006). The RQQs have remarkably similar X-ray properties to those of RQQs at lower redshift, which is notable given the strong evolution of the quasar population over cosmological timescales (e.g., Richards et al. 2006b; Croom et al. 2009; Jiang et al. 2009). These results suggest the mode of SMBH growth via accretion does not strongly evolve with redshift.
RLQs feature powerful jets that originate near the SMBH and may extend up to hundreds of kpc. These jets possess bulk relativistic velocities on at least sub-kpc scales and generate strong radio emission that is particularly pronounced in low-inclination (highly beamed, foreshortened, core-dominated) RLQs. RLQs usually show an enhancement of nuclear X-ray emission compared to RQQs, likely due to a contribution from the spatially unresolved jet (e.g., Worrall et al. 1987; Miller et al. 2011; and references therein). Previous X-ray studies of representative RLQs at (–; e.g., Bassett et al. 2004; Lopez et al. 2006; Saez et al. 2011) have shown that the factor of X-ray emission enhancement of these objects is similar to that of low-redshift RLQs of similar radio loudness. These results limit any redshift dependence of the nuclear X-ray emission in RLQs (consistent with earlier studies to moderate redshifts; e.g., Worrall et al. 1987). The lack of strong redshift evolution argues against a dominant X-ray generation mechanism for the nuclear jet-linked contribution whereby relativistic jet electrons upscatter cosmic microwave background photons into the X-ray band (the IC/CMB model; e.g., Tavecchio et al. 2000; Celotti et al. 2001). While photon fields associated with the quasar are expected to be more relevant on small scales ( 0.1–2 kpc), for core-dominated RLQs (for which is 7.1 projected kpc and typical inclinations of – correspond to deprojected lengths 10 times greater) the spatially unresolved X-ray emission potentially includes contributions from the jet to tens of kpc. The IC/CMB model is often proposed to explain the X-ray knot emission from low-redshift large-scale RLQ jets studied with Chandra, but here too the consequent predicted strong increase with redshift in the X-ray luminosities of jet knots (absolute or relative to jet radio or non-IC/CMB core X-ray emission; e.g., Schwartz 2002) is to date not observed (e.g., Bassett et al. 2004; Lopez et al. 2006; Marshall et al. 2011; Saez et al. 2011). While some degree of IC/CMB emission is required, the relative contribution (and associated spatial scales) to the observed X-ray emission is currently unclear.
Some quasars with the highest values of radio loudness () have been studied individually in X-rays (e.g., PMN J05253343, Worsley et al. 2004a; Q 09066930, Romani 2006; RX J1028.60844, Yuan et al. 2005; GB 14284217, Worsley et al. 2004b; GB 15085714, Siemiginowska et al. 2003, Yuan et al. 2003, 2006). These objects are often referred to as “blazars” due to their extreme radio loudnesses and other properties.222The term “blazar”, including subcategories of BL Lac objects and optically violently variable quasars (e.g., see §1.3 of Krolik 1999), has been defined based on a set of criteria, including the equivalent widths of emission lines, the non-thermal jet-linked contribution to the optical continuum, broad-band variability, the radio spectral shape, and the polarization. However, this terminology has sometimes been applied either inconsistently or based on incomplete information. For our objects, it is often not feasible to classify them clearly as “blazars” based on available data. All of them are broad-line quasars (i.e., not BL Lac objects). All but one (J09135919) of our objects have flat radio spectra (see §3). In this work, we have made minimal use of the term “blazar”. Instead we define a highly radio-loud quasar sample based on radio loudness (see §2 for details). Most of the previous studies were focused on their X-ray spectral properties. These objects often show soft X-ray spectral flattening; the fraction of objects with such flattening appears to rise with redshift (e.g., Fiore et al. 1998; Page et al. 2005; Yuan et al. 2006). This flattening has been proposed to be caused by intrinsic X-ray absorption with a column density of – cm-2 (but also see Behar et al. 2011). This level of intrinsic X-ray absorption is also found in one quasar with moderate radio loudness (SDSS J00111446; Saez et al. 2011). An alternative mechanism for the soft X-ray spectral flattening is the bulk Comptonization of broad-line photons by relativistic plasma moving along the RLQ jet (e.g., Begelman & Sikora 1987; Sikora et al. 1997). Celotti et al. (2007) studied the time-dependent spectra generated by this mechanism and reproduced the soft X-ray flattening feature in the XMM-Newton spectrum of GB 14284217. Volonteri et al. (2011) studied hard-X-ray-selected high-redshift blazars and found a deficit of RLQs at compared to the expectations from the number of blazars. Possible explanations of this deficit require either a decrease of average bulk Lorentz factor in relativistic jets or an increase by a factor of 2–10 in the number of very massive black holes () at high redshifts (derived from the radio luminosity function). They stressed the importance of finding high-redshift blazars which could provide constraints on the SMBH-dark halo connection and structure formation.
Although these highly radio-loud quasars (HRLQs hereafter) are rare, they produce among the most powerful relativistic jets in the Universe. These remarkable objects have required the larger sky coverage of modern wide-field optical/UV and radio surveys to be discovered in sufficient numbers to assemble a statistically meaningful sample at high redshift. Current major X-ray missions provide coverage of the 2–40 keV energy band in the rest frame of HRLQs. Studies of the X-ray and broad-band properties of high-redshift HRLQs provide probes of the jet-launching and radiation mechanisms in the early stages of cosmic evolution (e.g., Fabian et al. 1998, 1999). However, there has not been a systematic survey to investigate the general properties of these remarkable HRLQs at . Miller et al. (2011; M11 hereafter) studied the X-ray properties of a large, diverse sample of RLQs333M11 defined “RLQs” as quasars with , while objects with were classified as radio-intermediate quasars (RIQs). To simplify the terminology, we refer to all quasars with as RLQs in this work. with wide ranges of redshift and radio loudness. However, HRLQs at only made up of their full sample. In this work, we conduct the first X-ray survey of a sample of HRLQs at using new X-ray observations by Chandra and sensitive archival X-ray data. Our science goals include the following: (1) assess any X-ray emission enhancement of these objects and compare them to HRLQs at lower redshift; (2) provide constraints on the basic X-ray spectral properties of the newly observed Chandra targets, and study the relation between X-ray spectral properties and radio loudness; (3) investigate relations between relative X-ray brightness, radio loudness, and optical/UV emission-line properties; and (4) study the broad-band spectral energy distributions (SEDs) of our objects.
2. Sample Selection
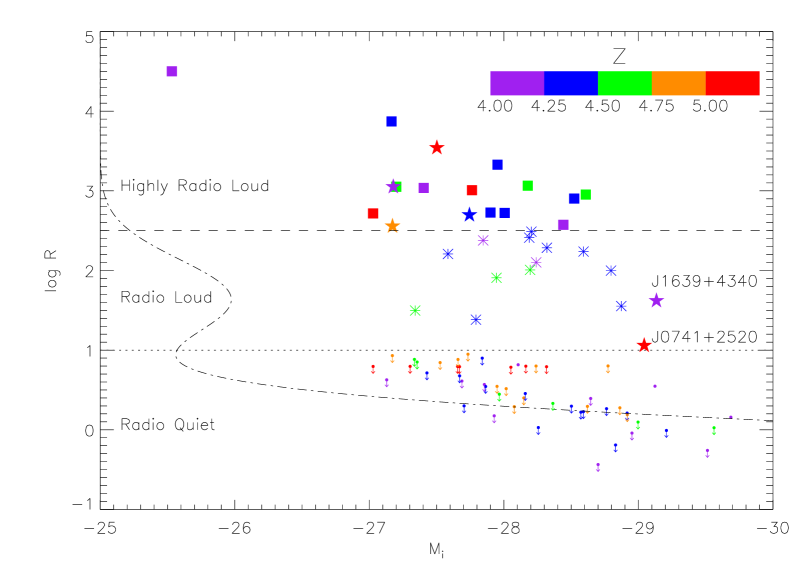
We began our sample selection from the SDSS Data Release 7 (DR7; Abazajian et al. 2009) quasar catalog (Schneider et al. 2010) which covers 9380 deg2 of sky area. We searched for RLQs satisfying one or both of the following criteria: (1) (); (2) . Seven objects were first selected via this method. We also added another object (J07412520) which does not have SDSS spectroscopy, but was confirmed as a very luminous () RLQ in follow-up optical/UV spectroscopy of radio-selected SDSS sources (McGreer et al. 2009). Among the SDSS-covered RLQs without sensitive X-ray coverage, these eight objects have the most remarkable radio and/or optical properties. They are ideal targets, with high radio loudness, high optical luminosity, and high redshift, for economical Chandra snapshot observations. Six of the eight objects were awarded Chandra time in Cycle 12 (see Table 1 for an X-ray observation log). Four of the six targets (J10262542, J14120624, J14201205, and J16592101) have radio loudness . We define this radio-loudness value as the threshold for being “highly radio loud”. RLQs satisfying this criterion represent the top of the RLQ population in terms of radio loudness (see the dash-dotted curve in Fig. 1). We note that Sbarrato et al. (2012b) have also recently studied J10262542, claiming that it is a blazar. The other two targets (J07412520 and J16394340) are only moderately radio loud (with and , respectively), but they are the most optically luminous () RLQs at that have sensitive X-ray coverage (see Fig. 1).
In addition to our Chandra Cycle 12 targets, we further searched for other HRLQs at satisfying our criterion in the sky area north of using the NASA/IPAC Extragalactic Database (NED).444http://ned.ipac.caltech.edu/. The sky area north of is covered by the 1.4 GHz NVSS survey, and thus we are able to calculate the radio loudness for each object. In fact, for typical RLQs identified in current wide-field surveys (), if an object satisfies our criterion for being a HRLQ, it should have been detected by NVSS according to the NVSS sensitivity ( mJy). Therefore, our selection method should not introduce incompleteness owing to the radio-flux limit.555However, it is still possible that some relevant HRLQs at have not been identified due to the lack of optical/UV spectroscopic follow up. Therefore it is not possible to generate a fully complete sample of HRLQs at present with available databases. For objects with both FIRST and NVSS detections, we adopt the radio-flux values from the FIRST catalog due to its better sensitivity; the radio flux values in the FIRST and NVSS catalogs are generally consistent with each other. A total of 24 HRLQs at were identified. We checked for sensitive archival X-ray coverage for these HRLQs by Chandra, XMM-Newton, ROSAT,666We required the ROSAT observations to be pointed observations (i.e., not ROSAT All-Sky Survey) with an exposure time greater than 5 ks and an off-axis angle less than (i.e., within the inner ring of the PSPC detector) to achieve adequate sensitivity. However, none of the HRLQs is covered by ROSAT observations satisfying these criteria. or Swift. Thirteen have sensitive archival X-ray coverage (see Table 1),777Only one known HRLQ (PKS B1251407) with sensitive X-ray coverage lies south of , and thus is not included in our sample. See Yuan et al. (2006) for the X-ray properties of this object. while the other 11 do not (see Table 2).888The NED lists SDSS J112429.62283125.8 as a quasar based on SDSS DR6 data. However, the redshift of this object provided in the SDSS DR7 quasar catalog is . Therefore we do not consider this object as a HRLQ although it satisfies our criterion. This object does not have sensitive X-ray coverage. Table 1 and Table 2 together provide a complete list of known HRLQs at in the sky area north of . All of the 13 objects having sensitive archival X-ray coverage are detected in X-rays; all of them were targeted in their relevant X-ray observations except for SDSS J12350003. The archival Chandra, XMM-Newton, or Swift observations of four objects (PMN J11553107, SDSS J12350003, GB 17132148, and PMN J19510134) are reported in this work for the first time. Some of the archival objects have been classed as “blazars” and were covered by multiple X-ray observations (see §1). They were usually selected from radio (e.g., Green-Bank 6 cm, GB6, Gregory et al. 1996; the Parkes-MIT-NRAO survey, PMN, Griffith & Wright 1993) or X-ray (e.g., the ROSAT All Sky Survey, Voges et al. 1999) surveys. The individual X-ray properties of these blazars have been studied in detail (see the last column of Table 1 for references). In this work, we combine the 13 archival sources and the 4 newly observed HRLQs to form a sample to perform general systematic studies of HRLQs at high redshift. Our sample of HRLQs at with sensitive X-ray coverage thus includes 17 objects, eight of which have their X-ray properties presented for the first time in this work.
We searched for high-resolution radio images of these objects obtained by the Very Long Baseline Array (VLBA) or Very Long Baseline Interferometry (VLBI); seven of them have available high-resolution images. Two objects have point-like source profiles and no indications of extended radio emission (J09135919, Momjian et al. 2004; J12350003, Momjian et al. 2004). Another three objects have clear extended radio emission on milliarcsecond (mas) scales from relativistic jets although their extended radio emission only contributes of the total radio flux (Q 09066930, Romani et al. 2004; GB 15085714, Cheung 2004, Helmboldt et al. 2007; GB 14284217, Cheung et al. 2012). The extended radio emission of GB 15085714 coincides with the extended X-ray emission, showing the signature of a relativistic jet (Cheung 2004). The extended radio feature of GB 14284217 in its VLA imaging at observed-frame 1.4 GHz and 4.9 GHz (Cheung et al. 2012) lies away from the core. It also coincides with the extended X-ray emission found in its Chandra observation. GB 14284217 furthermore shows mas-scale extended radio emission in its VLBI images at observed-frame 2.3 GHz and 8.6 GHz. The extended radio emission of J10262542 is on a mas scale; it contributes of the total radio flux (Helmboldt et al. 2007). The mas-scale extended radio emission of the other object, J16592101, contributes of the total radio flux at observed-frame 1.6 GHz, while the image of this object at observed-frame 5 GHz shows no evidence of extended radio emission (Frey et al. 2010).999We also found high-resolution radio images for two HRLQs without sensitive X-ray coverage listed in Table 2. The VLBI image of J08133508 shows jet-like resolved structure at observed-frame 1.6 GHz, which contributes of the total flux, while its image at observed-frame 5 GHz does not have evidence of extended emission (Frey et al. 2010). J12425422 has extended radio emission in both of its VLBI images at observed-frame 1.6 GHz and 5 GHz, where the extended emission only contributes of the total fluxes (Frey et al. 2010). The five objects with extended radio emission have higher radio loudness on average () than the three objects without extended radio emission ().
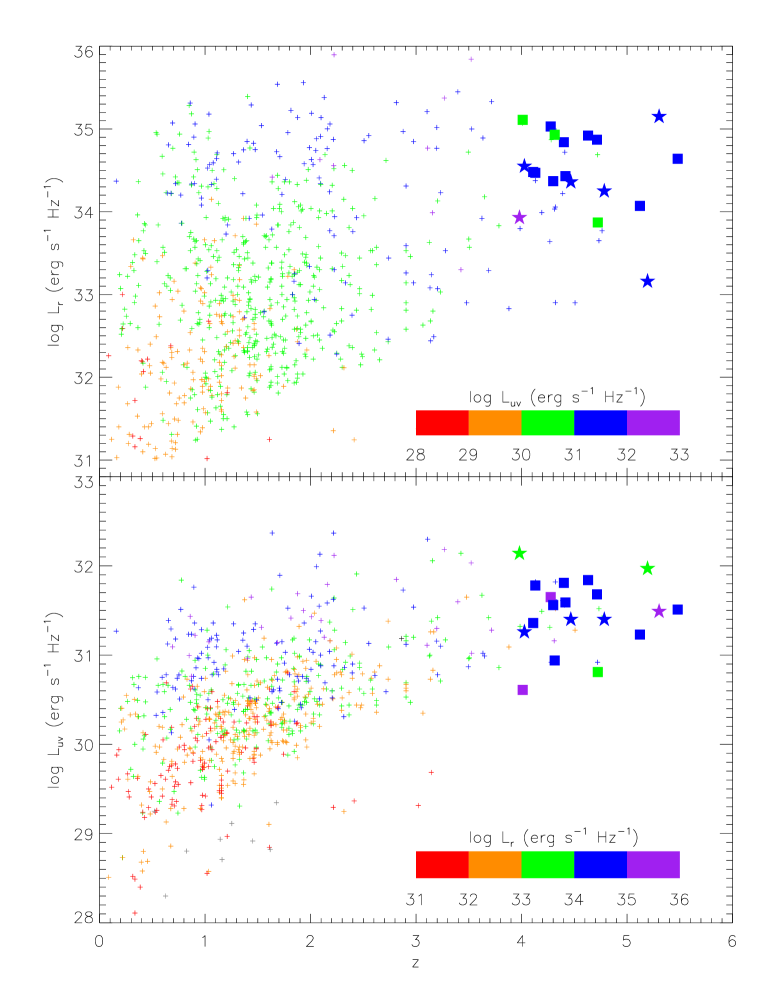
Besides the 17 HRLQs at , we will also separately discuss the two highly optically luminous RLQs observed by Chandra in Cycle 12 even though they do not satisfy the “highly radio loud” criterion. All of our 19 objects are among the most-luminous RLQs in both the radio and optical/UV bands (see Fig. 2). The monochromatic luminosity ranges of our objects are – erg s-1 Hz-1 in the radio (at rest-frame 5 GHz) and – erg s-1 Hz-1 in the optical/UV (at rest-frame 2500 Å). GB 17132148 has remarkable properties even compared to other HRLQs in our sample. It is much fainter (by a factor of ) in the optical band, and it has the highest radio loudness (see Fig. 1). Its radio loudness is also higher than those of most of the objects () in the full sample of M11. All of our objects are spectroscopically confirmed broad-line quasars by either the SDSS or other observations. They have precise redshift measurements based on their broad emission lines (e.g., Ly and/or C iv). The available SDSS spectra of nine objects (five Chandra Cycle 12 targets and four archival sources) are shown in Fig. 3.
3. X-ray Data Analysis
The six RLQs at targeted by Chandra in Cycle 12 were observed with the S3 CCD of the Advanced CCD Imaging Spectrometer (ACIS; Garmire et al. 2003). The Chandra data were reduced using standard CIAO v4.3 routines. We generated X-ray images for the observed-frame soft (0.5–2.0 keV), hard (2.0–8.0 keV), and full (0.5–8.0 keV) bands using ASCA grade 0, 2, 3, 4, and 6 events. The source detection was performed using the wavdetect algorithm (Freeman et al. 2002) with a detection threshold of and wavelet scales of , , , , and pixels. All targets were clearly detected by Chandra within of the optical coordinates. To assess possible extended X-ray emission from a putative jet, we followed the method in §2.3 of Bassett et al. (2004) requiring a minimum of nearby counts offset from the core by along roughly the same direction. None of our targets shows evidence for extended X-ray emission. The X-ray counts were measured with aperture photometry using the IDL aper procedure. The aperture radius was adopted as for each source ( enclosed energy for the soft band, enclosed energy for the hard band; aperture corrections were applied). The background counts were retrieved from an annular region with inner and outer radii of twice and three times the aperture radius, and were scaled to the source-aperture area. All background regions are free of X-ray sources. Table 3 lists the X-ray counts in the three bands defined above, as well as the band ratio (defined as the ratio between hard-band and soft-band counts) and effective power-law photon index for each source. The effective photon index was derived from the band ratio with the Chandra PIMMS101010http://cxc.harvard.edu/toolkit/pimms.jsp tool, under the assumption of a power-law model with only Galactic absorption.
The X-ray properties of the archival objects were obtained from the literature (see Table 1) except for those objects listed in Table 3 for which their archival Chandra, XMM-Newton, or Swift observations have not been previously published. For objects with multiple X-ray observations, we chose the Chandra/XMM-Newton observation with the longest exposure time.111111We did not use the XMM-Newton observation with the longest exposure time for GB 14284217 because this object was undergoing an exceptional radio flare (see Worsley et al. 2006). This approach should not introduce any biases in the following considerations regarding the X-ray emission strength. Vignali et al. (2003a) reported a tentative detection of GB 17132148 using a ROSAT HRI observation. This object was later observed with Chandra ACIS in Cycle 5 (PI: L. Gurvits). We processed the Chandra data for GB 17132148 using the same method as described in the previous paragraph. The X-ray flux of GB 17132148 in the Chandra epoch is consistent with that in the ROSAT epoch, showing that this object did not have any strong X-ray variability.
SDSS J12350003 was serendipitously covered by an XMM-Newton observation on 2010 July 01. We performed
data reduction and processing with standard XMM-Newton Science Analysis System (SAS; v10.0.0) routines.
X-ray images were generated for the observed-frame soft, hard, and full bands for the MOS1 and
MOS2 detectors; this object is not covered by the pn detector.
Source detection was carried out using the eboxdetect procedure. This
object was detected only in the MOS1 full-band image at a level,
and thus we only used the MOS1 image for
its X-ray photometry (it was not detected in the MOS2 images because it is very close to the
CCD edge). We filtered the events file by removing the periods of background flaring (49% of
the total exposure time). The aperture radius for the photometry () was the 90% enclosed-energy
radius at 1.5 keV based on the point spread function (PSF) of the MOS1 detector at an off-axis angle
of . The upper limits on X-ray counts in the soft and hard bands were calculated as ,
where is the total counts in the aperture. The vignetting was corrected by calculating the effective
exposure time (4.2 ks) at the source location based on the exposure map.
Another two archival objects, PMN J11553107 and PMN J19510134, were targeted by the Swift X-ray Telescope (XRT; Burrows et al. 2005) in two (ObsIDs: 00036263001/2, total exposure time 5.1 ks) and three (ObsIDs: 00036791001/2/3, total exposure time 10.4 ks) observations, respectively. For each object, we first generated the exposure maps for all XRT events files using the xrtexpomap routine. We then merged the event files and exposure maps for each object using the xselect and ximage packages, respectively. Similar to the approach for the Chandra and XMM-Newton data, XRT images were created for the observed-frame soft, hard, and full bands. Source detection was performed with the wavdetect algorithm with a detection threshold of . PMN J11553107 is detected in the full band and soft band, while PMN J19510134 is detected in all three bands. Aperture photometry was performed using aperture radii of and , which are the enclosed-energy radii in the full band based on the PSF of the XRT detector at off-axis angles of and ,121212The Swift mission has excellent rapid pointing capability, while its pointing accuracy is not exceptional. Therefore, it is normal to have off-axis angles of –2′ for targeted observations. respectively. The X-ray photometry of these two archival objects is also listed in Table 3.
Table 4 lists the key X-ray, optical, and radio properties of our sample:
Column (1): The name of the quasar.
Column (2): The apparent SDSS -band magnitude of the quasar. For objects covered by the SDSS footprint, the values are obtained either from the SDSS DR7 quasar catalog (BEST photometry; Schneider et al. 2010) or from the SDSS database. For other objects, the -band magnitude was converted from AB1450(1+z) under the assumption of a power-law spectral index of (; e.g., Vanden Berk et al. 2001). The values of AB1450(1+z) were calculated from -band magnitudes (from the NED) using the empirical relation of (Kaspi et al. 2000; Vignali et al. 2003a).
Column (3): The absolute SDSS -band magnitude for the quasar, , from the SDSS DR7 quasar catalog, which was calculated from the apparent SDSS -band magnitude in Column 2 by correcting for Galactic extinction and assuming a power-law spectral index of .
Column (4): The Galactic neutral hydrogen column density calculated with the Chandra COLDEN131313http://cxc.harvard.edu/toolkit/colden.jsp tool (Dickey & Lockman 1990; Stark et al. 1992), in units of cm-2.
Column (5): The count rate in the observed-frame soft X-ray band (– keV) for the Chandra observed objects, in units of s-1.
Column (6): The X-ray flux in the observed-frame soft band (– keV) corrected for Galactic absorption. This measurement was obtained with the Chandra PIMMS tool and is in units of erg cm-2 s-1. An absorbed power-law model was used with the photon index () listed in Column 9 and the Galactic neutral hydrogen column density () listed in Column 4. For objects without information or only with lower limits upon , we adopt which is typical for radio-loud quasars (e.g., Page et al. 2005).
Column (7): The X-ray flux density at rest-frame 2 keV generally obtained from the count rate in the observed-frame 0.5–2.0 keV band with PIMMS, in units of erg cm-2 s-1 Hz-1 and corrected for Galactic absorption. Although for our objects rest-frame 2 keV corresponds to observed-frame 0.3–0.4 keV, we chose the standard approach to using the observed-frame 0.5–2.0 keV band because we are able to minimize effects from potential intrinsic X-ray absorption and X-ray instrumental contamination below observed-frame 0.5 keV, and we can also obtain better photon statistics with the larger numbers of X-ray counts in this band.
Column (8): The logarithm of the quasar luminosity (erg s-1) in the rest-frame 2–10 keV band corrected for Galactic absorption.
Column (9): The power-law photon index () of the X-ray spectrum. For objects listed in Table 3, the values were obtained from band-ratio analysis (see the last column of Table 3). For the other objects, the values were retrieved from the literature. Some objects have shown X-ray spectral variability (e.g., GB 1428+4217; see Fig. 4 of Worsley et al. 2006). The choice of values do not significantly affect the X-ray flux calculation. We have chosen the Chandra/XMM-Newton observations with the longest exposure time which should best constrain the power-law photon index.
Column (10): The continuum flux density at rest-frame 2500 Å in units of erg cm-2 s-1 Hz-1. For objects appearing in the SDSS DR7 quasar catalog, the values were obtained from the catalog of Shen et al. (2011). For other SDSS covered objects, the flux density was calculated using the SDSS photometry with the composite spectrum for SDSS quasars in Vanden Berk et al. (2001). For objects not covered by the SDSS, the flux density was calculated using the optical photometry from the literature under the assumption of a power-law spectral index of .
Column (11): The logarithm of the monochromatic luminosity (erg s-1 Hz-1) at rest-frame 2500 Å, which was calculated from the flux density at rest-frame 2500 Å given in Column 9. A standard cosmological bandpass correction was applied when converting flux into monochromatic luminosity.
Column (12): The radio power-law slope () between observed-frame 1.4 GHz and 5 GHz. The 1.4 GHz flux density was obtained from the FIRST or NVSS surveys, while the 5 GHz flux density was obtained from the GB6 survey, the PMN survey, or from the literature for individual objects (J16394340, Holt et al. 2004; Q 09066930, Romani 2006; J09135919, Momjian et al. 2004). The observations at 1.4 GHz and at 5 GHz are not simultaneous. All objects with measurements are flat-spectrum radio quasars (FSRQs; ) except for J09135919. For the five objects without 5 GHz flux measurements, we assume to keep consistency with other objects in our sample.
Column (13): The logarithm of the monochromatic luminosity (erg s-1 Hz-1) at rest-frame 5 GHz, obtained from the flux density at rest-frame 5 GHz, . This quantity was calculated using a radio power-law slope given in Column 12 and the flux density at observed-frame 1.4 GHz, , which were obtained from the FIRST or the NVSS surveys. A standard cosmological bandpass correction was also applied.
Column (14): The logarithm of the radio-loudness parameter, given by
| (1) |
The denominator, , was calculated from using an optical power-law slope of = . The numerator, , was calculated using the same method as in Column 13. All measures of flux density are per unit frequency. The definition of radio loudness in M11 used as the denominator. We converted their values to our definition for the scientific analyses described in the following section.
Column (15): The parameter, defined by
| (2) |
which represents the slope of an assumed power law connecting rest-frame 2500 Å and 2 keV. Our UV and X-ray measurements were not simultaneous, and thus the parameter could be affected by variability.
Column (16): , defined as
| (3) |
The expected value for a typical RQQ is calculated from the – correlation given as Equation (3) of Just et al. (2007). The statistical significance of this difference compared to RQQs (given in parentheses) is in units of , which is given in Table 5 of Steffen et al. (2006) as the RMS of for several ranges of luminosity. The parameter quantifies the excess of X-ray emission from the relativistic jet of the RLQs compared to that of RQQs for which the X-ray emission is mainly from the accretion disk and its corona. In §4.2 we will validate the use of as a useful diagnostic quantity for HRLQs.
Column (17): , defined as
| (4) |
The expected value for a typical RLQ is obtained from the –– correlation based on the full sample in M11 given in their Table 7, which is equivalent to
| (5) |
The parameter assesses the relative X-ray brightness of a RLQ compared to typical RLQs (mostly at – and with a median redshift of ) with similar optical/UV and radio luminosities that have both disk/corona-linked and jet-linked X-ray emission.
4. Results and Discussion
4.1. Enhanced X-ray Emission at High Redshift
4.1.1 The Relative X-ray Brightness of HRLQs
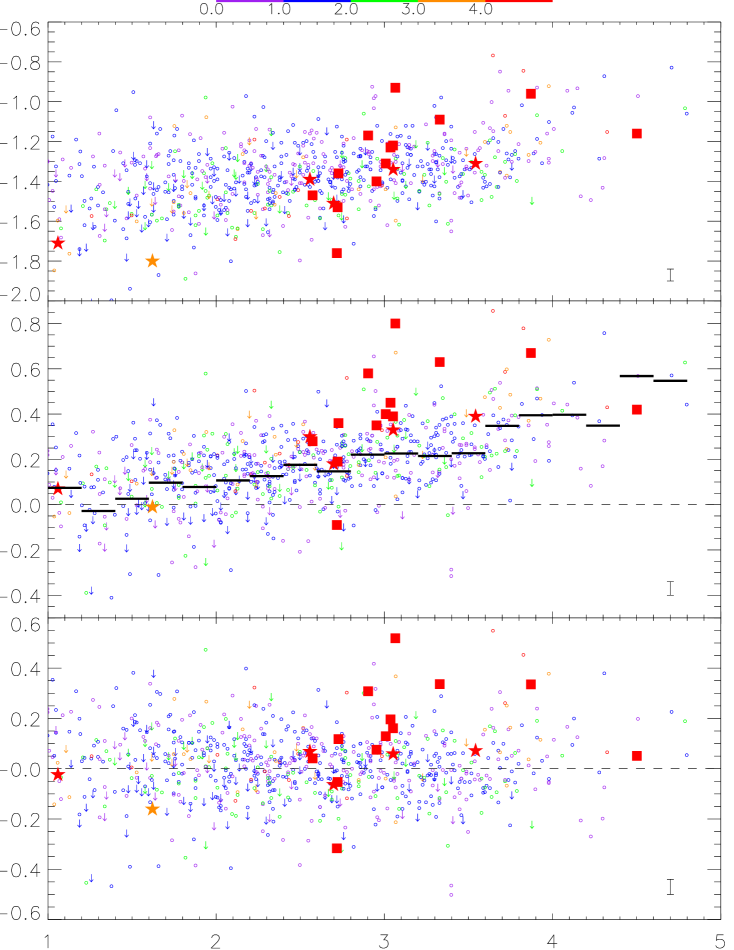
To assess the enhancement of the X-ray emission of our objects at compared to similar objects at lower redshift, we compare their distributions of , , and to those of RLQs at . Fig. 4 shows the positions of our objects and the typical RLQs in M11 in the –(, , ) planes. Our objects generally occupy the same region as the typical RLQs in the – plane (see the top panel of Fig. 4). However, our sample appears to have an excess of objects with stronger X-ray emission in the –(, ) planes. The thick black lines in the middle panel of Fig. 4 show the mean values of M11 objects binned by radio loudness ( per bin). Fifteen out of our 17 HRLQs at have values greater than the mean value of the corresponding bin. Similarly, 14 of our 17 HRLQs at have values greater than zero, which generally represents the mean value of M11 objects (see the bottom panel of Fig. 4). We will show later that the generally higher and values of our objects are caused by stronger X-ray emission rather than weaker optical/UV emission (see the broad-band SED studies on our objects in §4.4). It is worth noting that the X-ray weakest object in our HRLQ sample (J09135919; see the red square with the smallest and values in Fig. 4) has a steep radio spectral slope (), while the others with available values are all FSRQs.
To verify this excess quantitatively, we obtained the mean values and statistical distributions of and for our HRLQs and a comparison sample consisting of objects in the full sample141414The full sample of M11 contains a mixture of objects that are optically selected (), radio selected (), or X-ray selected (). of M11 with and . Our sample, which includes objects originally selected in the optical (7 objects; e.g., SDSS), radio (9 objects; e.g., GB6 and PMN), or X-ray (1 object; from the ROSAT All-Sky Survey) bands, is somewhat heterogeneous. To minimize potential selection biases (e.g., the most exceptional objects being preferentially targeted in X-ray observations), we need a sample containing most of the known HRLQs regardless of their selection methods and having nearly complete X-ray coverage. To achieve this goal, we chose an optical-magnitude cut of on all known HRLQs north of (see Table 1 and Table 2). There are 15 HRLQs at satisfying this cut, and 12 of them have sensitive X-ray coverage (and thus are included in our sample). For the three HRLQs without sensitive X-ray coverage, two of them (J08133508 and J12425422, both optically selected) were in our original Chandra Cycle 12 proposal, but were not awarded Chandra time (see §2). These two objects have the highest redshifts, optical brightnesses, and optical luminosities among those HRLQs without sensitive X-ray coverage (see Table 2). The -band magnitude of the other HRLQ (J22200025, optically selected) is close to our cut. To maintain consistency, we also applied the criterion to our comparison sample from M11. There are 283 objects in total in our comparison sample, including 269 X-ray detected objects and 14 objects with X-ray upper limits.
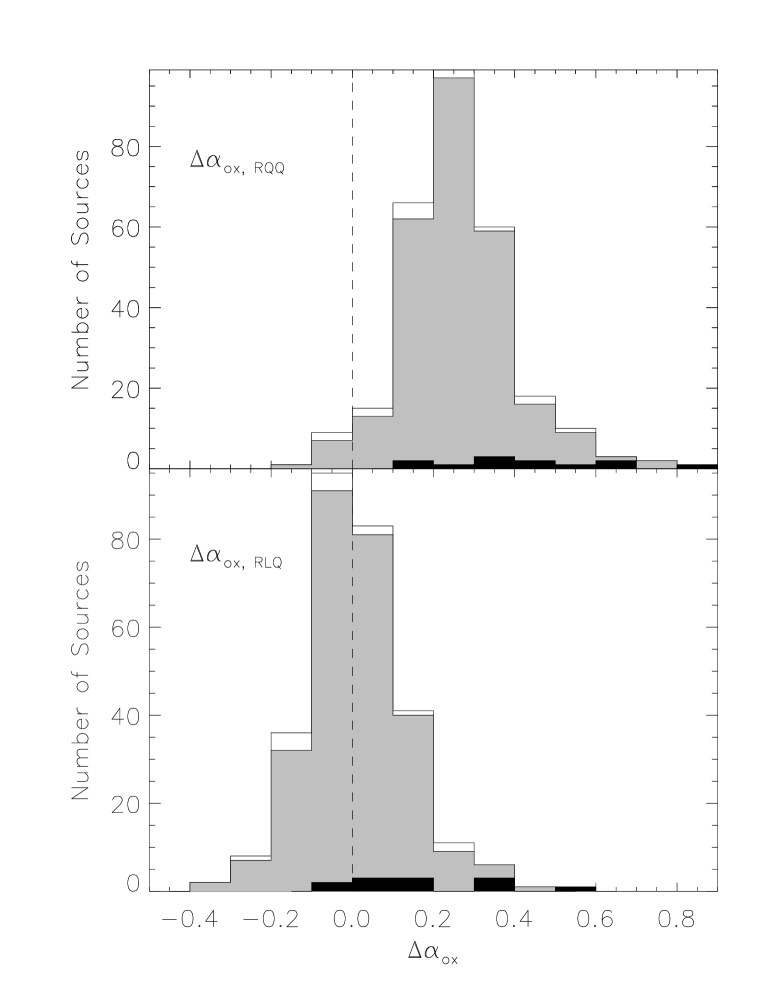
The mean values of and shown in Table 5 were calculated using the Kaplan-Meier estimator151515The Kaplan-Meier estimator is applicable to censored data; note some of the M11 data points are censored. implemented in the Astronomy Survival Analysis (ASURV) package (e.g., Lavalley et al. 1992). These mean values indicate that HRLQs at have stronger X-ray emission (by a factor of on average) than those at with similar UV and/or radio luminosity. The distributions of and are shown in Fig. 5. The Peto-Prentice test (e.g., Latta 1981), also implemented in the ASURV package, was employed to determine whether the and HRLQs follow the same and distributions. The Peto-Prentice test is preferred over other two-sample tests because it is the least affected by factors such as unequal sample sizes (e.g., Latta 1981) which do exist in our study. The distribution of for our objects is significantly different from that of the HRLQs at . The null-hypothesis (i.e., the two samples following the same distribution) probability is only . The two-sample test for the distribution reaches a similar conclusion; the null-hypothesis probability is slightly higher (), but it still shows that the two samples follow different distributions at a level. One might speculate that the significant differences of the distributions are caused by a “tail” of objects with extraordinary X-ray brightness. However, Fig. 5 suggests that the entire histograms of our HRLQs are shifted toward high values relative to those of HRLQs (also see Fig. 4). Therefore, our sample of HRLQs shows a significant X-ray emission enhancement at over those HRLQs at lower redshift. However, one should keep in mind that although we have compiled a sample of HRLQs with nearly complete X-ray coverage using all available databases, potential selection biases could still exist. For example, although we have assembled all known HRLQs north of , this is still not a fully complete sample (see Footnote 11). Therefore, in the next subsection we describe a variety of tests of the robustness of our results.
4.1.2 Robustness Tests
In order to test the robustness of our results against selection issues, we carried out further two-sample analyses by constructing other comparison samples or controlling for a variety of relevant parameters (see results in Table 5):
-
1.
Many of our HRLQs are radio selected, while the majority of our comparison sample from M11 is optically selected. To minimize the effects of different selection methods, we first compare our radio-selected HRLQs with a radio-selected subsample in M11. We chose their “Einstein” supplemental sample (see §2.2.1 of M11) which was primarily radio selected. The X-ray observations of these objects were first presented in Worrall et al. (1987), and we transform their luminosities to our adopted cosmology. We also incorporate improved X-ray coverage for a handful of objects, as in M11. All of these objects have and ;161616The values were estimated from their monochromatic luminosities at rest-frame 2500 Å. we further require them to be HRLQs (i.e., ). Our HRLQs have significantly different distributions (both and ) from those of this radio-selected comparison sample at a level.
-
2.
We generate a quasi-radio-selected comparison sample following §2.1.1 of M11 by only selecting those objects that were targeted by SDSS spectroscopy owing to being FIRST radio sources (i.e., with the “FIRST” flag set in the SDSS quasar catalog).171717This is not a true radio-selected sample because, e.g., they were restricted by SDSS magnitude limits for FIRST sources. See §2.1.1 of M11 for details. Our HRLQs have significantly different distributions from those of this “radio-selected” comparison sample at a level.
-
3.
As discussed in §2, our HRLQs are among the RLQs with the highest radio luminosities; this may introduce a luminosity bias into our sample. As discussed in Ghisellini et al. (2011), for example, more luminous blazars have relatively more hard X-ray emission (because the peak photon energy shifts to lower frequencies), and this could make the observed X-ray flux greater for high-redshift blazars. Therefore, we construct another comparison sample from M11 to have comparable radio luminosity (; compare with Fig. 2). After controlling for radio luminosity, the significance of the difference in the distributions becomes slightly lower, but still remains at a level.
-
4.
Similarly, we construct another comparison sample to have comparable optical/UV luminosity (; compare with Fig. 2) to our HRLQs to avoid optical/UV luminosity bias. The significance of the distribution difference is at a level after controlling for optical/UV luminosity.
-
5.
All of our HRLQs with available are FSRQs (; see §3) except for J09135919181818This object is not included in our two-sample tests since it does not satisfy ., which may suggest that low-inclination RLQs are over-represented in our sample. Therefore, for another comparison sample, we selected the M11 full-sample objects with available measurements that satisfy the FSRQ criterion. After controlling for this effect, our results still have significance.
In summary, our finding that HRLQs have a substantial X-ray emission enhancement over HRLQs at lower redshifts remains significant after controlling for those factors which may introduce biases. We also note that, owing to the respectable sizes of the samples being compared, variability effects upon distributions should tend to average out (also see §3 for explanation of how our selection of the X-ray observations utilized was designed to avoid biases due to variability).
It is possible that this X-ray enhancement of HRLQs is not solely confined to but arises at lower redshift. To investigate this briefly, we compared the and distributions of –4 HRLQs (9 objects) in the full sample of M11 with those of HRLQs (274 objects), and found they are different at a level (see Table 6; –4 HRLQs have both larger and values which indicate an X-ray emission enhancement by a factor of ). However, the values of –3 HRLQs (39 objects) follow a similar distribution to that of HRLQs (235 objects; level difference). For the parameter, although its distribution for –3 HRLQs is different from that of HRLQs at a level, the mean value of –3 HRLQs is slightly lower than that of HRLQs ( vs. ). Therefore, the above tests suggest that the X-ray emission enhancement of HRLQs begins to arise at . This statistically independent result from –4 also supports the robustness of our findings of a HRLQ X-ray emission enhancement at . Furthermore, after combining the samples of HRLQs and –4 HRLQs, we find that HRLQs have an X-ray emission enhancement over HRLQs at a significance level corresponding to a null-hypothesis probability of (also see Table 6).
4.1.3 Relevant Physical Considerations Regarding the X-ray Emission Enhancement
Our results suggest that the most-luminous relativistic jets generate stronger X-ray emission in the early universe. Previous studies by Bassett et al. (2004) and Lopez et al. (2006) that included a mix of HRLQs (including a subset of those in our sample) and moderately radio-loud quasars found that high-redshift objects did not show substantially stronger X-ray emission compared to a lower-redshift sample of RLQs detected by ROSAT (from Brinkmann et al. 1997). We assess further these previous results by performing a similar two-sample analysis on the moderately radio-loud quasars () in the full sample of M11 (which includes the moderately radio-loud objects from Bassett et al. 2004 and Lopez et al. 2006). The distribution of moderately radio-loud quasars (10 objects; all X-ray detected) is different from that of moderately radio-loud quasars (280 objects with 48 X-ray upper limits) at a level, while the values of moderately radio-loud quasars follow a similar distribution to that of moderately radio-loud quasars ( level difference). Therefore, there is no firm evidence that moderately radio-loud quasars have a significant X-ray emission enhancement compared to those at lower redshift (recall also from §1 that RQQs show no evolution in X-ray properties with redshift). This suggests that the X-ray enhancement in high-redshift HRLQs occurs within the jet-linked component, which likely (e.g., M11) contributes an increasing fraction of the X-ray continuum with increasing radio-loudness values.191919It is obviously also possible, but not required, that the jet-linked X-ray generation mechanism of HRLQs differs from (and is more sensitive to redshift than) that of moderately radio-loud quasars.
The enhancements in relative nuclear X-ray emission we find for HRLQs are less than would be predicted for an X-ray jet-linked component dominated by IC/CMB emission, which possesses a strong dependence on redshift (e.g., Schwartz 2002; see 1). For example, the median redshift for the RLQs from Miller et al. (2011) with , , and is . If the jet-linked contribution to the nuclear X-ray emission is at least 50% at , as is a conservative estimate for RLQs with (e.g., Zamorani et al. 1981; Figure 7 of M11), then for a pure IC/CMB X-ray jet the overall enhancement in the nuclear X-ray emission at would be 16, corresponding to an increase in of 0.46. However, our HRLQs only show an increase in of 0.15–0.20 (see Table 5). Instead, our results are consistent with an X-ray jet-linked component in which the fractional contribution from the IC/CMB process at is 6% of the nuclear X-ray emission, with the balance of the jet-linked X-ray emission arising from inverse Compton scattering of other seed photon fields such as radiation from the broad-line region or dust (e.g., Sikora et al. 2009), from the jet synchrotron emission itself (e.g., Sokolov et al. 2004; Meyer et al. 2012 find that synchrotron self-Compton emission is relatively less important in high-powered jets), or from non-cospatial synchrotron radiation in a structured jet (e.g., Migliori et al. 2012). The overall enhancement to the nuclear X-ray continuum then rises more gradually with redshift; at RLQs would be X-ray brighter by factors of 2.8/1.5/1.1 (relative to a template), corresponding to increases of .
Another possible explanation for the X-ray enhancement is that an increasing contribution of the X-ray emission from the jets is due to the inverse-Compton scattering of the photon field of the host galaxy; e.g., Hardcastle & Croston (2011) provided a detailed modeling of upscattering of host-galaxy photon fields into high-energy emission. The X-ray enhancement of our sample can be explained if the host galaxies of high-redshift HRLQs are more luminous in the infrared/optical band than those at lower redshift. This higher infrared/optical luminosity could be generated by the enhanced star-formation activity of high-redshift host galaxies (e.g., Wang et al. 2008, 2011a; Mor et al. 2012). Smail et al. (2012) found that for the high-redshift (3.6–3.8) radio galaxies in their study, the luminosity of the extended X-ray halo is correlated with the far-infrared luminosity of the galaxy, which supports the X-ray generation mechanism of inverse Compton scattering of the far-infrared photons produced by star-formation activity. Since the cosmic star formation rate density has a broad plateau starting at and running to (e.g., Hopkins & Beacom 2006), one might expect in this model the enhancement to emerge at rather than at 3–4. However, the generally massive host galaxies of quasars may show stronger evolution effects at earlier cosmic times owing to cosmic downsizing (e.g. Cowie et al. 1996; Panter et al. 2007). For example, Archibald et al. (2001) found a evolution of the total infrared luminosity of radio galaxies at high redshifts.
The and parameters are defined based on the X-ray flux density at rest-frame 2 keV, which corresponds to observed-frame – keV for our HRLQs. However, the rest-frame 2 keV flux density was derived from the observed-frame 0.5–2.0 keV count rate (see §3), which means that we have extrapolated the X-ray spectrum to rest-frame 2 keV assuming a single power-law model. It is known that some HRLQs show X-ray spectral flattening below observed-frame 0.5 keV, i.e., an X-ray flux deficit compared to a single power-law model (e.g., Yuan et al. 2006). Therefore, the extrapolation process may have over-estimated the X-ray flux density at rest-frame 2 keV. Although X-ray spectral flattening has also been found in a few objects (e.g., Page et al. 2005), it would not affect the X-ray flux calculation because rest-frame 2 keV is covered by the observed-frame 0.5–2.0 keV band for these objects. To test whether the X-ray emission enhancement we found for HRLQs is caused by this kind of X-ray spectral curvature, we recalculated the and values for our HRLQs utilized in the two-sample analyses above (i.e., those with ) from the count rates in the observed-frame ultrasoft band (0.3–1.0 keV; see results in Table 7) except for the two Swift sources (PMN J11553107 and PMN J19510134) which do not have adequate counts in the ultrasoft band due to the limited sensitivity of the Swift XRT. These values obtained from the ultrasoft band are similar to those we have obtained in §3; the mean difference between them is . If we use the values calculated from the ultrasoft band ( and ) in the two-sample tests above, the distributions of HRLQs and HRLQs are still different at a level. Therefore, X-ray spectral curvature only contributes to a small fraction, if any, of the X-ray emission enhancement of HRLQs over those at lower redshift. In fact, some of the HRLQs without the apparent X-ray spectral curvature (e.g., GB 15085714; Yuan et al. 2006) are among the objects we find to have the strongest X-ray enhancements.
Considering the seven HRLQs with high-resolution radio images (see §2), the five with extended radio emission on mas scales have higher values () on average than those of the two without extended radio emission (). This might be because the objects with extended radio emission have higher average radio loudness (see §2). However, After considering the strength of their radio emission, the objects with extended radio emission still have a higher average value () than that of the objects without extended radio emission () although with substantial uncertainty due to the limited number of objects.
4.2. Optical/UV Broad Emission Lines
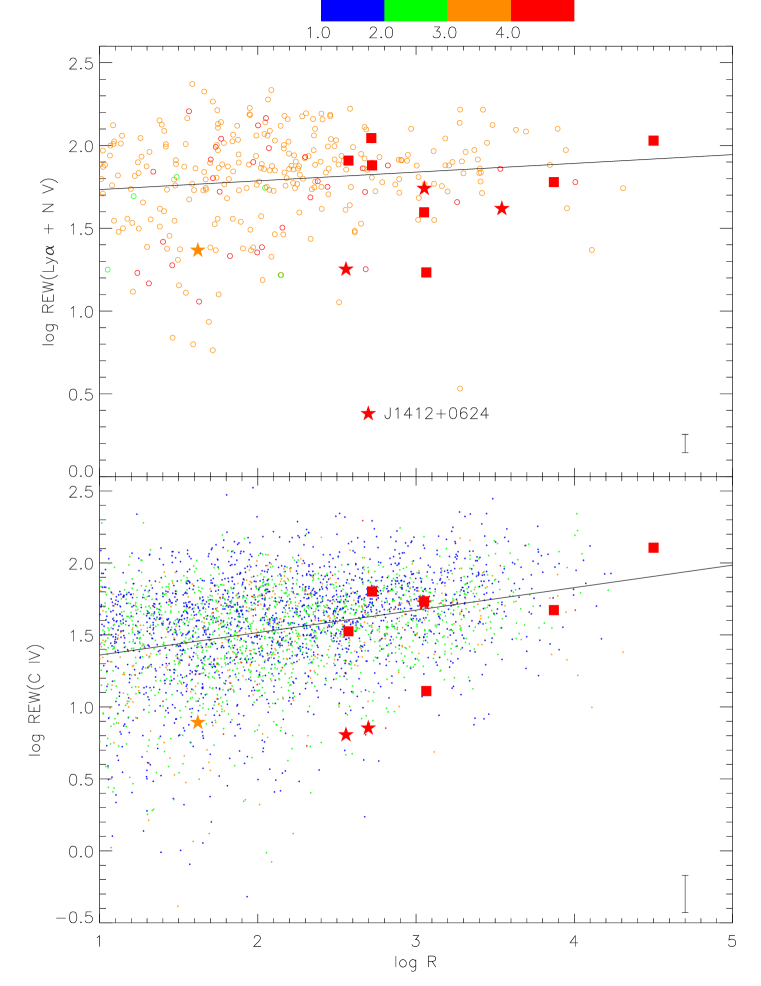
The optical/UV spectra of quasars at usually show prominent broad emission lines such as Ly + N v and C iv (see Fig. 3). For RLQs, if the optical/UV continuum emission is also beamed following the radio emission, one might expect that the emission-line rest-frame equivalent widths (REWs) would be correlated with the beaming of the radio emission. Therefore, we investigate the relation between emission-line REWs and radio loudness for our sample of HRLQs, and compare this relation to that for the majority of RLQs over a wide range of redshift.
For our HRLQs with SDSS spectroscopy, we obtained measurements of REWs from Diamond-Stanic et al. (2009) and Shen et al. (2011) for Ly + N v and C iv, respectively (see Table 8).202020We also list the values of J16394340 in Table 8 and the following Table 9 for reference despite it is a moderately radio-loud quasar. Two objects (J10262542 and J14201205) with SDSS spectroscopy do not have REW(Ly + N v) measurements in Diamond-Stanic et al. (2009).212121Diamond-Stanic et al. (2009) measured the REW(Ly + N v) values for SDSS DR5 quasars (Schneider et al. 2007) at . These two objects are in the SDSS DR7 quasar catalog but not in the DR5 quasar catalog. We measured REW(Ly + N v) for these two sources following the method in §2 of Diamond-Stanic et al. (2009). Available REW measurements for other objects without SDSS spectroscopy were also obtained from the literature (see Table 8). Measurements of REW(Ly + N v) are usually affected by the presence of the Ly forest, so our values likely underestimate the intrinsic strength of Ly. Although the number density of Ly absorbers is known to evolve with redshift (e.g., Weymann et al. 1998; Songaila & Cowie 2002; Janknecht et al. 2006), this effect will not introduce biases to our correlation analyses of emission-line REWs with radio loudness assuming the RLQ radio-loudness distribution does not evolve with redshift. The number of objects in our sample that have emission-line REW measurements is not adequate for reliable correlation analysis. Therefore, we first investigate these correlations for a sample of RLQs across a wide range of redshift, and then see whether our HRLQs follow similar trends. We selected all SDSS DR7 RLQs which have REW(Ly + N v) and REW(C iv) measurements from Diamond-Stanic et al. (2009) and Shen et al. (2011), respectively. Fig. 6 shows the relation between emission-line REWs and radio loudness, for which highly significant positive correlations are found (see Table 10 for the correlation probabilities). Fig. 6 also shows the best-fit linear correlation in the logarithmic parameter space using the IDL linfit procedure,
| (6) |
and
| (7) |
Our HRLQs generally follow the above positive correlations between emission-line REWs and radio-loudness (see the filled stars and squares in Fig. 6), showing that these correlations do not seem to evolve with redshift. These positive correlations are consistent with the results in Kimball et al. (2011a) on REW(Mg ii) and REW(C iv) for SDSS DR5 quasars.222222Kimball et al. (2011a) found positive correlations between the core radio-to-optical flux ratio and the REW values of Mg ii and C iv for SDSS RLQs. The definition of is generally different from that of radio loudness because the latter is defined based on the total radio luminosity. However, the positive correlations in Kimball et al. (2011a) also hold true for their subsample of RLQs without extended radio emission (the “core” morphology class which makes up of their full sample; see their Table 8). In this case, the definition of is similar to that of radio loudness. Therefore, our results are consistent with those of Kimball et al. (2011a). One possible explanation for them is that the broad emission-line region of RLQs may emit anisotropically (see §6.2 of Kimball et al. 2011a). Additionally or alternatively, the decrease in synchrotron peak frequency with increasing peak or kinetic luminosity in FSRQs (e.g., Meyer et al. 2011, their Figure 4) might more stringently limit jet dilution of optical emission-line features in more radio-loud quasars. Our results indicate that for HRLQs with broad emission lines (i.e., not BL Lac objects), the beamed relativistic jets generally have negligible contribution to the optical/UV continua (except for a few outliers with exceptionally weak optical/UV emission lines; see below). This is consistent with recent results from SED studies of HRLQs (e.g., Ghisellini et al. 2010) that their optical/UV emission is disk dominated. Furthermore, this finding of a minimal jet-linked contribution to the optical/UV continuum validates the use of as a diagnostic quantity for our HRLQs; note in Column (16) of Table 4 that the – correlation for RQQs is utilized.
To assess further the jet contribution to the optical/UV continua of our HRLQs, we calculated the non-thermal dominance parameter (NTD ) of the optical/UV continuum following Shaw et al. (2012). is the observed monochromatic continuum luminosity near an emission line ( near C iv in our case), while is the predicted from the relation between continuum luminosity and emission-line luminosity in Shen et al. (2011; see their Equation 14) obtained from typical quasars. represents the optical/UV continuum emission from the accretion disk. NTD means that there is substantial jet-contributed optical/UV continuum. We calculated the NTD values for our HRLQs with SDSS spectroscopy covering the C iv line (see Table 9). Three objects (J14201205, J12350003, and J13251123) have NTD values close to unity, supporting our results that the relativistic jets of our HRLQs generally have little contribution to their optical/UV continua. Another object, GB 15085714 (), may possibly have some jet-linked optical/UV continuum emission. However, its NTD value is consistent with unity considering the scatter of the relation between and ( dex; see §3.7 of Shen et al. 2011). The other two HRLQs (J14120624 and J16592101) have due to their exceptionally weak C iv lines that are discussed further below.
For the REW(Ly + N v)– correlation, it appears that there are a few outliers with exceptionally weak Ly + N v lines (see the upper panel of Fig. 6); they were identified as weak-line quasars (WLQs) by Diamond-Stanic et al. (2009), including one of our Chandra Cycle 12 targets (J14120624). Another HRLQ (J16592101) in our sample has REW(Ly + N v) values (17.9 Å; see Table 8) close to the WLQ criterion of REW(Ly + N v) Å. These two objects also have weak C iv emission lines. Their REW(C iv) values are below the negative deviation from the mean REW(C iv) of SDSS quasars (Wu et al. 2012). The weak emission lines of these objects may suggest they have a relativistically boosted optical/UV continuum which dilutes the emission lines. However, the broad-band SEDs of these objects (see §4.4) do not show the signature of a relativistically boosted continuum (e.g., a parabolic profile of the SED; Nieppola et al. 2006). It is also possible that the weakness of their emission lines is caused by extreme quasar disk-wind properties as for the radio-quiet weak-line quasars (e.g., Richards et al. 2011; Wu et al. 2011, 2012). One of our moderately radio-loud quasars (J16394340) also has a weak C iv line (see Table 8). This object is more likely to fit in the latter scenario; and thus the apparent high NTD value of this object does not indicate that it has substantial jet-contributed optical/UV continuum.
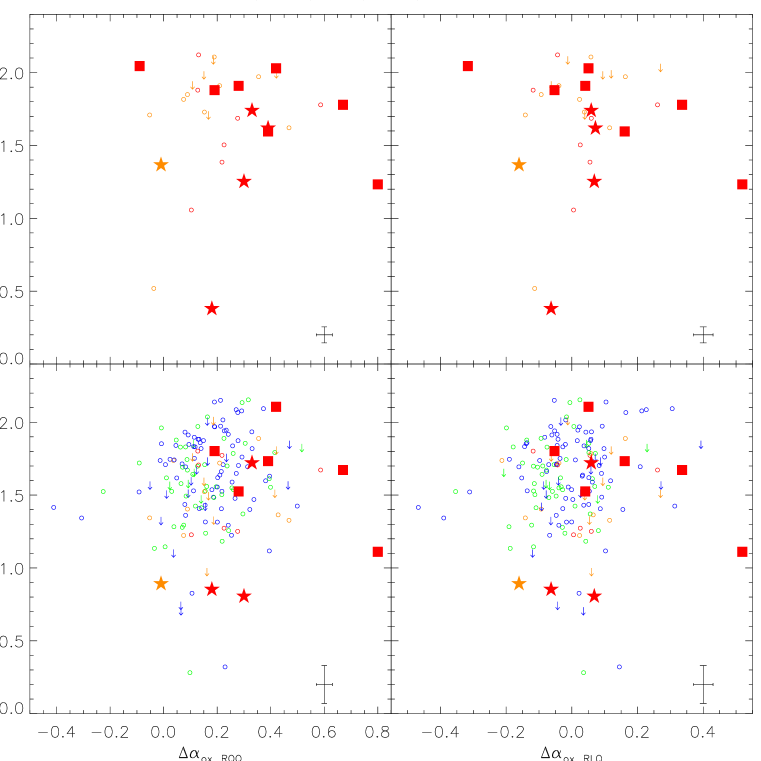
The jet-linked X-ray emission of RLQs is also likely beamed, although probably to a lesser extent compared to jet radio emission (e.g., see §6 of M11). Therefore, the relation between emission-line REWs and relative X-ray brightness is also worth investigating. A correlation analysis was performed on a sample combining our RLQs and the objects in M11 that have available Ly + N v and C iv REW measurements (see Fig. 7 for the relation between line REWs and relative X-ray brightness of this sample) using Spearman’s rank-order analysis in the ASURV package; Spearman’s rank-order analysis is usually preferred over Kendall’s test for samples where the number of objects is .232323See Appendix A3.3 of the ASURV manual at http://astrostatistics.psu.edu/statcodes/asurv. In our work, we choose Spearman’s rank-order analysis when sample size and Kendall’s test when . The results are shown in Table 10. Only a marginal correlation () was found between REW(C iv) and , which is consistent with the result in Richards et al. (2011) that RLQs with weaker C iv lines also tend to be weaker in X-rays. However, the bottom-left panel ( vs. C iv REW) of Fig. 7 shows a large scatter in this correlation. No other significant correlations were found between relative X-ray brightness and emission-line strength for the RLQs (see Table 10 and Fig. 7).
4.3. X-ray Spectral Properties
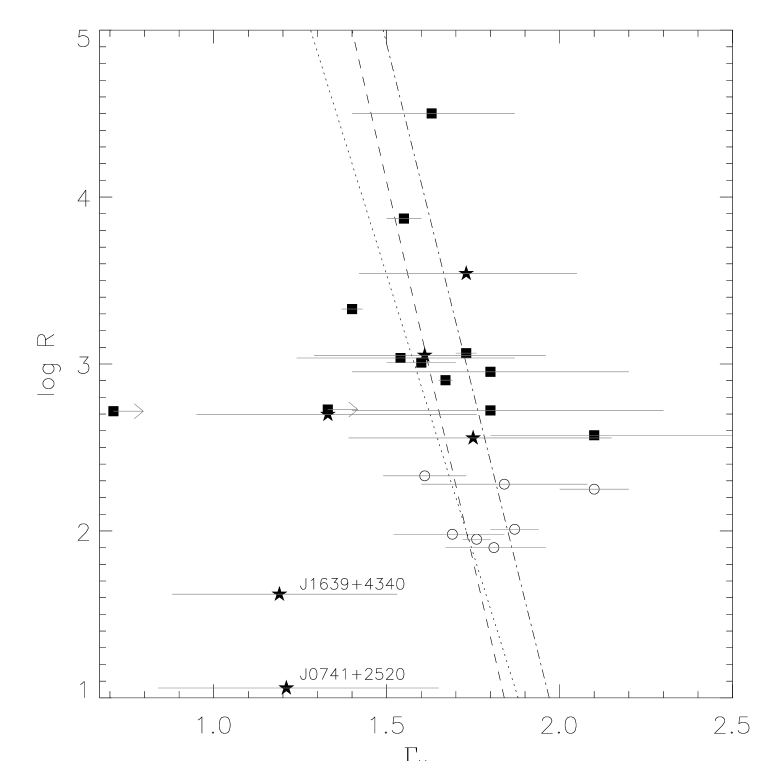
Our Chandra Cycle 12 targets do not have sufficient counts for individual X-ray spectral analysis, and thus we obtained their effective power-law photon indices based on their band ratios (see §3). The X-ray power-law photon index for RLQs is known to be anti-correlated with (e.g., Wilkes & Elvis 1987; Reeves & Turner 2000; Lopez et al. 2006; Saez et al. 2011). Our sample of HRLQs at is generally consistent with this anti-correlation (see Fig. 8). Kendall’s test on a sample combining our HRLQs and the moderately radio-loud quasars at in Saez et al. (2011) shows a -level anti-correlation between and (95.6% correlation probability). The best-fit correlation for this sample, obtained via the EM linear-regression algorithm in the ASURV package,242424This linear-regression algorithm is applicable to censored data. Our sample has two objects with upper limits upon . is
| (8) |
This – relation (the dashed line in Fig. 8) is consistent with that for the RLQs in Saez et al. (2011; see their Equation 1) and with that for the RLQs in Reeves & Turner (2000; see Equation 2 of Saez et al. 2011), suggesting that this relation does not evolve with redshift. The two moderately radio-loud quasars observed in Chandra Cycle 12 (J07412520 and J16394340), which do not satisfy our criterion for HRLQs, are outliers from this correlation. Instead of having the softer X-ray spectra generally associated with lower radio loudness, they have the hardest spectra among our objects.
HRLQs often appear to have intrinsic X-ray absorption with cm-2 (e.g., Yuan
et al. 2006). Bassett et al. (2004) found evidence of a similar level of intrinsic X-ray absorption
for moderately radio-loud quasars. To assess possible indications of intrinsic absorption for our
Chandra Cycle 12 targets, we performed joint spectral analyses. We divided our six targets into two
groups with (four objects) and (2 objects), respectively. For each object, the X-ray spectrum in observed-frame 0.5–8.0 keV (corresponding to rest-frame –40 keV) was extracted from a
-radius circular region centered on the X-ray position using the standard CIAO routine
psextract. Background spectra were extracted from annular regions with inner and outer radii of and ,
respectively. All background regions are free of X-ray sources. Joint X-ray spectral fitting was performed with XSPEC
v12.6.0 (Arnaud 1996). We applied the -statistic (Cash 1979) in the spectral fitting instead of
the standard statistic because the -statistic is well suited to limited X-ray count scenarios (e.g., Nousek & Shue 1989). We fit the spectra jointly using two models: (1) a power-law
model with a Galactic absorption component represented by the wabs model (Morrison
& McCammon 1983); (2) another model similar to the first, but adding an intrinsic
(redshifted to the source rest frame) neutral absorption component, represented by the zwabs model. Each source
was assigned its own values of redshift and Galactic neutral hydrogen column density (see Column 4 of Table 4).
Table 11 shows the best-fit spectral parameters along with the errors or upper limits at the 90%
confidence level for one parameter of interest (; Avni 1976; Cash 1979).
The best-fit power-law photon index values are consistent with those from band-ratio analysis (see Table 3).
Our joint-fitting procedure is not able to provide tight constraints on the intrinsic X-ray absorption for either highly or
moderately radio-loud quasars (see the upper limits on intrinsic in Table 11) mainly due to the limited
number of X-ray counts and their high redshifts. Adding an intrinsic absorption component does not improve the quality of the joint fits.
As discussed above, our two moderately radio-loud quasars appear to have a harder average X-ray spectrum than that of our HRLQs, which appears inconsistent with the known anti-correlation between X-ray power-law photon index and radio loudness. Possible heavy X-ray absorption may exist in these two objects. We estimate the potential intrinsic X-ray absorption for these two moderately radio-loud quasars by assuming their unabsorbed power-law photon indices follow the – relation (see Equation 8; for J07412520, for J16394340), and then adding an intrinsic X-ray absorption component to make the apparent agree with the values obtained from the band-ratio analysis ( for J07412520, for J16394340; see Table 3). The required intrinsic hydrogen column densities are cm-2 for J07412520 and cm-2 for J16394340, which are about an order of magnitude higher than the values found for high-redshift RLQs in previous studies. The intrinsic X-ray absorption in RLQs is often associated with absorption features in their optical/UV spectra (e.g., Elvis et al. 1998). The optical/UV spectrum of J16394340 (see the top-right panel of Fig. 3) shows several C iv and Si iv absorption features, although none of them has sufficient width to be identified as a broad absorption line (BAL). The optical/UV spectrum of J07412520 (see Fig. 3 of McGreer et al. 2009) does not show Si iv absorption features; it does not have coverage of the C iv region.
4.4. The Radio-to--ray Spectral Energy Distributions
To investigate the broad-band SEDs of our RLQs, we gathered photometric data from the following sources:
-
1.
Radio: The 1.4 GHz flux densities are from the FIRST or NVSS surveys; the 5 GHz values are from the GB6 or PMN catalogs or individual observations (see §3); the flux densities at other frequencies were retrieved from the NED.
-
2.
Mid-infrared: From the all-sky catalog of the Wide-field Infrared Survey Explorer (WISE; Wright et al. 2010).252525See the WISE all-sky data release at http://wise2.ipac.caltech.edu/docs/release/allsky/. All of our objects have WISE detections in at least two bands (W1 at m and W2 at m) except for GB 14284217 and PMN J19510134. We examined the WISE images of these two objects. There appears to be a source at the optical location of GB 14284217, but it is strongly blended with a nearby brighter source away. There is no source at the optical location of PMN J19510134 in the relevant WISE images. All other objects are free of issues such as source blending, confusion, or mismatching. The high detection fraction () in the mid-infrared band is remarkable given the high redshifts of our objects.
-
3.
Near-infrared: From the Two Micron All Sky Survey (2MASS; Skrutskie et al. 2006). For the objects having SDSS spectroscopy, we also checked the SDSS DR7 quasar catalog which provides additional deeper 2MASS photometry. Only our two moderately radio-loud quasars (J07412520 and J16394340) have 2MASS detections, likely owing to their exceptional overall luminosities. GB 14284217 has additional near-infrared observations with the United Kingdom Infra-Red Telescope (UKIRT) reported by Fabian et al. (1999).
-
4.
Optical: From the SDSS database and/or the NED. The photometry for the bands that are seriously affected by the Ly forest is omitted. We do not include any UV photometric information for the same reason.
-
5.
X-ray: From this work.
-
6.
-ray: The upper limits upon -ray luminosities are derived from the two-year survey data of the Large Area Telescope (LAT; Atwood et al. 2009) onboard the Fermi Gamma-Ray Space Telescope. See below for details.
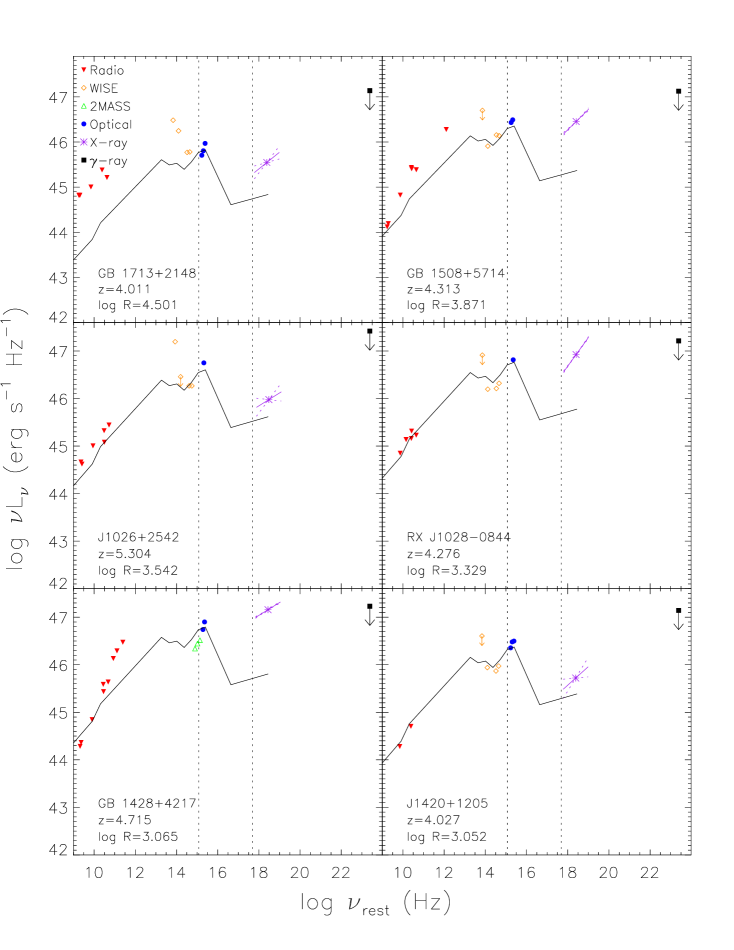
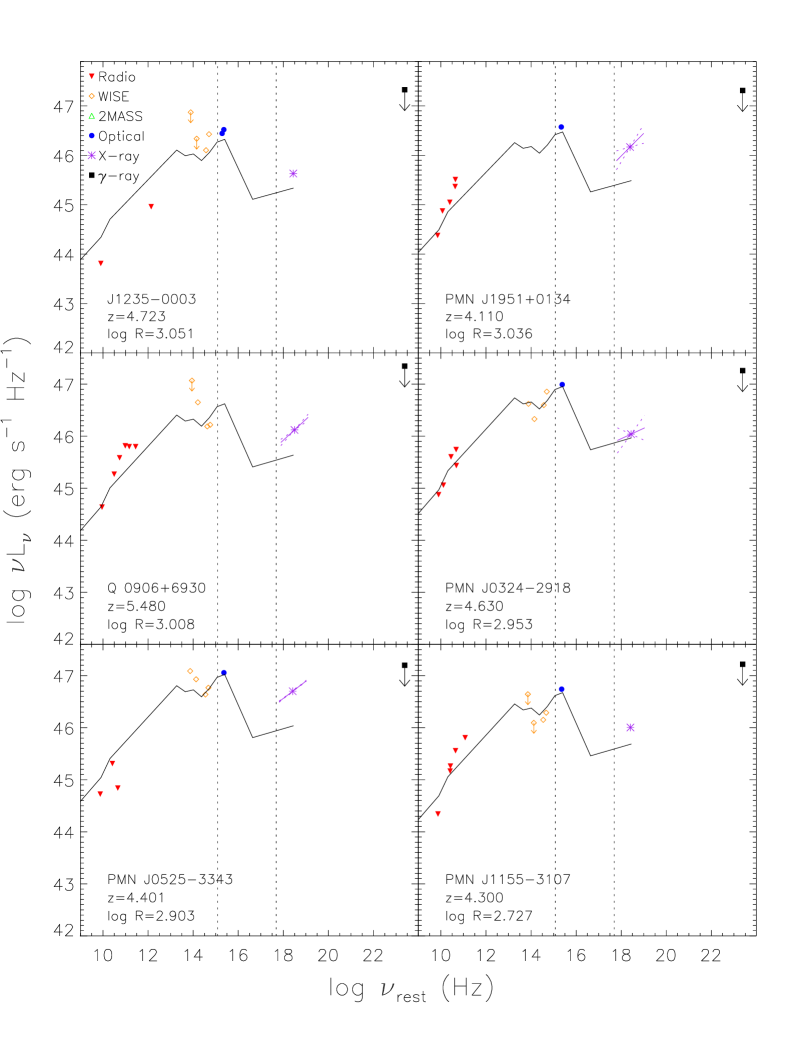
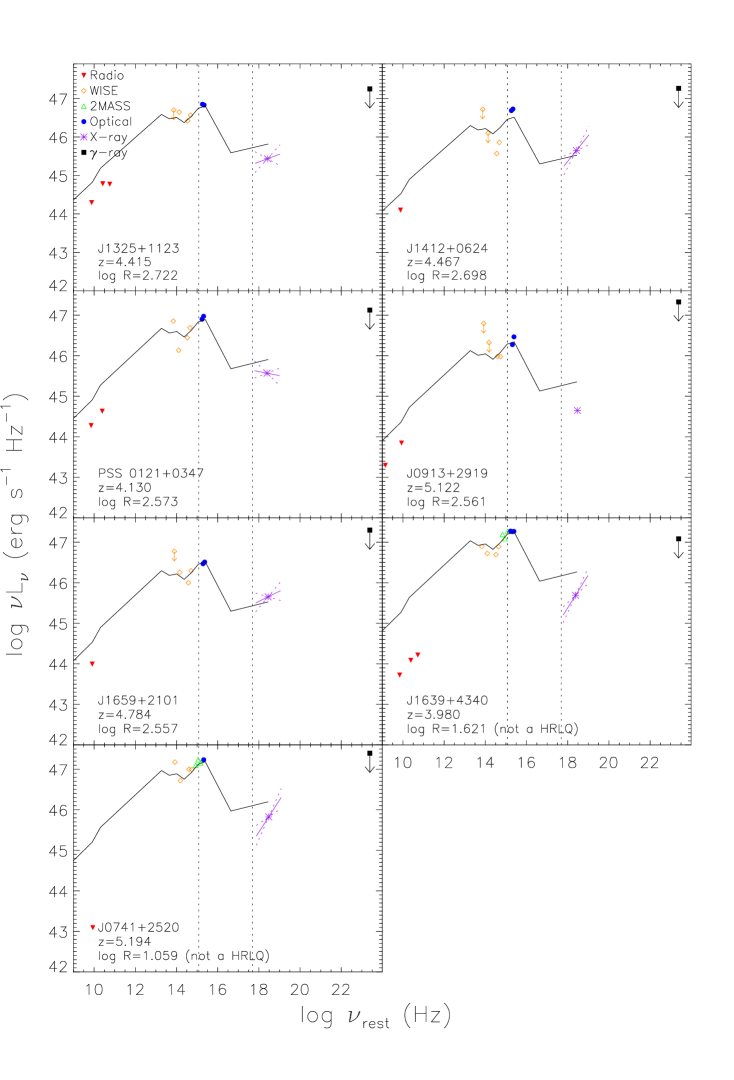
The radio-to--ray SEDs of our objects are plotted in Fig. 9, ordered by in descending order. We compare the SEDs of our high-redshift HRLQs to those of similar RLQs at lower redshifts. There are two commonly used composite SEDs of RLQs in the literature: Elvis et al. (1994; E94 hereafter) and Shang et al. (2011; S11 hereafter). The E94 SED is biased toward X-ray bright quasars as they required their objects to have X-ray observations with good signal-to-noise ratio (see discussion in §3 of E94 and §5.1 of Richards et al. 2006a). For the S11 SED, although their sample is not X-ray selected, the majority of their RLQs have lower optical/UV luminosities than those of our objects. The optical/UV luminosity can affect the shape of the broad-band SED (see Eqn. 5 for the dependence of on optical/UV luminosity). The parameter of RLQs also depends on radio luminosity (see Eqn. 5). Therefore we selected 10 RLQs in the S11 sample with comparable optical/UV luminosity ([3000 Å]) and radio-loudness values () to those of our HRLQs. We construct a comparison composite SED using these 10 objects (see the solid lines in Fig. 9). We normalized the comparison SED to the observed data at rest-frame 2500 Å for the following reasons: (1) rest-frame 2500 Å is within a region without strong emission lines; (2) the optical/UV continuum generally does not have a substantial contribution from the jet (except perhaps for a few objects with weak emission lines; see §4.2); and (3) when SEDs are normalized at rest-frame Å, the relative positions of X-ray data points directly reflect the values of the relevant quasars. One caveat about the SEDs is that our multi-band photometry is non-simultaneous, and some HRLQs are known to have strong variability.
The 10 RLQs from S11 used in constructing our comparison SED satisfy our criterion for HRLQs; they are HRLQs at low redshifts (). The majority of our HRLQs (11/17) have higher X-ray luminosities than those of the comparison SED. Meanwhile, they do not show weaker optical/UV emission relative to their infrared emission. Therefore, the generally higher values of our HRLQs (see §4.1) do reflect stronger X-ray emission instead of fainter optical/UV emission. This is an additional illustration of the X-ray emission enhancement of HRLQs compared to HRLQs at lower redshift. The SEDs of RX J10280844, GB 14284217, and GB 15085714 all reach maximal values (over the – Hz range) in the X-ray band. This type of SED has been modeled as the emission generated by Compton scattering of synchrotron emission from the jet itself and/or of a powerful external photon field such as the thermal emission of the accretion process (SSC/EC; see Fabian et al. 1998, 1999; Ghisellini et al. 1998). The SED of Q 09066930 has also been described with a similar model (Romani 2006). Q 09066930, along with PMN J05253343 and GB 17132148, have notably stronger mid-infrared emission than that of the comparison SED, especially in the longer wavelength bands (W3 at 12 m and W4 at 22 m). This mid-infrared excess may have a contribution from the jet synchrotron radiation (e.g., Ghisellini et al. 1998). An alternative origin for the mid-infrared excess is the thermal emission of circumnuclear dust predicted by the clumpy torus model (e.g., Nenkova et al. 2008). The SEDs of our HRLQs are significantly different from those of typical BL Lac objects which generally have a parabolic profile peaking in the near-infrared band (e.g., Nieppola et al. 2006).
Many blazars are high-energy -ray emitters above 100 MeV (e.g., Hartman et al. 1999). Q 09066930 has a tentative claimed detection () in its -ray observation by the Energetic Gamma-Ray Experiment Telescope (EGRET) onboard the Compton Gamma-Ray Observatory (Romani et al. 2004). The Fermi LAT has an order of magnitude better sensitivity and positional accuracy than EGRET. Romani (2006) suggested Q 09066930 should be detected by the Fermi LAT in its first year of operation. However, although the first two-year survey of the Fermi LAT has detected blazars at (e.g., Ackermann et al. 2011), none of our HRLQs, including Q 09066930, is detected at present. We searched the second source catalog of the Fermi LAT (2FGL; Nolan et al. 2012) and found no counterparts for our HRLQs within a matching radius.262626We also searched for the HRLQs without sensitive X-ray coverage listed in Table 2, and found none of them having counterparts in the 2FGL catalog. To obtain upper limits upon -ray luminosity, we first estimated the photon flux limits (in units of photons cm-2 s-1) for all objects based on the point-source flux limit map of the Fermi LAT two-year survey (see Fig. 1 of Ackermann et al. 2011). We converted the photon flux limits to energy flux limits between observed-frame 100 MeV–100 GeV and then flux-density limits at rest-frame 1 GeV, assuming a typical power-law photon index of Fermi-detected FSRQs (; see Fig. 18 of Ackermann et al. 2011). The upper limits upon the monochromatic -ray luminosity at rest-frame 1 GeV, calculated from the flux-density limits at the same frequency, are in the range of (1.2–2.6) erg s-1 Hz-1 (see Table 12 and Fig. 9). For some of our HRLQs with strong X-ray enhancements (e.g., Q 09066930, RX J10280844, GB 14284217, and GB 15085714), the -ray luminosity limits appear inconsistent with the prediction of the synchrotron-Compton blazar emission model in Romani et al. (2006; see their Fig. 3). Further Fermi LAT survey observations will provide tighter -ray luminosity upper limits (by a factor of ) or perhaps detections of blazars, which will help constrain the emission models for blazars at high redshift. Sbarrato et al. (2012a) found a positive correlation between the luminosity of optical/UV broad emission lines and the -ray luminosity for Fermi-detected blazars. This correlation may suggest that the blazars with higher optical/UV emission-line luminosity should be easier to detect with Fermi.
Six objects with SDSS spectroscopy have available black-hole mass () and Eddington-ratio () estimates (see Table 13) in the catalog of Shen et al. (2011).272727Another HRLQ in our sample, J10262542, has estimated by Sbarrato et al. (2012b) based on the peak frequency of disk emission and the total disk luminosity. The estimated range is =(1.8–4.5). Although this object has SDSS spectroscopy, its cannot be measured based on available emission-line widths because none of the standard lines (H, Mg ii, and C iv) is covered due to its high redshift (). The bolometric luminosity in Shen et al. (2011) was calculated from the optical/UV luminosity and the bolometric correction from the composite SED of Richards et al. (2006a). Therefore, the bolometric luminosity and the Eddington ratio only account for the emission of the quasar from its accretion activity (i.e., excluding beamed jet emission). All of the six objects have except for GB 15085714. These five objects have estimated Eddington ratios between and , which are typical for SDSS quasars at high redshift (e.g., Shen et al. 2008). GB 15085714 has a smaller but an Eddington ratio . This object is similar to the Fermi-detected FSRQs in Shaw et al. (2012) which have smaller and higher Eddington ratios than those of optically selected quasars. The objects in Shaw et al. (2012) show significant non-thermal (synchrotron) emission in the optical band associated with the jet. However, GB 15085714 has a smaller NTD value (consistent with unity; see §4.2) than the majority of the objects in Shaw et al. (2012; see their Fig. 3), which suggests that this object does not have substantial jet-linked optical/UV continuum emission. It is worth noting that the measurements for our objects are all based on the C iv emission line due to their high redshifts. The C iv estimator for is more affected by the quasar disk wind than the H and Mg ii estimators, and this may lead to errors for individual measurements (e.g., Shen et al. 2008). Thus, the apparent super-Eddington emission of GB 15085714 should not be over-interpreted.
5. Summary and Future Studies
We have compiled a sample of 17 highly radio-loud quasars () at with sensitive X-ray coverage by Chandra, XMM-Newton, or Swift. Four of them were targeted in new Chandra Cycle 12 observations, while the other 13 objects have sensitive archival X-ray coverage. Our sample of HRLQs represents the top of the total RLQ population in terms of radio loudness. They are among the most-luminous quasars in both the radio and optical/UV bands. The X-ray and broad-band properties of our HRLQs are presented and investigated. We have also reported new Chandra Cycle 12 observations of two moderately radio-loud quasars () at which are among the most optically luminous RLQs. Our main results are summarized as follows.
-
1.
All of our Chandra Cycle 12 targets are detected in X-rays. None of them shows detectable extended X-ray emission. All of the archival objects in our sample of HRLQs were also detected by Chandra, XMM-Newton, or Swift, including four objects for which their archival Chandra (GB 17132148), XMM-Newton (SDSS J12350003), or Swift (PMN J11553107 and PMN J19510134) observations are first reported in this work. See §3.
-
2.
Our HRLQs at show stronger X-ray emission (by a typical factor of ) than HRLQs at lower redshift with similar optical/UV and radio luminosities. This contrasts with the behavior of moderately radio-loud quasars at , implying that the high-redshift X-ray enhancement occurs within the jet-linked component that becomes increasingly prominent for HRLQs. We examined possible biases in our analysis and found that our result remains robust after controlling for a variety of potential issues. A similar X-ray emission enhancement is also found for –4 HRLQs, which provides statistically independent evidence for our findings. The observed X-ray enhancement is not likely to be caused by the X-ray spectral curvature found in some high-redshift HRLQs. See §4.1.
-
3.
Our HRLQs are generally consistent with the positive correlations between optical/UV emission-line REWs (Ly + N v and C iv) and radio loudness found for the typical RLQ population. These positive correlations suggest that the optical/UV continua of HRLQs usually have a negligible contribution from the relativistic jets (except for perhaps a few outliers with weak emission lines). Our HRLQs do not show strong correlations between the relative X-ray brightness and optical/UV emission-line REWs. See §4.2.
-
4.
Our sample of HRLQs generally follows the known anti-correlation between X-ray power-law photon index and radio loudness. However, the two targeted moderately radio-loud quasars, having the hardest X-ray spectra among our objects, appear to be outliers from this correlation, suggesting the possible presence of intrinsic X-ray absorption ( cm-2). See §4.3.
-
5.
The majority of HRLQs have higher X-ray luminosities than those of the matched low-redshift HRLQs used to construct a comparison SED, which further illustrates and supports the X-ray emission enhancement of HRLQs over those at lower redshifts. The SEDs of our objects with the highest X-ray luminosities are consistent with the expectations from SSC/EC models. Some of our HRLQs also show an excess of mid-infrared emission which may be contributed by synchrotron radiation from the relativistic jets. None of our HRLQs has been detected by the Fermi LAT in its two-year survey. See §4.4.
We have performed the first systematic X-ray survey of HRLQs at . Our primary new result is the measurement of an increase (by a factor of 3) in the relative X-ray emission of HRLQs compared to their low-redshift counterparts. This work adds the relative X-ray brightness of HRLQs to the RLQ properties that evolve with redshift, such as the frequency of intrinsic X-ray absorption (see 1) and perhaps the RLQ fraction (e.g., Jiang et al. 2007; Singal et al. 2012). The number density of hard X-ray selected FSRQs has been found to evolve strongly with redshift, with a peak number density of –4 (Ajello et al. 2009). Unfortunately, the sample utilized by Ajello et al. (2009) from the Swift Burst Alert Telescope (BAT; Barthelmy et al. 2005) does not have any FSRQ detections at , and thus there is considerable uncertainty in making quantitative comparisons at the high redshifts most applicable to our work. We do note, however, that the SED evolution we find for high-redshift HRLQs (which are primarily FSRQs) will affect the interpretation of number-density evolution results for X-ray selected samples. For example, it may help to explain the higher value found for FSRQs than for general quasars or X-ray selected AGNs.
While the limited increase in X-ray luminosities confirms earlier findings that the small-scale X-ray jet-linked emission is not dominated by IC/CMB emission, our results are consistent with a fractional contribution from IC/CMB ( of the nuclear X-ray emission at ) rising with redshift. This does not conflict with growing evidence that RLQ jets have mildly relativistic bulk velocities beyond several kpc, as inferred from radio core/jet prominences (e.g., ; Mullin & Hardcastle 2009), or that various predictions of IC/CMB models are not obviously met in X-ray observations of large-scale RLQ jets (e.g., Hardcastle 2006; Marshall et al. 2011; Massaro et al. 2011; note these studies are based almost exclusively on RLQs with ). It may be that IC/CMB emission is relevant only over a limited range of spatial scales (e.g., –5 kpc), with quasar-related photon fields dominating at smaller distances (e.g., Ghisellini & Tavecchio 2009) and the jet decelerating at larger distances. For example, a drop in the bulk jet velocity from to , corresponding to a decrease from at 5 kpc to at large scales, would act to diminish X-ray IC/CMB emission by a factor of . Jet deceleration appears to be required in at least some RLQs even in the context of IC/CMB modeling of the large-scale X-ray jet emission, when coupled with VLBI constraints (Hogan et al. 2011). Such deceleration could be partially due to mass entrainment; simulations predict that even in powerful jets the bulk Lorentz factor decreases by a factor of 2 on kpc scales (Bowman et al. 1996). Although faster jets are more stable against Kelvin-Helmholtz instabilities (e.g., Perucho et al. 2005), the gradual accumulation of velocity-shear perturbations may similarly act to slow the jet. The Compton-rocket effect (e.g., Ghisellini & Tavecchio 2010) provides another means of draining jets. Whatever the dominant mechanism, the postulated degree of deceleration could plausibly be accomplished without disrupting or decollimating the jet; for example, in their classic work Kaiser & Alexander (1997) estimate that a powerful jet with is persistently stable (although see also Wang et al. 2011b). This deceleration possibility can be tested with additional observations of large-scale jets in high-redshift RLQs.282828Cheung et al. (2012) interpret the X-ray/radio flux ratios of jets in GB 14284217 and GB 15084714 as supportive of an IC/CMB origin, but require a lower bulk Lorentz factor than is typically inferred from IC/CMB modeling of low-redshift RLQs. In a fractional IC/CMB scenario, the enhanced X-ray emission from HRLQs is solely due to the increased energy density of the CMB; the jet bulk velocities, the disk/corona accretion structure, and the host-galaxy properties of individual RLQs are not required to evolve with redshift.
Alternative interpretations of the observed X-ray emission enhancement of HRLQs are also possible. For example, increased host-galaxy star formation could provide additional seed photons for external Compton upscattering in the jet (see 4.1.3). Also, a decrease in the jet bulk Lorentz factor at high redshift (a possibility suggested by Volonteri et al. 2011) might increase the ratio of X-ray to radio emission, particularly in a multi-component jet. It does not appear likely that X-ray spectral curvature drives our results, as the observed-frame ultra-soft luminosities are also enhanced. After careful consideration of selection effects, there is no obvious indication that our sample contains a disproportionate number of “extreme” HRLQs, with properties (low inclinations, strong variability) likely to correlate with enhanced X-ray emission.
Future X-ray observations of additional HRLQs, e.g., a Chandra snapshot survey of the 11 objects listed in Table 2, would further improve the sample statistics and better constrain the possible mechanisms for the X-ray enhancement. For example, the HRLQs at –4 apparently have a similar level of X-ray enhancement to that of HRLQs, which would not agree with the expectations from the fractional IC/CMB model. However, more objects are needed to reduce the large uncertainties on the mean values in current analyses. Identifying potential intrinsic X-ray absorption in our objects, especially for the two moderately radio-loud quasars (J07412520 and J16394340), requires deeper X-ray spectroscopic observations. The ongoing Fermi LAT survey will provide tighter -ray luminosity upper limits or perhaps -ray detections of HRLQs, which will be useful for modeling their SEDs and for constraining the relative strengths of the jet emissions from different mechanisms.
References
- Abazajian et al. (2009) Abazajian, K. N., Adelman-McCarthy, J. K., Agüeros, M. A., et al. 2009, ApJS, 182, 543
- Ackermann et al. (2011) Ackermann, M., Ajello, M., Allafort, A., et al. 2011, ApJ, 743, 171
- Ajello et al. (2009) Ajello, M., Costamante, L., Sambruna, R. M., et al. 2009, ApJ, 699, 603
- Archibald et al. (2001) Archibald, E. N., Dunlop, J. S., Hughes, D. H., et al. 2001, MNRAS, 323, 417
- Arnaud (1996) Arnaud, K. A., 1996, in ASP Conf. Ser. 101, Astronomical Data Analysis Software and Systems V, ed. G. H. Jacoby & J. Barnes (San Francisco:ASP), 17
- Atwood et al. (2009) Atwood, W. B., Abdo, A. A., Ackermann, M., et al. 2009, ApJ, 697, 1071
- Avni (1976) Avni, Y. 1976, ApJ, 210, 642
- Barthelmy et al. (2005) Barthelmy, S. D., Barbier, L. M., Cummings, J. R., et al. 2005, Space Sci. Rev., 120, 143
- Bassett et al. (2004) Bassett, L. C., Brandt, W. N., Schneider, D. P., et al. 2004, AJ, 128, 523
- Becker et al. (1995) Becker, R. H., White, R. L., & Helfand, D. J., 1995, ApJ, 450, 559
- Begelman & Sikora (1987) Begelman, M. C., & Sikora, M. 1987, ApJ, 322, 650
- Behar et al. (2011) Behar, E., Dado, S., Dar, A., & Laor, A. 2011, ApJ, 734, 26
- Bowman et al. (1996) Bowman, M., Leahy, J. P., & Komissarov, S. S. 1996, MNRAS, 279, 899
- Brandt et al. (2001) Brandt, W. N., Guainazzi, M., Kaspi, S., et al. 2001, AJ, 121, 591
- Brandt et al. (2002) Brandt, W. N., Schneider, D. P., Fan, X., et al. 2002, ApJ, 569, L5
- Brinkmann et al. (1997) Brinkmann, W., Yuan, W., & Siebert, J. 1997, A&A, 319, 413
- Broderick & Fender (2011) Broderick, J. W., & Fender, R. P. 2011, MNRAS, 417, 184
- Burrows et al. (2005) Burrows, D. N., Hill, J. E., Nousek, J. A., et al. 2005, Space Sci. Rev., 120, 165
- Cash (1979) Cash, W. 1979, ApJ, 228, 939
- Celotti et al. (2001) Celotti, A., Ghisellini, G., & Chiaberge, M. 2001, MNRAS, 321, L1
- Celotti et al. (2007) Celotti, A., Ghisellini, G., & Fabian, A. C. 2007, MNRAS, 375, 417
- Cheung (2004) Cheung, C. C. 2004, ApJ, 600, L23
- Cheung et al. (2012) Cheung, C. C., Stawarz, Ł., Siemiginowska, A., et al. 2012, ApJ, 756, L20
- Cirasuolo et al. (2003) Cirasuolo, M., Celotti, A., Magliocchetti, M., & Danese, L. 2003, MNRAS, 346, 447
- Condon et al. (1998) Condon, J. J., Cotton, W. D., Greisen, E. W., et al. 1998, AJ, 115, 1693
- Cowie et al. (1996) Cowie, L. L., Songaila, A., Hu, E. M., & Cohen, J. G. 1996, AJ, 112, 839
- Croom et al. (2009) Croom, S. M., Richards, G. T., Shanks, T., et al. 2009, MNRAS, 399, 1755
- Diamond-Stanic et al. (2009) Diamond-Stanic, A. M., Fan, X., Brandt, W. N., et al. 2009, ApJ, 699, 782
- Dickey & Lockman (1990) Dickey, J. M., & Lockman, F. J. 1990, ARA&A, 28, 215
- Elvis et al. (1994) Elvis, M., Wilkes, B. J., McDowell, J. C., et al. 1994, ApJS, 95, 1 (E94)
- Elvis et al. (1998) Elvis, M., Fiore, F., Giommi, P., & Padovani, P. 1998, ApJ, 492, 91
- Fabian et al. (1998) Fabian, A. C., Iwasawa, K., McMahon, R. G., et al. 1998, MNRAS, 295, L25
- Fabian et al. (1999) Fabian, A. C., Celotti, A., Pooley, G., et al. 1999, MNRAS, 308, L6
- Fabian et al. (2001) Fabian, A. C., Celotti, A., Iwasawa, K., et al. 2001, MNRAS, 323, 373
- Feigelson & Nelson (1985) Feigelson, E. D., & Nelson, P. I. 1985, ApJ, 293, 192
- Fiore et al. (1998) Fiore, F., Elvis, M., Giommi, P., & Padovani, P. 1998, ApJ, 492, 79
- Freeman et al. (2002) Freeman, P. E., Kashyap, V., Rosner, R., Lamb, D. Q., 2002, ApJS, 138, 185
- Frey et al. (2010) Frey, S., Paragi, Z., Gurvits, L. I., Cseh, D., & Gabányi, K. É. 2010, A&A, 524, A83
- Garmire et al. (2003) Garmire, G. P., Bautz, M. W., Ford, P. G., Nousek, J. A., & Ricker, G. R., Jr. 2003, Proc. SPIE, 4851, 28
- Gehrels (1986) Gehrels, N. 1986, ApJ, 303, 336
- Ghisellini et al. (1998) Ghisellini, G., Celotti, A., Fossati, G., Maraschi, L., & Comastri, A. 1998, MNRAS, 301, 451
- Ghisellini & Tavecchio (2009) Ghisellini, G., & Tavecchio, F. 2009, MNRAS, 397, 985
- Ghisellini & Tavecchio (2010) Ghisellini, G., & Tavecchio, F. 2010, MNRAS, 409, L79
- Ghisellini et al. (2010) Ghisellini, G., Tavecchio, F., Foschini, L., et al. 2010, MNRAS, 402, 497
- Ghisellini et al. (2011) Ghisellini, G., Tagliaferri, G., Foschini, L., et al. 2011, MNRAS, 411, 901
- Gregory et al. (1996) Gregory, P. C., Scott, W. K., Douglas, K., & Condon, J. J. 1996, ApJS, 103, 427
- Griffith & Wright (1993) Griffith, M. R., & Wright, A. E. 1993, AJ, 105, 1666
- Grupe et al. (2004) Grupe, D., Mathur, S., Wilkes, B., & Elvis, M. 2004, AJ, 127, 1
- Hardcastle (2006) Hardcastle, M. J. 2006, MNRAS, 366, 1465
- Hardcastle & Croston (2011) Hardcastle, M. J., & Croston, J. H. 2011, MNRAS, 415, 133
- Hartman et al. (1999) Hartman, R. C., Bertsch, D. L., Bloom, S. D., et al. 1999, ApJS, 123, 79
- Hewett & Wild (2010) Hewett, P. C., & Wild, V. 2010, MNRAS, 405, 2302
- Healey et al. (2008) Healey, S. E., Romani, R. W., Cotter, G., et al. 2008, ApJS, 175, 97
- Helmboldt et al. (2007) Helmboldt, J. F., Taylor, G. B., Tremblay, S., et al. 2007, ApJ, 658, 203
- Hogan et al. (2011) Hogan, B. S., Lister, M. L., Kharb, P., Marshall, H. L., & Cooper, N. J. 2011, ApJ, 730, 92
- Holt et al. (2004) Holt, J., Benn, C. R., Vigotti, M., et al. 2004, MNRAS, 348, 857
- Hook & McMahon (1998) Hook, I. M., & McMahon, R. G. 1998, MNRAS, 294, L7
- Hook et al. (2002) Hook, I. M., McMahon, R. G., Shaver, P. A., & Snellen, I. A. G. 2002, A&A, 391, 509
- Hopkins & Beacom (2006) Hopkins, A. M., & Beacom, J. F. 2006, ApJ, 651, 142
- Ivezić et al. (2002) Ivezić, Ž., Menou, K., Knapp, G. R., et al. 2002, AJ, 124, 2364
- Ivezić et al. (2004) Ivezić, Ž., Richards, G., Hall, P., et al. 2004, in ASP Conf. Ser. 311, AGN Physics with the Sloan Digital Sky Survey, ed. G. T. Richards & P. B. Hall (San Francisco, CA: ASP), 347
- Janknecht et al. (2006) Janknecht, E., Reimers, D., Lopez, S., & Tytler, D. 2006, A&A, 458, 427
- Jiang et al. (2007) Jiang, L., Fan, X., Ivezić, Ž., et al. 2007, ApJ, 656, 680
- Jiang et al. (2009) Jiang, L., Fan, X., Bian, F., et al. 2009, AJ, 138, 305
- Just et al. (2007) Just, D. W., Brandt, W. N., Shemmer, O., et al. 2007, ApJ, 665, 1004
- Kaiser & Alexander (1997) Kaiser, C. R., & Alexander, P. 1997, MNRAS, 286, 215
- Kaspi et al. (2000) Kaspi, S., Brandt, W. N., & Schneider, D. P. 2000, AJ, 119, 2031
- Kellermann et al. (1989) Kellermann, K. I., Sramek, R., Schmidt, M., Shaffer, D. B., & Green, R. 1989, AJ, 98, 1195
- Kimball et al. (2011a) Kimball, A. E., Ivezić, Ž., Wiita, P. J., & Schneider, D. P. 2011a, AJ, 141, 182
- Kimball et al. (2011b) Kimball, A. E., Kellermann, K. I., Condon, J. J., Ivezić, Ž., & Perley, R. A. 2011b, ApJ, 739, L29
- Komatsu et al. (2009) Komatsu, E., Dunkley, J., Nolta, M. R., et al. 2009, ApJS, 180, 330
- Krolik (1999) Krolik, J. H. 1999, Active Galactic Nuclei : from the Central Black Hole to the Galactic Environment (Princeton: Princeton University Press)
- Latta (1981) Latta, R. B., 1981, J. Am. Stat. Assoc., 76, 713
- Lavalley et al. (1992) Lavalley, M., Isobe, T., Feigelson, E., 1992, in ASP Conf. Ser. 25, Astronomical Data Analysis Software and Systems I, ed. D. M. Worrall, C. Biemesderfer, & J. Barnes (San Francisco, CA: ASP), 245
- Lopez et al. (2006) Lopez, L. A., Brandt, W. N., Vignali, C., et al. 2006, AJ, 131, 1914
- Lyons (1991) Lyons, L. 1991, Data Analysis for Physical Science Students (Cambridge: Cambridge Univ. Press)
- Marshall et al. (2011) Marshall, H. L., Gelbord, J. M., Schwartz, D. A., et al. 2011, ApJS, 193, 15
- Massaro et al. (2011) Massaro, F., Harris, D. E., & Cheung, C. C. 2011, ApJS, 197, 24
- McGreer et al. (2009) McGreer, I. D., Helfand, D. J., & White, R. L. 2009, AJ, 138, 1925
- Meyer et al. (2011) Meyer, E. T., Fossati, G., Georganopoulos, M., & Lister, M. L. 2011, ApJ, 740, 98
- Meyer et al. (2012) Meyer, E. T., Fossati, G., Georganopoulos, M., & Lister, M. L. 2012, ApJ, 752, L4
- Migliori et al. (2012) Migliori, G., Siemiginowska, A., & Celotti, A. 2012, ApJ, 749, 107
- Miller et al. (2011) Miller, B. P., Brandt, W. N., Schneider, D. P., et al. 2011, ApJ, 726, 20 (M11)
- Momjian et al. (2004) Momjian, E., Petric, A. O., & Carilli, C. L. 2004, AJ, 127, 587
- Mor et al. (2012) Mor, R., Netzer, H., Trakhtenbrot, B., Shemmer, O., & Lira, P. 2012, ApJ, 749, L25
- Morrison & McCammon (1983) Morrison, R., & McCammon, D. 1983, ApJ, 270, 119
- Mullin & Hardcastle (2009) Mullin, L. M., & Hardcastle, M. J. 2009, MNRAS, 398, 1989
- Nenkova et al. (2008) Nenkova, M., Sirocky, M. M., Nikutta, R., Ivezić, Ž., & Elitzur, M. 2008, ApJ, 685, 160
- Nieppola et al. (2006) Nieppola, E., Tornikoski, M., & Valtaoja, E. 2006, A&A, 445, 441
- Nolan et al. (2012) Nolan, P. L., Abdo, A. A., Ackermann, M., et al. 2012, ApJS, 199, 31
- Nousek & Shue (1989) Nousek, J. A., & Shue, D. R. 1989, ApJ, 342, 1207
- Page et al. (2005) Page, K. L., Reeves, J. N., O’Brien, P. T., & Turner, M. J. L. 2005, MNRAS, 364, 195
- Panter et al. (2007) Panter, B., Jimenez, R., Heavens, A. F., & Charlot, S. 2007, MNRAS, 378, 1550
- Perucho et al. (2005) Perucho, M., Martí, J. M., & Hanasz, M. 2005, A&A, 443, 863
- Reeves & Turner (2000) Reeves, J. N., & Turner, M. J. L. 2000, MNRAS, 316, 234
- Richards et al. (2006) Richards, G. T., Lacy, M., Storrie-Lombardi, L. J., et al. 2006, ApJS, 166, 470
- Richards et al. (2006) Richards, G. T., Strauss, M. A., Fan, X., et al. 2006, AJ, 131, 2766
- Richards et al. (2011) Richards, G. T., Kruczek, N. E., Gallagher, S. C., et al. 2011, AJ, 141, 167
- Romani et al. (2004) Romani, R. W., Sowards-Emmerd, D., Greenhill, L., & Michelson, P. 2004, ApJ, 610, L9
- Romani (2006) Romani, R. W. 2006, AJ, 132, 1959
- Saez et al. (2011) Saez, C., Brandt, W. N., Shemmer, O., et al. 2011, ApJ, 738, 53
- Sbarrato et al. (2012) Sbarrato, T., Ghisellini, G., Maraschi, L., & Colpi, M. 2012a, MNRAS, 421, 1764
- Sbarrato et al. (2012) Sbarrato, T., Ghisellini, G., Nardini, M., et al. 2012, MNRAS, 426, L91
- Schneider et al. (2007) Schneider, D. P., Hall, P. B., Richards, G. T., et al. 2007, AJ, 134, 102
- Schneider et al. (2010) Schneider, D. P., Richards, G. T., Hall, P. B., et al. 2010, AJ, 139, 2360
- Schwartz (2002) Schwartz, D. A. 2002, ApJ, 569, L23
- Shang et al. (2011) Shang, Z., Brotherton, M. S., Wills, B. J., et al. 2011, ApJS, 196, 2 (S11)
- Shaver et al. (1996) Shaver, P. A., Wall, J. V., & Kellermann, K. I. 1996, MNRAS, 278, L11
- Shaw et al. (2012) Shaw, M. S., Romani, R. W., Cotter, G., et al. 2012, ApJ, 748, 49
- Shemmer et al. (2005) Shemmer, O., Brandt, W. N., Vignali, C., et al. 2005, ApJ, 630, 729
- Shemmer et al. (2006) Shemmer, O., Brandt, W. N., Schneider, D. P., et al. 2006, ApJ, 644, 86
- Shen et al. (2008) Shen, Y., Greene, J. E., Strauss, M. A., Richards, G. T., & Schneider, D. P. 2008, ApJ, 680, 169
- Shen et al. (2011) Shen, Y., Richards, G. T., Strauss, M. A., et al. 2011, ApJS, 194, 45
- Siemiginowska et al. (2003) Siemiginowska, A., Smith, R. K., Aldcroft, T. L., et al. 2003, ApJ, 598, L15
- Sikora et al. (1997) Sikora, M., Madejski, G., Moderski, R., & Poutanen, J. 1997, ApJ, 484, 108
- Sikora et al. (2009) Sikora, M., Stawarz, Ł., Moderski, R., Nalewajko, K., & Madejski, G. M. 2009, ApJ, 704, 38
- Singal et al. (2011) Singal, J., Petrosian, V., Lawrence, A., & Stawarz, Ł. 2011, ApJ, 743, 104
- Singal et al. (2012) Singal, J., Petrosian, V., Stawarz, L., & Lawrence, A. 2012, arXiv:1207.3396 [astro-ph]
- Skrutskie et al. (2006) Skrutskie, M. F., Cutri, R. M., Stiening, R., et al. 2006, AJ, 131, 1163
- Smail et al. (2012) Smail, I., Blundell, K. M., Lehmer, B. D., & Alexander, D. M. 2012, ApJ, 760, 132
- Sokolov et al. (2004) Sokolov, A., Marscher, A. P., & McHardy, I. M. 2004, ApJ, 613, 725
- Songaila & Cowie (2002) Songaila, A., & Cowie, L. L. 2002, AJ, 123, 2183
- Stark et al. (1992) Stark, A. A., Gammie, C. F., Wilson, R. W., et al. 1992, ApJS, 79, 77
- Steffen et al. (2006) Steffen, A. T., Strateva, I., Brandt, W. N., et al. 2006, AJ, 131, 2826
- Tavecchio et al. (2000) Tavecchio, F., Maraschi, L., Sambruna, R. M., & Urry, C. M. 2000, ApJ, 544, L23
- Vanden Berk et al. (2001) Vanden Berk, D. E., Richards, G. T., Bauer, A., et al. 2001, AJ, 122, 549
- Vignali et al. (2001) Vignali, C., Brandt, W. N., Fan, X., et al. 2001, AJ, 122, 2143
- Vignali et al. (2003) Vignali, C., Brandt, W. N., Schneider, D. P., Garmire, G. P., & Kaspi, S. 2003a, AJ, 125, 418
- Vignali et al. (2003) Vignali, C., Brandt, W. N., Schneider, D. P., et al. 2003b, AJ, 125, 2876
- Vignali et al. (2005) Vignali, C., Brandt, W. N., Schneider, D. P., & Kaspi, S. 2005, AJ, 129, 2519
- Voges et al. (1999) Voges, W., Aschenbach, B., Boller, T., et al. 1999, A&A, 349, 389
- Volonteri et al. (2011) Volonteri, M., Haardt, F., Ghisellini, G., & Della Ceca, R. 2011, MNRAS, 416, 216
- Wang et al. (2008) Wang, R., Carilli, C. L., Wagg, J., et al. 2008, ApJ, 687, 848
- Wang et al. (2011) Wang, R., Wagg, J., Carilli, C. L., et al. 2011a, AJ, 142, 101
- Wang et al. (2011) Wang, Y., Knigge, C., Croston, J. H., & Pavlovski, G. 2011b, MNRAS, 418, 1138
- Weymann et al. (1998) Weymann, R. J., Jannuzi, B. T., Lu, L., et al. 1998, ApJ, 506, 1
- Wilkes & Elvis (1987) Wilkes, B. J., & Elvis, M. 1987, ApJ, 323, 243
- Wright et al. (2010) Wright, E. L., Eisenhardt, P. R. M., Mainzer, A. K., et al. 2010, AJ, 140, 1868
- Worrall et al. (1987) Worrall, D. M., Tananbaum, H., Giommi, P., & Zamorani, G. 1987, ApJ, 313, 596
- Worsley et al. (2004) Worsley, M. A., Fabian, A. C., Turner, A. K., Celotti, A., & Iwasawa, K. 2004a, MNRAS, 350, 207
- Worsley et al. (2004) Worsley, M. A., Fabian, A. C., Celotti, A., & Iwasawa, K. 2004b, MNRAS, 350, L67
- Worsley et al. (2006) Worsley, M. A., Fabian, A. C., Pooley, G. G., & Chandler, C. J. 2006, MNRAS, 368, 844
- Wu et al. (2011) Wu, J., Brandt, W. N., Hall, P. B., et al. 2011, ApJ, 736, 28
- Wu et al. (2012) Wu, J., Brandt, W. N., Anderson, S. F., et al. 2012, ApJ, 747, 10
- York et al. (2000) York, D. G., Adelman, J., Anderson, J. E., Jr., et al. 2000, AJ, 120, 1579
- Yuan et al. (2003) Yuan, W., Fabian, A. C., Celotti, A., & Jonker, P. G. 2003, MNRAS, 346, L7
- Yuan et al. (2005) Yuan, W., Fabian, A. C., Celotti, A., McMahon, R. G., & Matsuoka, M. 2005, MNRAS, 358, 432
- Yuan et al. (2006) Yuan, W., Fabian, A. C., Worsley, M. A., & McMahon, R. G. 2006, MNRAS, 368, 985
- Zamfir et al. (2008) Zamfir, S., Sulentic, J. W., & Marziani, P. 2008, MNRAS, 387, 856
- Zamorani et al. (1981) Zamorani, G., Henry, J. P., Maccacaro, T., et al. 1981, ApJ, 245, 357
- Zickgraf et al. (1997) Zickgraf, F.-J., Voges, W., Krautter, J., et al. 1997, A&A, 323, L21
| Object Name | R.A. (J2000) | Dec (J2000) | aaRedshift for each source. The redshift values for objects in the SDSS DR7 quasar catalog are from Hewett & Wild (2010). | Detector | Observation | Observation | Exp. TimebbThe exposure times are corrected for detector dead time. | ReferenceccReferences: (1) This work; (2) McGreer et al. (2009); (3) Vignali et al. (2003a); (4) Hook et al. (2002); (5) Lopez et al. (2006); (6) Fabian et al. (2001); (7) Worsley et al. (2004a); (8) Romani et al. (2004); (9) Romani (2006); (10) Vignali et al. (2003b); (11) Zickgraf et al. (1997); (12) Grupe et al. (2004); (13) Yuan et al. (2005); (14) Healey et al. (2008); (15) Bassett et al. (2004); (16) Hook & McMahon (1998); (17) Fabian et al. (1998); (18) Fabian et al. (1999); (19) Worsley et al. (2004b); (20) Siemiginowska et al. (2003); (21) Yuan et al. (2003); (22) Cheung (2004); (23) Yuan et al. (2006). | |
|---|---|---|---|---|---|---|---|---|---|
| (deg) | (deg) | Date (UT) | ID | (ks) | |||||
| Chandra Cycle 12 Objects | |||||||||
| SDSS J | ACIS-S | 2010 Oct 04 | 12171 | 1,2 | |||||
| SDSS J | ACIS-S | 2011 Mar 10 | 12167 | 1 | |||||
| SDSS J | ACIS-S | 2011 Mar 16 | 12169 | 1 | |||||
| SDSS J | ACIS-S | 2011 Mar 20 | 12168 | 1 | |||||
| SDSS J | ACIS-S | 2010 Aug 08 | 12170 | 1 | |||||
| SDSS J | ACIS-S | 2011 Jan 22 | 12172 | 1 | |||||
| Archival X-ray Data Objects | |||||||||
| PSS ddThese archival sources are covered by the SDSS footprint. | ACIS-S | 2002 Feb 07 | 3151 | 3 | |||||
| PMN J | ACIS-S | 2003 Dec 16 | 4764 | 4,5 | |||||
| PMN JeeThese sources were observed in multiple XMM-Newton or Swift observations. The parameters listed in this table are for the observation with the longest MOS or XRT exposure time. MOS exposure times have been corrected for the background flares. | MOSffThese objects were observed by both the MOS and pn detectors. We list the MOS exposure times here. | 2001 Sep 15 | 0050150301 | 4,6,7 | |||||
| Q | ACIS-S | 2005 Jul 1 | 5637 | 8,9 | |||||
| SDSS Jd,gd,gfootnotemark: | ACIS-S | 2002 Mar 7 | 3034 | 10 | |||||
| RX J | MOSffThese objects were observed by both the MOS and pn detectors. We list the MOS exposure times here. | 2003 Jun 13 | 0153290101 | 11,12,13 | |||||
| PMN J | XRT | 2008 Jan 07 | 00036791002 | 1,14 | |||||
| SDSS Jd,gd,gfootnotemark: | MOS | 2010 Jul 01 | 0651740301 | 1 | |||||
| CLASS Jd,gd,gfootnotemark: | ACIS-S | 2003 Mar 02 | 3565 | 15 | |||||
| GB d,ed,efootnotemark: | MOSffThese objects were observed by both the MOS and pn detectors. We list the MOS exposure times here. | 2003 Jan 17 | 0111260701 | 16,17,18,19 | |||||
| GB d,gd,gfootnotemark: | ACIS-S | 2001 Jun 10 | 2241 | 20,21,22,23 | |||||
| GB ddThese archival sources are covered by the SDSS footprint. | ACIS-S | 2004 Jun 07 | 4815 | 1,3,16 | |||||
| PMN J | XRT | 2007 Mar 15 | 00036263002 | 1,14 | |||||
| Object Name | R.A. (J2000) | Dec (J2000) | aaThe redshift values for SDSS objects, all of which appear in the SDSS DR7 quasar catalog, are from Hewett & Wild (2010). | bbThe apparent -band magnitude. For objects not in the SDSS footprint, the -band magnitude was estimated from their -band magnitude by assuming a power law with a spectral index of . | ccRadio flux density at observed-frame 1.4 GHz from FIRST or NVSS. | ||
|---|---|---|---|---|---|---|---|
| (deg) | (deg) | (mJy) | |||||
| SDSS J | |||||||
| SDSS J | |||||||
| SDSS J | |||||||
| NVSS J | |||||||
| NVSS J | |||||||
| SDSS J | |||||||
| SDSS J | |||||||
| SDSS J | |||||||
| PMN J | |||||||
| SDSS J | |||||||
| PMN J |
| Full Band | Soft Band | Hard Band | Band | |||
|---|---|---|---|---|---|---|
| Object Name | (0.5–8.0 keV)aaErrors on the X-ray counts were calculated using Poisson statistics corresponding to the 1 significance level according to Tables 1 and 2 of Gehrels (1986). | (0.5–2.0 keV)aaErrors on the X-ray counts were calculated using Poisson statistics corresponding to the 1 significance level according to Tables 1 and 2 of Gehrels (1986). | (2.0–8.0 keV)aaErrors on the X-ray counts were calculated using Poisson statistics corresponding to the 1 significance level according to Tables 1 and 2 of Gehrels (1986). | RatiobbThe band ratio is defined here as the number of hard-band counts divided by the number of soft-band counts. The errors on the band ratio correspond to the 1 significance level and were calculated using equation (1.31) in §1.7.3 of Lyons (1991). The band ratios for all of the Chandra objects observed in the same cycle can be directly compared with one another. | ccThe effective power-law photon indices were calculated using the PIMMS tool (version 3.9). The effects of the quantum-efficiency decay over time at low energies of the ACIS detector were corrected for Chandra observed objects. The Chandra ACIS Cycle 5 response was used for GB 1713+2148, while the Chandra Cycle 12 response was used for the other objects. For J11553107 and J12350003 which do not have photon index estimation, we adopt a typical RLQ photon index value in the following analyses. | |
| Chandra Cycle 12 Objects | ||||||
| SDSS J | ||||||
| SDSS J | ||||||
| SDSS J | ||||||
| SDSS J | ||||||
| SDSS J | ||||||
| SDSS J | ||||||
| Archival X-ray Data Objects | ||||||
| PMN J | ||||||
| SDSS J | ||||||
| GB | ||||||
| PMN J | ||||||
| Count | log | log | log | |||||||||||||
|---|---|---|---|---|---|---|---|---|---|---|---|---|---|---|---|---|
| Object Name | aaThe apparent -band magnitude. | bbThe absolute -band magnitude, corrected for Galactic extinction. | RateccThe count rate of the Chandra-observed sources in the observed-frame soft X-ray band ( keV), in units of . | ddThe Galactic absorption-corrected observed-frame flux between keV in units of ergs cm-2 s-1. | eeThe flux density at rest-frame 2 keV, in units of ergs cm-2 s-1 Hz-1. | ()ffThe logarithm of the X-ray luminosity in the rest-frame 2–10 keV band, corrected for Galactic absorption. | ggThese archival objects have SDSS spectroscopy; they appear in the SDSS DR7 quasar catalog. | hhThe flux density at rest-frame 2500 Å in units of 10-27 ergs cm-2 s-1 Hz-1. | (2500 Å)iiThe logarithm of the monochromatic UV luminosity at rest-frame 2500 Å. | jjThe radio spectral index between observed-frame 1.4–5 GHz, defined as . | (5 GHz)kkThe logarithm of monochromatic radio luminosity at rest-frame 5 GHz. | llThe logarithm of radio loudness; see §3 for definition. | mm: the difference between the measured and the expected for RQQs with similar UV luminosity, defined by the relation in equation (3) of Just et al. (2007). The statistical significance of this difference, , is measured in units of the RMS defined in Table 5 of Steffen et al. (2006). The error range of is –. | nn: the difference between the measured and the expected for RLQs with similar UV and radio luminosities, defined by the relation in Table 7 of Miller et al. (2011) for their full sample. | ||
| (1) | (2) | (3) | (4) | (5) | (6) | (7) | (8) | (9) | (10) | (11) | (12) | (13) | (14) | (15) | (16) | (17) |
| Chandra Cycle 12 Objects | ||||||||||||||||
| SDSS J | ||||||||||||||||
| SDSS J | ||||||||||||||||
| SDSS J | ||||||||||||||||
| SDSS J | ||||||||||||||||
| SDSS J | ||||||||||||||||
| SDSS J | ||||||||||||||||
| Archival X-ray Data Objects | ||||||||||||||||
| PSS | ||||||||||||||||
| PMN J | ||||||||||||||||
| PMN J | ||||||||||||||||
| Q | ||||||||||||||||
| SDSS J | ||||||||||||||||
| RX J | ||||||||||||||||
| PMN J | ||||||||||||||||
| SDSS J | ||||||||||||||||
| CLASS J | ||||||||||||||||
| GB | ||||||||||||||||
| GB | ||||||||||||||||
| GB | ||||||||||||||||
| PMN J | ||||||||||||||||
| Parameter | No. of | No. of Comparison Objects | Mean | Mean | Statistic | Null-hypothesis |
|---|---|---|---|---|---|---|
| Our HRLQs | (No. of X-ray Limits) | (Our HRLQs) | (Comparison Objects) | Probability | ||
| (Worrall et al.’s Objects) | aaThe number of radio-selected objects in our HRLQ sample that satisfy . One object, GB 17132148, has , and thus is excluded from the two-sample tests. | |||||
| (Worrall et al.’s Objects) | ||||||
| (FIRST-selected) | ||||||
| (FIRST-selected) | ||||||
| ()bbThe range of radio luminosity and optical/UV luminosity were determined based on our HRLQs with . Thus all 12 of our HRLQs surviving this cut are included in these tests. | ||||||
| () | ||||||
| ()bbThe range of radio luminosity and optical/UV luminosity were determined based on our HRLQs with . Thus all 12 of our HRLQs surviving this cut are included in these tests. | ||||||
| () | ||||||
| () | ccAll of our 12 HRLQs with are FSRQs except for J14120624 which does not have available measurement. | |||||
| () |
Note. — For the detailed definition of the Peto-Prentice test statistic see Feigelson & Nelson (1985). The null-hypothesis probability was calculated from the test statistic based on a Gaussian distribution, e.g., , where is the cumulative Gaussian probability at .
| Sample | No. of HRLQs | Mean() | Mean() |
|---|---|---|---|
| (No. of X-ray Limits) | |||
| Test Statistic | |||
| Null-hypothesis Probability | |||
| Test Statistic | |||
| Null-hypothesis Probability | |||
| Test Statistic | |||
| Null-hypothesis Probability |
Note. — For the detailed definition of the Peto-Prentice test statistic see Feigelson & Nelson (1985). The null-hypothesis probability was calculated from the test statistic based on a Gaussian distribution, e.g., , where is the cumulative Gaussian probability at .
| Object Name | Count RateaaThe Chandra or XMM-Newton count rate in the observed-frame ultrasoft X-ray band (0.3–1.0 keV), in units of s-1. | bbThe Galactic-absorption corrected flux in the observed-frame ultrasoft X-ray band, in units of erg cm-2 s-1. | ccThe X-ray flux density at rest-frame 2 keV derived from the ultrasoft band count rate, in units of erg cm-2 s-1 Hz-1. | ddThe values obtained from the ultrasoft X-ray band data. | eeThe values obtained from the ultrasoft X-ray band data. | ffThe values obtained from the ultrasoft X-ray band data. | ggThe X-ray power-law photon index (also see Table 3). | |
|---|---|---|---|---|---|---|---|---|
| Chandra Cycle 12 Objects | ||||||||
| SDSS J | ||||||||
| SDSS J | ||||||||
| Archival X-ray Data Objects | ||||||||
| PSS | ||||||||
| PMN J | ||||||||
| PMN J | ||||||||
| Q | ||||||||
| RX J | ||||||||
| CLASS J | ||||||||
| GB | ||||||||
| GB | ||||||||
Note. — The objects included in this table are our HRLQs with , i.e., those HRLQs used in the two-sample analyses in §4.1, except for the two Swift sources (PMN J11553107 and PMN J19510134).
| Object Name | MJDaaThe MJD (Modified Julian Date) listed here is the date of optical/UV spectroscopy. | REW(Ly + N v) | REW(C iv) | |
|---|---|---|---|---|
| Chandra Cycle 12 Objects | ||||
| SDSS JbbTwo objects (J09135919 and J10262542) do not have C iv coverage in their SDSS spectra because of their high redshifts. | ||||
| SDSS J | ||||
| SDSS J | ||||
| SDSS J | ||||
| SDSS J | ||||
| Archival X-ray Data Objects | ||||
| PSS ccReference for emission-line REW measurements: Vignali et al. (2003a). | ||||
| SDSS JbbTwo objects (J09135919 and J10262542) do not have C iv coverage in their SDSS spectra because of their high redshifts. | ||||
| SDSS J | ||||
| CLASS J | ||||
| GB ddReference for emission-line REW measurements: Hook & McMahon (1998). | ||||
| GB | ||||
| GB ddReference for emission-line REW measurements: Hook & McMahon (1998). | ||||
Note. — All REW values are in units of Å.
| Object Name | NTD | ||||
|---|---|---|---|---|---|
| (erg s-1) | (erg s-1) | (erg s-1) | |||
| Chandra Cycle 12 Objects | |||||
| SDSS J | |||||
| SDSS J | |||||
| SDSS J | |||||
| SDSS J | |||||
| Archival X-ray Data Objects | |||||
| SDSS J | |||||
| CLASS J | |||||
| GB | |||||
| REW(Ly + N v) | REW(C iv) | |||||||||
|---|---|---|---|---|---|---|---|---|---|---|
| aa is the sample size. | Spearman | aa is the sample size. | Spearman | |||||||
| Power Law | Power Law | ||||||
|---|---|---|---|---|---|---|---|
| with Galactic Absorption | with Galactic and Intrinsic Absorption | ||||||
| Object Name | aa is the -statistic, while is the total number of spectral bins. | aa is the -statistic, while is the total number of spectral bins. | |||||
| J1026/J1412/J1420/J1659bbOur Chandra Cycle 12 targets with . The names are in the format of ’J’ for brevity. | |||||||
| J0741/J1659ccOur Chandra Cycle 12 targets that are moderately radio loud. The names are in the format of ’J’ for brevity. | |||||||
| Object Name | Photon Flux LimitaaThe upper limit upon the Fermi LAT photon flux between observed-frame 100 MeV–100 GeV. | Energy Flux LimitbbThe upper limit upon the -ray energy flux between observed-frame 100 MeV–100 GeV. | Flux Density LimitccThe upper limit upon the -ray flux density at rest-frame 1 GeV. | ) LimitddThe upper limit upon the monochromatic -ray luminosity at rest-frame 1 GeV. | |
|---|---|---|---|---|---|
| ( photons cm-2 s-1) | ( erg cm-2 s-1) | ( erg cm-2 s-1 Hz-1) | (erg s-1 Hz-1) | ||
| Chandra Cycle 12 Objects | |||||
| SDSS J | |||||
| SDSS J | |||||
| SDSS J | |||||
| SDSS J | |||||
| SDSS J | |||||
| SDSS J | |||||
| Archival X-ray Data Objects | |||||
| PSS | |||||
| PMN J | |||||
| PMN J | |||||
| Q | |||||
| SDSS J | |||||
| RX J | |||||
| PMN J | |||||
| SDSS J | |||||
| CLASS J | |||||
| GB | |||||
| GB | |||||
| GB | |||||
| PMN J | |||||
| Object Name | () | |||
|---|---|---|---|---|
| Chandra Cycle 12 Objects | ||||
| SDSS J | ||||
| SDSS J | ||||
| SDSS J | ||||
| Archival X-ray Data Objects | ||||
| SDSS J | ||||
| CLASS J | ||||
| GB | ||||