FUV Detection of the Suspected Subdwarf Companion
to the Be Star 59 Cygni
Abstract
We report on the detection of a hot subdwarf component in the Be binary system, 59 Cygni. The spectral signature is found in cross-correlation functions of photospheric model spectra with far-ultraviolet spectra obtained by the International Ultraviolet Explorer Satellite, and we used radial velocities from the cross-correlation functions to determine a double-lined spectroscopic orbit. The individual spectra of the binary components were extracted using a Doppler tomography algorithm. The flux of the system is dominated by the rapidly rotating Be star. However, the subdwarf contributes approximately of the UV flux, and its spectrum bears a strong resemblance to that of the hot sdO star BD. Based upon the appearance of the UV spectrum and the orbital elements, we present estimates for the stellar masses, radii, and temperatures. The presence of the hot companion causes excess emission from the outer part of the Be disk facing the companion. We present a set of red spectra that show the orbital phase variations of the He I emission formed in the heated region of the disk, which probably occurs near the disk outer boundary. 59 Cygni, FY Canis Majoris, and Persei comprise the known set of Be binaries with detected hot evolved companions, which are the stripped down remains of mass transfer. Their properties demonstrate that some fraction of Be stars were spun up through angular momentum transfer by Roche lobe overflow.
1 Introduction
The origin of the rapid rotation that characterizes the emission line Be stars is still unknown (Porter & Rivinius, 2003). One important clue is that Be stars are frequently the primary components of massive X-ray binaries with neutron star companions (Reig, 2011), and thus, many are members of binaries that must have interacted in the past (Pols et al., 1991). Past mass transfer from the neutron star progenitor to the mass gainer probably resulted in a spin up of the gainer to near critical rotation (Packet, 1981), and the current mass loss into the circumstellar disk of the Be star represents processes that shed some of the star’s extreme angular momentum. In many cases, the donor star may lose enough mass to drop below the Chandrasekhar limit, and the result may be a hot helium star (spectral type sdO) or (eventually) a white dwarf remnant (Gies, 2000). Such faint companions are very difficult to detect, but because they are hot, searches in the ultraviolet part of the spectrum are favored, and we now have found the UV spectral signatures of hot helium cores in two Be binaries, Per (Gies et al., 1998) and FY CMa (Peters et al., 2008).
Here we turn our attention to the remarkable collection of UV spectra in the archive of the International Ultraviolet Explorer (IUE) of the Be binary 59 Cygni (HD 200120, HR 8047, V832 Cyg). The star is the brightest component of a multiple system with a nearby companion Ab detected through speckle interferometry (Mason et al., 2009). An even closer binary companion of the central star Aa was suspected for a long time, and the first orbital determinations were made by Tarasov & Tuominen (1987) and Rivinius & Štefl (2000) who correctly identified the 28 d orbital period of the binary. Harmanec et al. (2002) presented a joint photometric and spectroscopic analysis, and they determined orbital elements from radial velocity measurements of the H emission line wings (formed in the disk close to the Be star). Maintz (2003) and Maintz et al. (2005) presented additional radial velocity measurements for the Be star, and they showed that anti-phase Doppler shifts are present in the He II absorption line, a feature only found in stars much hotter than the Be star primary (classified as B1.5 Vnne by Lesh 1968). Maintz and collaborators argued that the He II line forms in the atmosphere of a hot, faint companion and that this companion must be the stripped-down remains of the former mass donor star. They also documented how the hot companion illuminates the nearby rim of the Be star’s disk and causes orbital-related emission line variations similar to those observed in the spectra of Per and FY CMa.
The spectral lines of a hot companion should be present in the ultraviolet spectrum, but they may be difficult to discern in individual spectra because of the complex line blending in the UV spectra of hot stars and the relative faintness of the companion compared to the Be star. The general appearance and long-term variations of the strong wind lines in the UV spectrum of 59 Cyg are described in detail by Doazan et al. (1989). Here we apply the cross-correlation method to detect the companion spectrum and to measure its radial velocity variations (Gies et al., 1998; Peters et al., 2008). The measurements and the derivation of orbital elements are described in Section 2, and we use the radial velocity curves and a Doppler tomography algorithm to reconstruct the spectra of both components in Section 3. We describe in Section 4 how the flux of the subdwarf companion heats the nearby region of the Be star disk and creates orbital phase related emission line variations. We summarize these new results on 59 Cyg and their relation to other Be + sdO binaries in Section 5.
2 Radial Velocities and Orbital Elements
The archival spectra of 59 Cyg from observations made with the International Ultraviolet Explorer provide a valuable record of the orbital Doppler shifts associated with the binary motion. Here we describe the observational properties of the spectra, and then we outline our use of the cross-correlation method to measure radial velocities of first the hot secondary star and then the relatively cooler Be star. Because the radial velocity semiamplitude is much larger for the hotter star, we begin the fit of the orbital elements with the hot star velocities and then make a restricted fit of the associated elements for the Be star. We conclude this section with a comparison to earlier published work.
We obtained the UV spectra of 59 Cyg from the NASA Mikulski Archive for Space Telescopes111http://archive.stsci.edu/iue/search.php. The selection focused on observations made with the IUE HIRES, Short Wavelength Prime (SWP) camera, which recorded the far-UV spectrum with a resolving power of . There are a total of 194 such observations that were made between 1978 and 1994. We further limited this sample to the 157 spectra with the best S/N ratio (usually in the better exposed parts of the spectrum). The echelle orders were extracted and combined using pipeline IUERDAF software, and then each spectrum was normalized to unity in relatively line-free regions and transformed to a standard, heliocentric wavelength grid in that spans from 1200 to 1900 Å. The wavelength calibration of each spectrum was checked for possible offsets due to the star’s position in the large aperture by comparing the positions of the strong interstellar lines with those in the global average spectrum. For each spectrum, we made cross-correlation measurements of the pixel shifts between the strong interstellar lines in a given spectrum with those in the average of all the spectra, and then we applied the median of these measurements to shift the observed interstellar spectrum into alignment with the average interstellar spectrum. Then the interstellar lines were removed from each spectrum by replacement with a linear interpolation to the spectrum at the boundaries of each interstellar feature.
Our primary goal is to detect the spectrum of the hot companion in order to measure the star’s radial velocity. It is very difficult to measure the position of any particular line of the companion’s spectrum because of the limited S/N of the observations and the small fraction of the companion’s flux (see below). However, we can measure the signal of the ensemble of spectral lines of the companion by calculating the cross-correlation function (ccf) of the spectrum with that of a model for the hot star. This approach is successful because the companion is so much hotter than the Be star that almost all of its spectral features are comprised of higher ionization species, and consequently the ccf signal is only sensitive to the lines of the hot companion and not to those of the cooler Be star. We constructed a hot star spectrum template from the spectral models of Lanz & Hubeny (2003) for K, , km s-1, and solar abundances. The model was transformed to the observed wavelength scale by flux integration into the same wavelength system, and then the model was convolved with the instrumental broadening function. The ccf was calculated over the entire spectrum after first setting to unity the low wavelength end (1200 – 1226 Å to avoid Ly) and those regions in the immediate vicinity of strong wind lines or interstellar lines. Consequently, the results are largely free from the influence of non-photospheric spectral features.
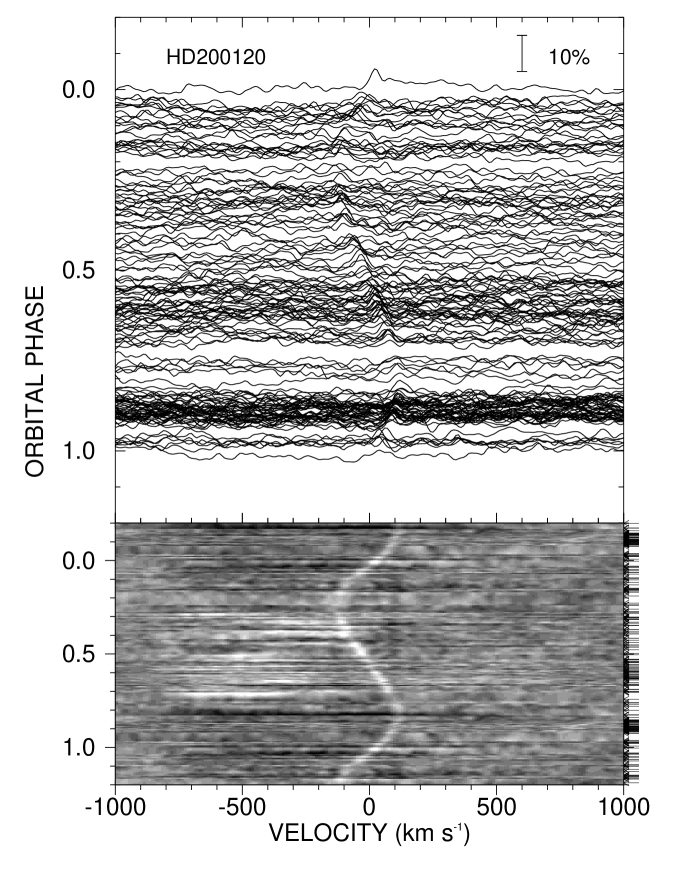
We show the results of the ccf calculations in Figure 1 as a function of radial velocity and orbital phase. The upper panel illustrates the difference between each ccf and the mean of all the ccfs in order to remove the broad and constant background ccf structure caused by low frequency correlation with the Be star spectrum. It is hard to find the peak signal from the spectrum of the hot companion in individual ccfs because the peaks have an amplitude not much larger than the noise. However, the signal is much more evident in the lower panel where the ccf differences are plotted as a gray scale intensity as a function of radial velocity and orbital phase. The bright, “S”-shaped curve reveals the orbital motion of the hot companion, despite the weakness of the signal, thanks to the large number of observations available.
We estimated the radial velocities of the hot companion by fitting a parabola to the central km s-1 around the peak of each ccf. This was not always successful because the peak was too weak in many cases, and in the end we restricted the results to 132 spectra where a reliable measurement was possible. The results are summarized in Table 1 (given in full in the electronic version) that lists the heliocentric Julian date of mid-observation, the corresponding UT date, the IUE SWP number assigned to the spectrum, and orbital phase (see below). Columns 5 – 7 and 8 – 10 then give the measured radial velocity (), uncertainty (), and observed minus calculated residual () for both the primary Be star (see below) and hot companion, respectively. Note that in most cases that the formal uncertainty (based in the formulation of Zucker 2003) is smaller than the absolute value of the residual because the former does not account for uncertainties associated with the wavelength calibration of each spectrum.
We then fit the radial velocities to obtain orbital elements using the non-linear, least-squares solver of Morbey & Brosterhus (1974). The solution was obtained by assigning equal weights to each measurement, which is appropriate for the uniform S/N properties of the final set of measurements. The resulting elements and their uncertainties are given in column 4 of Table 2, where the subscript 2 is used to identify parameters for the hot companion. These include the orbital period , the epoch of periastron , the epoch of Be star superior conjunction (equal to the epoch of inferior conjunction for the hot companion), the velocity semiamplitude , the systemic velocity , the eccentricity , the longitude of periastron , and the root mean square of the residuals from the fit. We adopt the standard orbital phase convention in which orbital phase zero corresponds to the time of periastron. The orbital velocity curve and measured radial velocities are plotted together in Figure 2. Note that the fitting scheme uses a version of the Levenberg-Marquardt method that estimates the parameter errors according to the covariance matrix and the final of the fit.
We also used the cross-correlation method to measure radial velocities for the Be star primary, but in this case we used the average of all the spectra as the spectrum template. This is a reasonable choice because the flux of the Be star dominates the far UV spectrum. The resulting ccfs show a very broad peak that reflects the large rotational broadening of the primary star’s spectrum plus a weak and narrow central peak. We suspect that the latter component may result from residual interstellar lines, edges corresponding to cuts of the stronger interstellar features, and/or lines of the relatively stationary third component, Ab (Mason et al., 2009). Thus, instead of fitting a parabola to the central part, we measured the ccf positions using the bisector of the wings that was calculated using the method of Shafter et al. (1986). The transformation from relative to absolute radial velocity requires an estimate for the velocity of the average spectrum. We found that the velocity offset between the average spectrum and a model (for K, , km s-1; Frémat et al. 2005) was km s-1 (by the wing bisector method). However, this ccf with the model was visibly asymmetrical, and the resulting bisector velocity depended on the part of the wing sampled. Consequently, the transformation from relative to absolute velocity remains problematical, so no correction was applied to the velocities of the primary. The resulting relative velocities, uncertainties, and residuals are listed in columns 5 through 7 of Table 1 for all 157 spectra selected.
A first fit of the primary velocities with only the period fixed resulted in estimates of , , and consistent within uncertainties with the respective values for the secondary but with much larger values of uncertainty. Thus, we simply fixed , , , and to those values derived from the larger amplitude radial velocity curve of the secondary, and then solved for and only. The derived parameters are listed in column 4 of Table 2, and the radial velocity curve and measurements are over-plotted with those for the secondary in Figure 2. With estimates in hand for the parameters of both components, we can then determine the mass ratio, products, and the combined projected semimajor axis , which are all listed in Table 2.
Our results for the radial velocity curve of the hot companion are in excellent agreement with those from Maintz (2003) and Maintz et al. (2005), and this confirms their conclusion that the Doppler shifts of the He II line trace the motion of the hot star. On the other hand, our estimate for the semiamplitude of the Be star is much smaller than that found by Maintz and collaborators, but agrees with the determination from Harmanec et al. (2002) based on the Doppler shifts of the H emission line wings. We think that the difference arises because of residual emission in the He I lines measured by Maintz et al. (2005). They point out that the emission component formed in the outer disk facing the hot companion (which is seen dramatically in He I ; Section 4) will probably partially fill in the absorption profiles of the other He I lines in such a way as to increase the apparent Doppler shifts. The UV lines, on the other hand, correspond to larger energy transitions than those of He I, and the temperatures in the heated portion of the disk are probably insufficient to create any significant emission line flux in the FUV (and we see no evidence of such emission in the IUE spectra). The fact that the velocity semiamplitude we derive from the UV photospheric spectrum is so similar to that from the H emission wings (formed in the inner part of the Be star’s disk) is consistent with the assumption that the Doppler shifts we measure correspond to those of the Be star itself. Estimates of the other orbital elements (with the possible exception of ) are consistent with those from Harmanec et al. (2002), Maintz (2003), and Maintz et al. (2005).
3 Tomographic Reconstruction of the UV Spectra
The nature of the faint companion star can be analyzed through an examination of its UV spectrum. However, because the companion is so faint compared to the Be primary, its spectrum cannot be easily extracted from any individual spectrum. Instead, we used a Doppler tomography algorithm (Bagnuolo et al., 1994) to extract the component spectra, and because this approach uses all the spectra, the reconstructed spectra have a S/N ratio improved by , where is the number of spectra. We used the orbital solutions to determine the radial velocities of the primary and secondary for each spectrum, and we adopted a small flux fraction to begin (that was adjusted later to match spectral depths in the reconstructed spectra; see below). We adopted the same model spectra used for ccf analysis as starting values and we ignored the flux contribution from the faint Ab speckle companion. We ran the Doppler tomography for 50 iterations with a gain of 0.9, and tests showed that the resulting spectra were insensitive to all these assumptions. The reconstructed spectrum of the hot secondary shows considerable wander in the continuum on scales of tens of Ångstroms, so we reset the continuum by forming Gaussian smoothed (FWHM = 610 km s-1) versions of both the reconstructed and model spectra and then by dividing the reconstructed spectrum by the ratio of the smoothed spectra. This method removes all long wavelength span features but retains the narrow features that characterize the spectrum of the secondary. The rectified version of the reconstructed secondary spectrum is illustrated in Figures 3 to 7 that show spectral subregions containing lines of the principle ions that characterize the spectrum.
We compared the reconstructed spectra to TLUSTY/SYNSPEC models from Lanz & Hubeny (2007) for the Be star primary and from Lanz & Hubeny (2003) for the hot secondary. The model for the primary based on the parameters from Frémat et al. (2005) (see Table 3) makes an excellent match of the reconstructed primary spectrum. To find the best match of the reconstructed secondary spectrum, we created a grid of model UV spectra and cross-correlated each one with the reconstructed secondary spectrum. The largest amplitude ccf peak was found at an interpolated effective temperature of 47.3 kK for models with and at 52.1 kK for models with (the highest value available in the published grid of Lanz & Hubeny 2003). This relation presumably makes the best overall match of the Fe IV to Fe V line depth ratios (and of those for other prominent ions). The ccf peak is slightly higher at the highest gravity, which is consistent with the appearance of the pressure broadened wings of He II (Fig. 5). We caution, however, that the models from Lanz & Hubeny (2003) assume solar abundances and a microturbulent velocity of 10 km s-1, and changes about these assumptions will influence the derived best fit temperature. The model spectrum for kK and is shown offset below the reconstructed secondary spectrum in Figures 3 to 7.
Another comparison can be made to the observed UV spectrum of the single, sdO star, BD. The spectrum of this star was analyzed in detail by Lanz et al. (1997) who used the TLUSTY/SYNSPEC models to derive a helium abundance (He:H = 1 by number), kK, , and a microturbulent velocity of 10 km s-1. A comparison with BD is particularly relevant because the hot companion in 59 Cyg is probably He-enriched due to past stripping by mass transfer. Fortunately, there are 92 UV spectra of BD in the IUE archive that were made with the same SWP, high dispersion camera. We obtained these and processed them in the same way as done for the 59 Cyg spectra. Each spectrum was cross-correlated with a model TLUSTY/SYNSPEC spectrum to obtain the radial velocity ( km s-1), and then each spectrum was shifted to the lab frame before co-addition. Finally, the rectification of the mean spectrum was adjusted in the same way as done for the reconstructed secondary spectrum in order to inter-compare the spectra. The final UV spectrum of BD is over-plotted in Figures 3 to 7, and, in general, it makes an excellent match to that of the hot secondary.
The photospheric lines of both the hot secondary and BD appear very sharp, and comparisons with model spectra indicate that any rotational line broadening is unresolved ( km s-1). Consequently, if we assume that the spectrum of BD is an effective match of that of the secondary, then we can find the monochromatic (mean UV) flux ratio of the secondary to primary flux by adjusting the flux ratio used in the tomographic reconstruction so that the resulting line depths match those in the spectrum of BD. We derived this flux ratio by comparing the line depths in smoothed versions of the spectra in nine regions of Å width that contained significantly deep lines. The best fit was obtained with a flux ratio , and this value was used in the tomographic reconstruction shown in Figures 3 to 7. The formal error does not account for changes in line depth due to differences between secondary and BD related to , , abundances, and microturbulence. Our impression from the good match made with the spectrum of BD is that such differences are probably minor. Our results are summarized in Table 3 that lists , , and estimates for the hot subdwarf (column 3) along with those for the Be star (column 2) from Frémat et al. (2005).
4 Heating of the Disk by the Companion
One other means of detecting a hot companion is through observations of line emission from a heated region of the Be star disk that faces the companion (Hummel & Štefl, 2001, 2003). The localized heating effects are especially striking in the weak emission line of He I that usually displays a radial velocity curve similar to that of the companion but with a significantly larger semiamplitude. The He I emission variations are evident in the spectra of the known Be + sdO binaries, 59 Cyg (Maintz et al., 2005), Per (Gies et al., 1993; Štefl et al., 2000), and FY CMa (Peters et al., 2008), and their presence is the basis of the proposed sdO companion of the Be star Pup (Koubský et al., 2012; Rivinius et al., 2012).
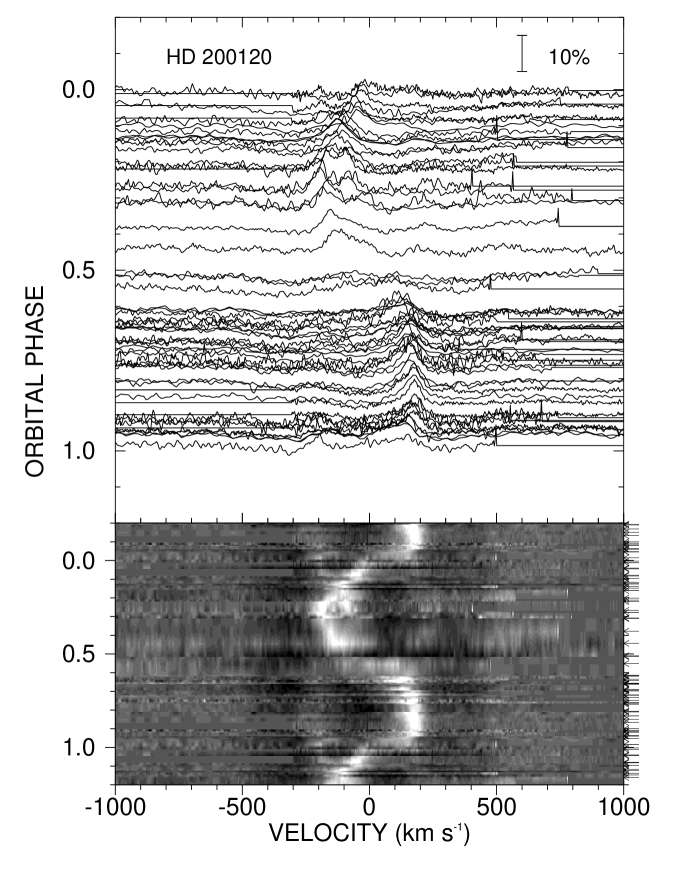
Here we revisit the He I emission line variations in the spectrum of 59 Cyg using a series of spectra we obtained with the Kitt Peak National Observatory Coudé Feed Telescope and additional spectra from the Database of Be Star Spectra222http://basebe.obspm.fr/basebe/ (BeSS) (Neiner et al., 2011). Table 4 lists the origin, time span, spectral resolving power, number of observations, and observer name for the 59 spectra collected. All these spectra have a S/N ratio , a resolving power greater than , and record most of the He I feature (although in some of the BeSS spectra the blue or red wings are located at the boundary of the recorded spectrum). All the spectra were rectified to a unit continuum and were transformed to a uniform wavelength grid in the heliocentric frame. The spectra are presented in Figure 8 as a function of heliocentric velocity and orbital phase (from periastron at phase 0). The upper portion shows the individual spectral profiles with the continua aligned with the orbital phase, and the lower portion shows the spectral fluxes as a gray-scale image made through linear interpolation in orbital phase. The radial velocity excursions of the emission feature resemble those of the hot component (Fig. 1) but the emission has a larger semiamplitude ( km s-1). The overall appearance of the gray-scale figure is very similar to that presented by Maintz et al. (2005) (see their Fig. 2, which shows orbital phase increasing upwards), and this demonstrates that the emission line variations have continued through to the present time.
The He I emission probably originates in the outer parts of the Be star disk that are directly illuminated by the flux of the hot subdwarf companion. The model presented by Peters et al. (2008) for FY CMa (see their Fig. 8) can also be applied here to the case of 59 Cyg. In the reference frame of the Be star, the disk gas near the outer edge has a Keplerian velocity that exceeds that of the companion because of its location closer to the Be star. If we ignore third body effects, then we can estimate the approximate disk radius of line formation according to
| (1) |
where , , and are the semiamplitudes of the Be star, the subdwarf, and the He I emission, respectively. From the estimates given above, we obtain , i.e., the emission region forms about midway between the Be star and subdwarf, presumably at a location near the outer boundary of the disk.
5 Discussion
The physical properties of the component stars are summarized in Table 3. The mass estimates are derived from the orbital results and an orbital inclination range of to advocated by Maintz et al. (2005) based upon the large projected rotational velocity and the past history of spectroscopic shell events. We can estimate the radii from the flux ratio, the spectral energy distribution, and the distance. The observed flux ratio is approximately related to radius ratio by
| (2) |
where is the monochromatic flux ratio per unit area. Using the adopted temperatures in Table 3, we estimate that at 1500 Å based upon the TLUSTY/SYNSPEC models. Then the radius ratio is after correction for the small flux contribution of the Ab component (assuming ; Mason et al. 2009). Touhami et al. (2012) estimated the angular diameter of primary Be star, mas, by fitting the observed FUV spectrum to a composite model spectrum of Aa + Ab. This estimate should be considered as a value intermediate between the polar and equatorial diameters for the rapidly rotating Be star. Then to obtain the physical radius, we need to multiply the angular size times the distance. The original Hipparcos distance was pc (Perryman et al., 1997), which was revised to pc by van Leeuwen (2007). The radii given in Table 3 correspond to a distance range of 345 to 435 pc.
Hot companions of Be stars have now been detected in three systems, 59 Cyg, FY CMa (Peters et al., 2008), and Per (Gies et al., 1998), and there are some striking similarities among these binaries. Table 5 lists the orbital period and eccentricity, mass, effective temperature, and luminosity for each component of these systems. All have a low mass ratio, , and the temperatures of the respective components are very similar. Furthermore, the hot sdO component is a slow rotator in each case, suggesting that the progenitor had realized internal synchronous rotation with the orbit prior to the completion of mass transfer. The hot subdwarfs in these binaries are more massive and brighter than the better known sdO stars in the field that represent a mixture of highly evolved, low mass stars (Heber, 2009). On the other hand, the subdwarfs in Be binaries have temperatures and luminosities that are similar to those predicted by mass transfer models of binary evolution (Wellstein et al., 2001), and their presence is strong evidence that these Be stars were spun up by an earlier stage of mass transfer when the stars were much closer. For example, if we assume conservative mass exchange, an initial mass ratio of (typical of the systems modeled by Wellstein et al. 2001), and a final mass ratio of , then the current orbital periods should be larger than their original periods. Thus, these systems probably began their lives as close pairs of B-stars.
We also list in Table 5 the orbital eccentricities of the Be + sdO binaries. Only 59 Cyg has an eccentricity that is significantly different from zero, which is unusual because the intense tidal forces that the system experienced during large scale mass transfer would tend to circularize the orbit. We suspect that the massive third star in the system, Ab, may be a source of gravitational perturbations that have led to a secular increase of the eccentricity following the conclusion of mass transfer (Ford et al., 2000).
The circumstellar disks of Be stars in Be + sdO systems are probably truncated by the tidal influence of the companion. We showed in Section 4 how the radius of the He I emission region can be estimated based upon Keplerian motion (see eq. 1). The heated region probably forms near the outer disk boundary in the direction of the companion, and it is interesting to compare this emission radius with the Roche radius. We list in the final column of Table 5 the ratio of the emission radius (Gies et al., 1993; Štefl et al., 2000; Peters et al., 2008) to the Roche radius at periastron (derived from the mass ratio and the formula of Eggleton 1983). We see that in all three cases the disk extends to at least of the available Roche radius, so that in these active Be stars the disks are probably as large as permitted by tidal limitations.
The example of 59 Cyg demonstrates that hot subdwarf companions of Be stars can be very difficult to detect. Indeed, it is thanks to the tenacity of the IUE observers that a sufficiently large number of UV spectra were available to make detection possible through the use of cross-correlation and Doppler tomography techniques. Thus, the question of how many Be stars may host hot subdwarf companions (and thus how many were spun up by mass transfer) remains very uncertain because of the observational difficulties surrounding detection. Searching for such hot companions is of key importance to understand how Be stars became rapid rotators and to determine the numbers and kinds of their evolutionary progeny.
References
- Bagnuolo et al. (1994) Bagnuolo, W. G., Jr., Gies, D. R., Hahula, M. E., Wiemker, R., & Wiggs, M. S. 1994, ApJ, 423, 446
- Doazan et al. (1989) Doazan, V., Barylak, M., Rusconi, L., et al. 1989, A&A, 210, 249
- Eggleton (1983) Eggleton, P. P. 1983, ApJ, 268, 368
- Ford et al. (2000) Ford, E. B., Kozinsky, B., & Rasio, F. A. 2000, ApJ, 535, 385
- Frémat et al. (2005) Frémat, Y., Zorec, J., Hubert, A.-M., & Floquet, M. 2005, A&A, 440, 305
- Gies (2000) Gies, D. R. 2000, in The Be Phenomenon in Early-Type Stars, IAU Coll. 175 (ASP Conf. Proc. 214), ed. M. A. Smith, H. F. Henrichs, & J. Fabregat (San Francisco: ASP), 668
- Gies et al. (1998) Gies, D. R., Bagnuolo, W. G., Jr., Ferrara, E. C., et al. 1998, ApJ, 493, 440
- Gies et al. (1993) Gies, D. R., Willis, C. Y., Penny, L. R., & McDavid, D. 1993, PASP, 105, 281
- Harmanec et al. (2002) Harmanec, P., Bozić, H., Percy, J. R., et al. 2002, A&A, 387, 580
- Heber (2009) Heber, U. 2009, ARA&A, 47, 211
- Hummel & Štefl (2001) Hummel, W., & Štefl, S. 2001, A&A, 368, 471
- Hummel & Štefl (2003) Hummel, W., & Štefl, S. 2003, A&A, 405, 227
- Koubský et al. (2012) Koubský, P., Kotková, L., Votruba, V., Šlechta, M., & Dvořáková, Š. 2012, A&A, 545, A121
- Lanz & Hubeny (2003) Lanz,T., & Hubeny, I. 2003, ApJS, 146, 417
- Lanz & Hubeny (2007) Lanz,T., & Hubeny, I. 2007, ApJS, 169, 83
- Lanz et al. (1997) Lanz, T., Hubeny, I., & Heap, S. R. 1997, ApJ, 485, 843
- Lesh (1968) Lesh, J. R. 1968, ApJS, 17, 371
- Maintz (2003) Maintz, M. 2003, Ph.D. dissertation, University of Heidelberg
- Maintz et al. (2005) Maintz, M., Rivinius, T., Stahl, O., Štefl, S., & Appenzeller, I. 2005, Publ. Astron. Inst. Cz., 93, 21
- Mason et al. (2009) Mason, B. D., Hartkopf, W. I., Gies, D. R., Henry, T. J., & Helsel, J. W. 2009, AJ, 137, 3358
- Morbey & Brosterhus (1974) Morbey, C. L., & Brosterhus, E. B. 1974, PASP, 86, 455
- Neiner et al. (2011) Neiner, C., de Batz, B., Cochard, F., et al. 2011, AJ, 142, 149
- Packet (1981) Packet, W. 1981, A&A, 102, 17
- Perryman et al. (1997) Perryman, M. A. C., Lindegren, L., Kovalevsky, J., et al., 1997, A&A, 323, L49
- Peters et al. (2008) Peters, G. J., Gies, D. R., Grundstrom, E. D., & McSwain, M. V. 2008, ApJ, 686, 1280
- Pols et al. (1991) Pols, O. R., Coté, J., Waters, L. B. F. M., & Heise, J. 1991, A&A, 241, 419
- Porter & Rivinius (2003) Porter, J. M., & Rivinius, T. 2003, PASP, 115, 1153
- Reig (2011) Reig, P. 2011, Ap&SS, 332, 1
- Rivinius & Štefl (2000) Rivinius, Th., & Štefl, S. 2000, in The Be Phenomenon in Early-Type Stars, IAU Coll. 175 (ASP Conf. Vol. 214), ed. M. A. Smith, H. F. Henrichs, & J. Fabregat (San Francisco: ASP), 581
- Rivinius et al. (2012) Rivinius, Th., Vanzi, L., Chacon, J., et al. 2012, in Circumstellar Dynamics at High Resolution (ASP Conf. Vol. 464), ed. A. C. Carciofi & Th. Rivinius (San Francisco: ASP), in press
- Shafter et al. (1986) Shafter, A. W., Szkody, P., & Thorstensen, J. R. 1986, ApJ, 308, 765
- Štefl et al. (2000) Štefl, S., Hummel, W., & Rivinius, Th. 2000, A&A, 358, 208
- Tarasov & Tuominen (1987) Tarasov, A. E., & Tuominen, I. 1987, Publ. Astron. Inst. Cz., 70, 127
- Touhami et al. (2012) Touhami, Y. N., Gies, D. R., Schaefer, G. H., et al. 2012, ApJ, submitted
- van Leeuwen (2007) van Leeuwen, F. 2007, A&A, 474, 653
- Wellstein et al. (2001) Wellstein, S., Langer, N., & and Braun, H. 2001, A&A, 369, 939
- Zucker (2003) Zucker, S. 2003, MNRAS, 342, 1291
| Date | UT | SWP | Orbital | ||||||
|---|---|---|---|---|---|---|---|---|---|
| (HJD–2,400,000) | (yyyy-mm-dd) | Number | Phase | (km s-1) | (km s-1) | (km s-1) | (km s-1) | (km s-1) | (km s-1) |
| (1) | (2) | (3) | (4) | (5) | (6) | (7) | (8) | (9) | (10) |
| 43708.914 | 1978-07-19 | 2050 | 0.156 | 4.3 | |||||
| 43864.202 | 1978-12-21 | 3664 | 0.665 | 3.2 | 6.7 | ||||
| 44034.484 | 1979-06-09 | 5464 | 0.706 | 3.8 | |||||
| 44171.905 | 1979-10-25 | 6990 | 0.582 | 3.2 | |||||
| 44277.719 | 1980-02-08 | 7894 | 0.336 | 3.7 | 5.6 |
Note. — A machine readable version of the full Table 1 is available in the electronic edition of the Astrophysical Journal. A portion is shown here for guidance regarding its form and content.
| Element | Harmanec et al. (2002) | Maintz (2003) | IUE ccfs |
|---|---|---|---|
| (days) | |||
| (HJD–2,400,000) | |||
| (HJD–2,400,000) | |||
| (km s-1) | |||
| (km s-1) | |||
| (km s-1) | aaRelative to the mean spectrum template. | ||
| (km s-1) | |||
| 0bbFixed. | |||
| (deg) | |||
| () | |||
| () | |||
| () | |||
| rms1 (km s-1) | 3.1 | 8.1 | |
| rms2 (km s-1) | 9.1 |
| Parameter | Primary | Secondary |
|---|---|---|
| (kK) | ||
| (cgs) | ||
| (km s-1) | ||
| Source | Dates | Number | Observer | |
|---|---|---|---|---|
| KPNO/CF | 1987 – 1999 | 25800 | 22 | Peters |
| BeSS/OHP/Elodie | 2003 | 45000 | 8 | Neiner |
| KPNO/CF | 2004 – 2008 | 9500 | 6 | Grundstrom |
| BeSS/Castanet | 2008 – 2012 | 10000 | 4 | Buil |
| BeSS/Revel | 2009 | 10000 | 1 | Thizy |
| BeSS/OVA | 2010 – 2012 | 10000 | 18 | Mauclaire |
| Star | |||||||||
|---|---|---|---|---|---|---|---|---|---|
| Name | (d) | (Be) | (sdO) | (Be) | (sdO) | (Be) | (sdO) | ||
| 59 Cyg | 28.2 | 0.14 | 0.9 | 4.3 | 4.7 | 3.9 | 3.0 | 0.88 | |
| FY CMa | 37.3 | 0.00 | 1.1 | 0.1 | 4.4 | 4.7 | 4.2 | 3.3 | 0.92 |
| Per | 126.7 | 0.00 | 1.0 | 0.1 | 4.4 | 4.7 | 4.3 | 4.1 | 0.78 |