Results on
Jack L. Ritchie
Department of Physics
University of Texas at Austin
Austin, TX 78712, USA
Representing the B A B AR Collaboration
Proceedings of CKM 2012, the 7th International Workshop on the CKM Unitarity Triangle, University of Cincinnati, USA, 28 September - 2 October 2012
1 Introduction
The flavor-changing neutral current process , shown in Figure 1, is of interest because it is one of the most reliably calculable of such processes in the Standard Model (SM) and also because many new physics scenarios (e.g., SUSY) may lead to deviations from the SM decay rate.
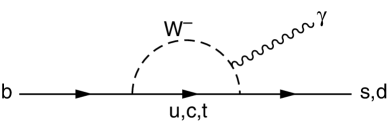
Heavy-quark hadron duality implies this decay rate is very close to the decay rate for , where represents any hadronic system containing a strange particle. The current next-to-next-to leading order calculation [1] gives:
for ( is the photon energy in the rest frame of the meson). Measurements of the photon spectrum can constrain Heavy Quark Effective Theory parameters and help to reduce the uncertainties in the extraction of CKM elements and from semileptonic decays.
Experimentally, measuring is challenging. Multiple approaches are undertaken, each with strengths and weaknesses. B A B AR’s final results are presented here for two of the alternative approaches. In one, a fully inclusive measurement is performed by detecting only the high-energy photon from the signal decay, and using a lepton ( or ) from the semileptonic decay of the other in the event to suppress backgrounds. This method has the advantage of being inclusive, but the photon energy is smeared by the energy resolution of the electromagnetic calorimeter and also by the motion of the signal in the center of mass frame. A subtraction of backgrounds from other decays ultimately leads to a systematic error that is larger than the statistical uncertainty. Also, this method does not distinguish events from , so effectively they are combined. The second approach is a semi-inclusive measurement, in which a large number of exclusive modes are fully reconstructed and combined. This method has the virtue that the signal is reconstructed, providing a precise determination of the photon energy in the rest frame via the relation , but suffers from the fact that the measurement is not inclusive. Many modes are not included, and the uncertainty in estimating the missing modes introduces a systematic error that dominates the measurement. In both cases, all analysis procedures and event selection criteria were determined before they were applied to real data in the signal regions.
2 Fully Inclusive Results
The fully inclusive analysis [2, 3] used of data collected at the at the SLAC PEP-II B-factory. The challenge is illustrated in Figure 2(a), which shows the expected SM signal, the decay
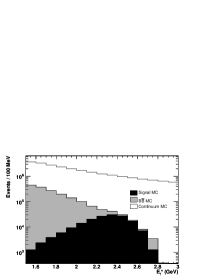
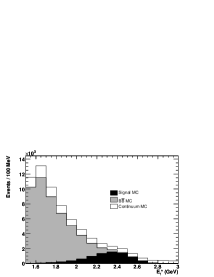
background, and the continuum background after selection of a high-energy photon satisfying , where is the photon energy in the rest frame. Figure 2(b) shows the situation after all event selection criteria have been applied (achieving background rejection of about with a signal efficiency of 2.6%). The large background can only be suppressed by imposing a cut on the photon energy, chosen to be .
The remaining backgrounds are subtracted using Monte Carlo that is corrected using data control samples. The result for data, after background subtraction, is shown in Figure 3(a).
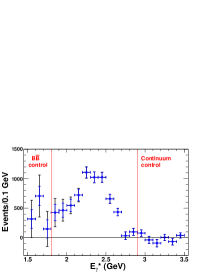
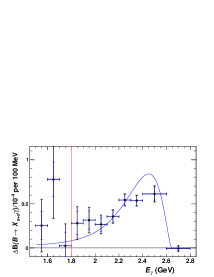
The branching fraction is extracted from the event yield in the signal region defined by by applying a signal efficiency correction, corrections for smearing due to calorimeter energy resolution and motion of the signal in the frame, and a correction to account for contamination (assuming the rates are related by CKM factors and using . The result is
for , where the first error is statistical, the second is systematic, and the third represents the uncertainty in the signal efficiency from uncertainties in the model for the photon spectrum.
An unfolding procedure is applied to extract the photon spectrum in the meson rest frame. This procedure corrects for calorimeter resolution smearing, smearing due to the motion of the in the rest frame, and corrects for detector and selection efficiencies. The unfolded spectrum is shown in Figure 3(b). In addition, the first, second, and third moments of this spectrum, useful for determining Heavy Quark Effective Theory (HQET) model parameters, are reported in Reference [3].
A test for direct CP violation can be made by comparing the decay rates for versus , using the charge of the tag lepton to separate the two categories. This measurement, which includes events, is a strong test for new physics since the SM expectation[5] is negligibly different from zero. The result, in the optimized energy range , is
3 Semi-inclusive Results
The semi-inclusive analysis [4] used of data and reconstructs the 38 exclusive modes listed in Table 1.
Signal selection and background rejection is accomplished using random forest classifiers trained on Monte Carlo signal and background samples. After reconstruction, events are binned as a function of the mass of the hadronic system, , and maximum likelihood fits are performed in each of 18 mass bins to extract signal yields. Figure 4(a) shows the resulting spectrum. The corresponding photon spectrum, shown in Figure 4(b), is obtained using .
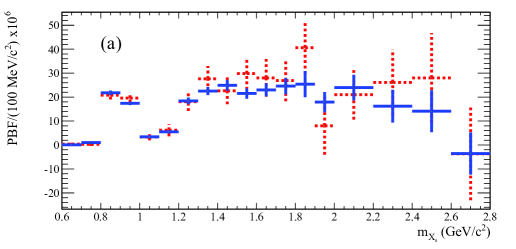
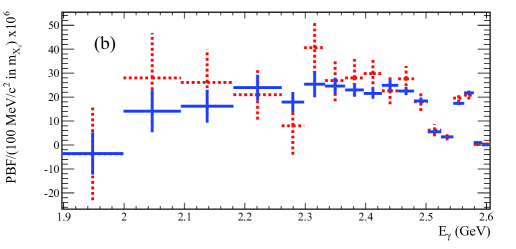
The branching fraction is obtained summing the partial (bin-by-bin) branching fractions shown in Figure 4, giving the result:
for . The first error is statistical and the second error is systematic. The systematic error, which dominates, is mainly due to the missing modes.
Moments of the spectrum are also measured and the spectrum is fit to determine the parameters of HQET models. In particular, fits are performed to determine the parameters and in both the “kinetic” scheme and the “shape function” scheme. The results are given in Table 2.
| Kinetic scheme | Shape function scheme | |
|---|---|---|
4 Conclusions
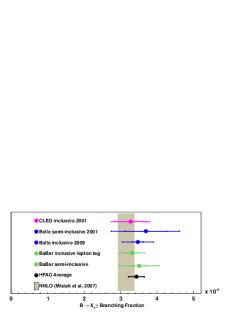
B A B AR has reported final results from two analyses of , providing branching fractions, spectra, and spectral moments, as well as testing for direct CP violation. The branching fraction measurements are in good agreement with the SM theory expectation, as shown in Figure 5. The figure shows comparable results of all experiments, extrapolated to a common energy cutoff of using the Heavy Flavor Averaging Group (HFAG) extrapolation factors [6].
This work was supported in part by Department of Energy contract DE-AC02-76SF00515.
References
- [1] M. Misiak et al. , Phys. Rev. Lett. 98, 022002 (2007).
- [2] J. P. Lees et al. [B A B AR collaboration], Phys. Rev. Lett. 109, 211801 (2012).
- [3] J. P. Lees et al. [B A B AR collaboration], arXiv:1207.5772 [hep-ex]; to be published in Phys. Rev. D.
- [4] J. P. Lees et al. [B A B ARcollaboration], Phys. Rev. D 86, 052012 (2012).
- [5] M. Benzke, S.J. Lee, M. Neubert, G. Paz, Phys. Rev. Lett. 106, 141801 (2011).
- [6] http://www.slac.stanford.edu/xorg/hfag/rare/2012/radll/btosg.pdf
- [7] S. Chen et al., [CLEO collaboration], Phys. Rev. Lett. 87, 251807, (2001).
- [8] K. Abe et al., [Belle collaboration], Phys. Lett. B 511, 151 158 (2001).
- [9] A. Limosani et al., [Belle collaboration], Phys. Rev. Lett. 103, 241801 (2009).