Week 52 Influenza Forecast for the 2012-2013 U.S. Season
Abstract
This document is another installment in a series of near real-time weekly influenza forecasts made during the 2012-2013 influenza season. Here we present some of the results of forecasts initiated following assimilation of observations for Week 52 (i.e. the forecast begins December 30, 2012) for municipalities in the United States. The forecasts were made on January 4, 2013. Results from forecasts initiated the five previous weeks (Weeks 47-51) are also presented.
1 Observations
The forecasts are again dealing with shifting observations. Week 51 census division infectivity rates as posted this week (January 4, 2013) versus last week (when the Week 51 estimates were first published on December 28, 2012) have changed substantially for a number of divisions. For instance, infectivity among assayed individuals in the West South Central doubled to 26% from 13% with the addition of much more data (1393 assays v. only 68 last week). Clearly, the data last week were incomplete. More typically the division sample size increases 25-300%; however, strangely, the infectivity rate goes up in all but one instance (Table 1). For New England, the infectivity rate increases 22 percentage points; for the Mid-Atlantic it doubles from 20% to 40%; for the West North Central it increases 16 percentage points.
| Region | December 28, 2012 | January 4, 2013 |
|---|---|---|
| New England | 27.85% (348) | 49.88% (808) |
| Mid-Atlantic | 20.04% (484) | 40.11% (1224) |
| South Atlantic | 29.94% (2498) | 34.01% (3452) |
| East North Central | 61.97% (476) | 56.73% (855) |
| East South Central | 26.61% (218) | 38.56% (319) |
| West North Central | 25.95% (682) | 42.28% (1147) |
| West South Central | 13.24% (68) | 26.49% (1393) |
| Mountain | 36.83% (649) | 39.45% (1985) |
| Pacific | 15.54% (811) | 16.68% (1037) |
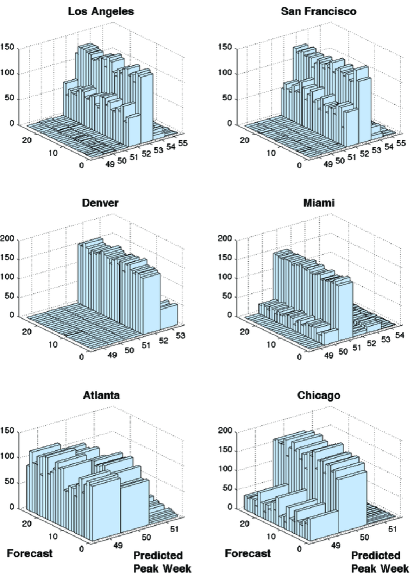
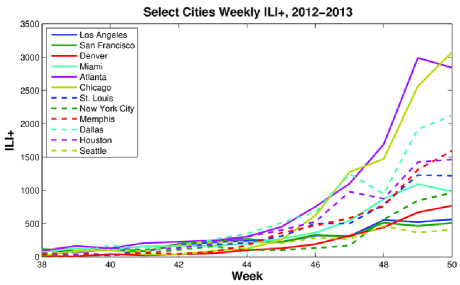
These increases are large and affect the ILI+ observational metric. Last week, based on the Week 51 observations, Dallas, Memphis and Houston appeared to be abating, having peaked in Week 50 (Figure 1). This, of course, suggested to the model during assimilation that the peak had abated as well, which likely affected its parameter optimization and prediction trajectories. However, this week, with the revised infectivity numbers, Week 51 is now peak for these cities.
It is likely that Week 52 will shift as well, next week. Most of the census divisions have reported the Week 52 data with a higher sample size (than Week 51 presented with last week). Hopefully, this will lessen any shifts in the infectivity rates come next week. We may have to adjust the observational error variance estimate of the ILI+ data based on the sample size of the census division data (though this will give no indication of spatial heterogeneities within these relatively large geographies, if a particular locality, say Chicago, hasn’t reported at all).
This year, given the high levels of media coverage of influenza activity, it is also possible that the GFT ILI estimates have become biased high in the last few weeks.
1.1 A Test
We tested the effect of the shifted observations, by re-running the Week 51 forecast–i.e. assimilation of observations through Week 51 and then forecast beginning December 23, 2012–however, instead of using the census division infectivity rates posted December 28, 2012, as performed previously (Shaman et al., 2012c, ), we used the observations posted January 4, 2013. That is, we used the latest observations, but dropped the Week 52 data, and ran the forecasts after assimilating the Week 51 data.
When the results of these forecasts (not shown) are compared with those generated last week (again the only difference is the altered census division infectivity rates), the predicted peaks shift for 6 of the 12 cities. St. Louis, Seattle and Memphis are predicted to peak a full week later; Los Angeles and Houston are predicted to peak a half week later (e.g. from a Week 50 prediction to a Week 50-51); and New York City is predicted to peak a half week earlier (from Weeks 51-52 to Week 51).
New York City is in the Mid-Atlantic census division for which the infectivity rate doubled with the revised numbers. Los Angeles, however, is in the Pacific census division, which saw a very small change. In truth, the changes in the forecasts often are more subtle and really reflect a change in the distribution of predictions within each ensemble, such that the mode prediction changes. We shall see how important these effects are after the season when the numbers are fully codified and we can run the forecasts again retrospectively and determine if the forecast accuracy truly was degraded by these hiccups in the data flow.
2 2012-2013 Forecast
The forecast methods are similar to those described in Shaman and Karspeck, (2012). Based on the relationship between prediction accuracy and ensemble spread of these retrospective forecasts we can assign calibrated confidences to our current predictions. Two forecast types are presented: one run with an absolute humidity (AH)-forced SIRS model; the other with no AH forcing. Additional documentation of earlier forecasts for this season have also been posted (Shaman et al., 2012a, ; Shaman et al., 2012b, ; Shaman et al., 2012c, ).
2.1 Week 52 Forecast
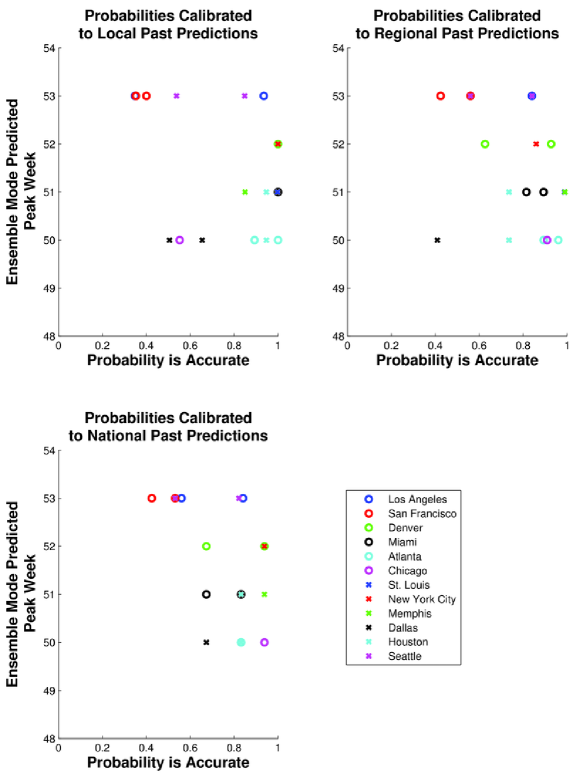
Table 2 presents the forecasts initiated after assimilation of observations through Week 52. The first forecast day is December 30, 2012. These forecasts use the AH-forced SIRS model and were performed on January 4, 2013 with GFT ILI municipal estimates and census division infectivity rates through Week 52 (the latter as published online on January 4, 2013).
| City | Week 52 | Week 51 | Week 50 | Week 49 | Week 48 | Week 47 |
|---|---|---|---|---|---|---|
| Prediction | Prediction | Prediction | Prediction | Prediction | Prediction | |
| Los Angeles | 53 (35-95%) | 51-52 (35-60%) | 52 (50-95%) | 51-52 (35-90%) | 51-52 (20-55%) | 51 (15-30%) |
| San Francisco | 53 (35-60%) | 52 (25-45%) | 52 (35-85%) | 51-52 (25-40%) | 51 (30-85%) | 50-51 (25-60%) |
| Denver | 52 (60-99%) | 52 (50-99%) | 52 (20-60%) | 52 (20-55%) | 51-52 (0-55%) | 51 (10-30%) |
| Miami | 51 (65-99%) | 51-52 (30-99%) | 51 (40-60%) | 51 (40-99%) | 50-51 (40-55%) | 50-51 (0-45%) |
| Atlanta | 49-50 (80-99%) | 49-50 (80-99%) | 49 (80-99%) | 49 (90-99%) | 49 (80-95%) | 49 (80-95%) |
| Chicago | 50 (55-95%) | 50 (55-95%) | 49-50 (55-95%) | 49 (55-95%) | 49 (35-80%) | 49 (35-80%) |
| St. Louis | 51 (80-99%) | 50 (80-99%) | 51 (85-99%) | 50-51 (80-99%) | 50 (85-99%) | 51 (30-90%) |
| New York City | 52 (85-99%) | 51-52 (20-99%) | 52 (25-99%) | 51 (25-99%) | 52-53 (25-60%) | 53-54 (25-55%) |
| Memphis | 51 (80-99%) | 50 (70-99%) | 51 (20-80%) | 50 (20-80%) | 50 (15-80%) | 49-50 (15-55%) |
| Dallas | 50 (40-70%) | 50 (65-95%) | 50 (65-90%) | 49-50 (65-85%) | 49 (50-75%) | 49 (40-85%) |
| Houston | 50-51 (70-95%) | 50 (70-95%) | 50 (75-90%) | 50 (50-60%) | 50 (50-60%) | 49 (50-85%) |
| Seattle | 53 (50-90%) | 51-52 (20-60%) | 52-53 (0-55%) | 52-53 (5-55%) | 51-52 (5-55%) | 51 (5-35%) |
As a number of observations now indicate a later observed peak, the city forecasts have shifted later. Note that these “forecasts” are in fact predictions that the peak is in the past, e.g. Week 51; however, they are still a “forecast” in that there is a prediction of no further increase of influenza incidence.
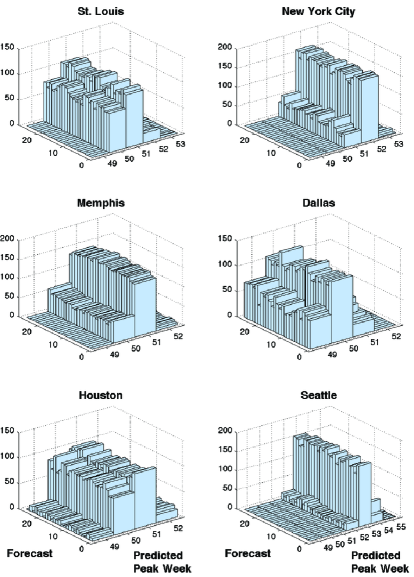
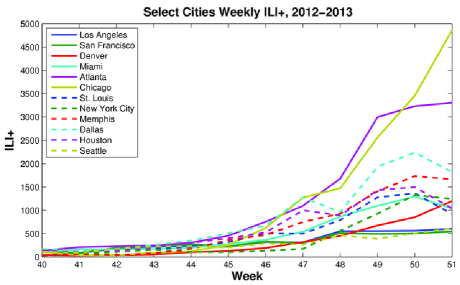
Atlanta is predicted to peak during Weeks 49-50, and Chicago and Dallas are predicted to peak during Week 50 (Figure 2). At present, Week 51 is the observed peak for Atlanta and Dallas (Figure 1), which is within the accuracy of the forecast for the Dallas forecasts, but Week 52 is greatest (thus far) for Chicago. Consequently, the Chicago forecast is not accurate (in spite of the high certainty, Table 2).
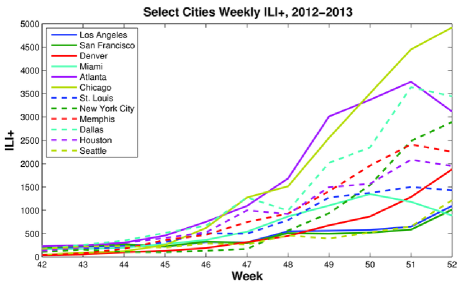
Houston has shifted slightly with peak predictions of Week 50-51 (Figure 3). Presently, the peak is observed for Week 51.
Miami, St. Louis and Memphis are now all predicted to have peaked during Week 51. This is a one-week shift later from the prior weeks for St. Louis and Memphis, though both had early forecasts predicting a Week 51 peak (Table 2). Miami appears to have peaked during week 50, St. Louis during week 51 (by a smidge), and Memphis also during week 51 (Figure 1).
Denver and New York City are predicted to have a Week 52 peak. These predictions are consistent with prior weeks. Both Denver and New York City showed continued increasing influenza activity, as measured by our ILI+ metric, through Week 52 (Figure 1).
Los Angeles, San Francisco, and Seattle have all shifted, and are now predicting a peak during Week 53 (the week ending January 5, 2013).
2.2 Week 52 Forecast – No AH
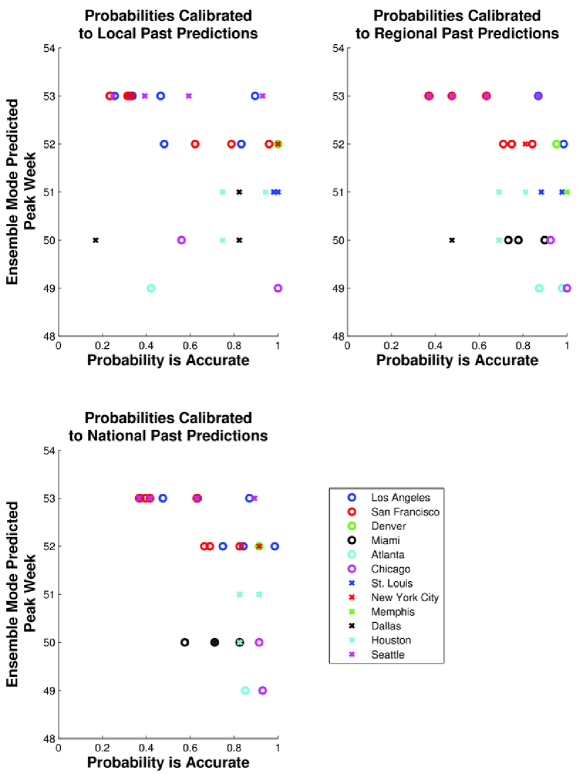
Forecasts initiated at the beginning of Week 53/1 (December 30, 2012, after assimilation of Week 52 observations) using an SIRS model without absolute humidity forcing show a few peak week prediction shifts from the previous weeks (Table 3). Both Los Angeles and San Francisco have predicted peaks during weeks 52-53 with this model, and this is a half week later than the prediction made last week (Week 51), and 1.5 weeks later than the Week 50 prediction. In contrast, the predictions for Los Angeles and San Francisco with the AH-forced model have been a bit more stable from week-to-week (Table 2). This, of course, provides no assessment of their accuracy, just that they have not shifted quite as much.
| City | Week 52 | Week 51 | Week 50 | Week 49 | Week 48 |
|---|---|---|---|---|---|
| Prediction | Prediction | Prediction | Prediction | Prediction | |
| Los Angeles | 52-53 (25-99%) | 52 (25-50%) | 51 (25-50%) | 50-51 (25-50%) | 50 (25-50%) |
| San Francisco | 52-53 (20-85%) | 52 (30-50%) | 51 (30-60%) | 50-51 (30-60%) | 50 (30-50%) |
| Denver | 52 (90-99%) | 52 (50-99%) | 52 (50-80%) | 51-52 (40-85%) | 51 (40-60%) |
| Miami | 50 (55-90%) | 50 (55-80% | 50-51 (40-80%) | 50 (10-99%) | 50 (5-65%) |
| Atlanta | 49 (40-99%) | 49-50 (80-99%) | 49 (80-99%) | 49 (90-99%) | 49 (25-95%) |
| Chicago | 49-50 (55-99%) | 50 (45-95%) | 49 (55-95%) | 49 (55-95%) | 49 (25-65%) |
| St. Louis | 51 (80-99%) | 50 (70-99%) | 51 (80-95%) | 50 (80-95%) | 50 (35-95%) |
| New York City | 52 (80-99%) | 52 (30-60%) | 51-52 (30-60%) | 51 (30-60%) | 52-53 (25-60%) |
| Memphis | 51 (90-99%) | 50 (70-99%) | 50 (45-99%) | 50 (10-90%) | 49-50 (15-55%) |
| Dallas | 50-51 (15-85%) | 50 (80-95%) | 50 (65-90%) | 49 (15-85%) | 49 (40-80%) |
| Houston | 50-51 (70-95%) | 50 (70-90%) | 50 (80-95%) | 50 (60-70%) | 49-50 (30-70%) |
| Seattle | 53 (35-90%) | 52 (20-65%) | 51-52 (20-50%) | 51-52 (20-45%) | 51 (0-50%) |
The other city forecasts with the SIRS model without AH forcing have been more stable in recent weeks (perhaps with the exception of Seattle (Figure 4). These cities are also fairly consistent with the AH-forced solutions (Table 2).
Acknowledgments
Funding was provided by US NIH grant GM100467 (JS, AK, ML), as well as NIEHS Center grant ES009089 (JS) and the RAPIDD program of the Science and Technology Directorate, US Department of Homeland Security (JS). The content is solely the responsibility of the authors and does not necessarily represent the official views of the National Institute Of General Medical Sciences, National Institutes of Health, or Department of Homeland Security.
References
- Shaman and Karspeck, (2012) Shaman, J. and Karspeck, A. (2012). Forecasting seasonal outbreaks of influenza. Proc. Natl. Acad. Sci. U.S.A., 109(50):20425–20430.
- (2) Shaman, J., Karspeck, A., and Lipsitch, M. (2012a). Week 49 influenza forecast for the 2012-2013 U.S. season. ArXiv, 1212.4678 [q-bio.PE].
- (3) Shaman, J., Karspeck, A., and Lipsitch, M. (2012b). Week 50 influenza forecast for the 2012-2013 U.S. season. ArXiv, 1212.5750 [q-bio.PE].
- (4) Shaman, J., Karspeck, A., and Lipsitch, M. (2012c). Week 51 influenza forecast for the 2012-2013 U.S. season. ArXiv, 1212.6678 [q-bio.PE].