11
A. Bellini
HST Proper Motions of Stars within Globular Clusters
Abstract
The stable environment of space makes HST an excellent astrometric tool. Its diffraction-limited resolution allows it to distinguish and measure positions and fluxes for stars all the way to the center of most globular clusters. Apart from small changes due to breathing, its PSFs and geometric distortion have been extremely stable over its 20-year lifetime. There are now over 20 globular clusters for which there exist two or more well-separated epochs in the archive, spanning up to 10+ years. Our photometric and astrometric techniques have allowed us to measure tens of thousands of stars per cluster within one arcmin from the center, with typical proper-motion errors of 0.02 mas/yr, which translates to 0.8 km/s for a typical cluster. These high-quality measurements can be used to detect the possible presence of a central intermediate-mass black hole, and put constraints on its mass. In addition, they will provide a direct measurement of the cluster anisotropy and equipartition. We present preliminary results from this project, and discuss them in the context of what is already known from other techniques.
keywords:
Astrometry: proper motions – Stars: Population II – Galaxy: globular clusters1 Introduction
We measured high-precision proper motions (PMs) in the cores of 23 globular clusters (GCs) for which good HST data exist. We focused our attention on ACS/WFC, ACS/HRC, and WFC3/UVIS exposures, which provide smaller pixel sizes, higher stability of the geometric distortion solution, and higher dynamic range than other HST detectors. The biggest step forward provided by our velocity measurements will be the large number of PMs within the crowded core of each cluster, from the tip of the red-giant branch down to faint main-sequence stars. The time baseline for these clusters goes from 2 up to 10 years.
Although the stable environment of space offers unsurpassed image quality and stability, reaching high-precision astrometry (and photometry) requires a careful treatment of possible systematic effects: undersampling, space- and time-variable PSF models, geometric-distortion corrections, charge-transfer inefficiency, and transformations between dithered images. All these issues have been properly addressed by our group, and we are working in further improving our solutions (Anderson & King 2006a, 2006b, Bellini & Bedin 2009; Anderson & Bedin 2010; Bellini, Anderson & Bedin 2011).
We consider each exposure as representing a stand-alone epoch, and transformed star positions from each exposure onto the reference frame (usually the GC treasury catalogs from Sarajedini et al. 2007). Then, for each star we fit the two position components as a function of the epoch, assuming linear motion. We iteratively rejected the most extreme point if it is not in agreement with the trend to within its expected error.
In the following, we will give an introductory view of the project, anticipated scientific results, and some examples.
2 The catalogs
Table 1 lists analyzed clusters and the number of objects for which we measured high-precision proper motions. The field-of-view varies from cluster to cluster, depending on the detector used and the overlap among epochs. The proper motion accuracy is of the order of 0.8 km/s for well-exposed stars at a typical cluster distance, assuming an average time baseline. These PM measurements are still preliminary, and we are in the process of fine tuning our techniques to further improve them and minimize possible source of systematics.
| Table 1 | |||
| Analyzed Clusters and PM catalogs size | |||
| Cluster | sources | Cluster | sources |
| NGC 104 | 106 000 | NGC 6388 | 37 000 |
| NGC 288 | 15 000 | NGC 6397 | 14 000 |
| NGC 362 | 74 000 | NGC 6441 | 57 000 |
| NGC 1851 | 88 000 | NGC 6535 | 4000 |
| NGC 2808 | 17 000 | NGC 6624 | 2000 |
| NGC 5139 | 293 000 | NGC 6656 | 54 000 |
| NGC 5904 | 71 000 | NGC 6681 | 28 000 |
| NGC 5927 | 63 000 | NGC 6715 | 74 000 |
| NGC 6121 | 9000 | NGC 6752 | 47 000 |
| NGC 6266 | 57 000 | NGC 7078 | 76 000 |
| NGC 6341 | 84 000 | NGC 7099 | 2000 |
| NGC 6362 | 8700 | ||
2.1 Anticipated science results
High-precision proper motions in GCs allow us to undertake quite a large variety of scientific investigations. To name a few:
-
•
cluster-field separation: in order to study a bona-fide sample of cluster members;
-
•
internal motions: to study kinematics and dynamics of GCs;
-
•
multiple-populations individual kinematics/dynamics: to look for fossil signatures of a different formation process;
-
•
Absolute motions: e.g., using background galaxies or field stars as a reference;
-
•
geometric distance: by comparing the line-of-sight velocity dispersion with that on the plane of the sky;
-
•
GCs rotation on the plane of the sky: from a measure of the stellar velocities as a function of position angle in different radial bins;
-
•
Equipartition: from the analysis of stars’ velocity dispersion as a function of the their mass;
-
•
radial mass distribution: by studying stars’ velocity dispersion as a function of their distance from the cluster center;
-
•
(an)isotropy: by comparing tangential and radial components of stars’ motion;
-
•
full 3D dynamics: in case also line-of-sight velocities are known;
-
•
constraints on the presence of an intermediate-mass black hole: looking both for fast-moving individual stars and for an increase in central velocity-dispersion-profile (van der Marel & Anderson 2010);
-
•
etc…
Below, we will show a few examples of what can be done with high-precision proper motions.
2.2 Absolute proper motions
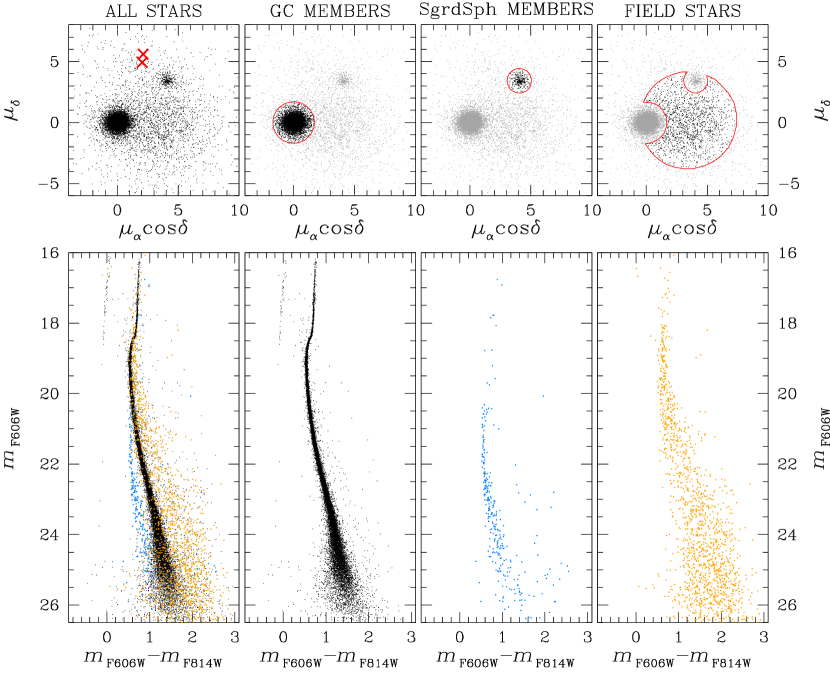
Figure 1 shows proper-motion diagrams (on top) and the corresponding CMDs (on bottom) for NGC 6681. It is clear from the figure that we can: (i) clearly separate cluster members (in black) from field stars (in yellow); (ii) isolate Sgr dSph stars (in azure) in the background; and (iii) resolve the internal motion of the cluster (because the stellar dispersion in the proper motion diagrams is far larger than that of Sgr dSph stars, which in turn reflects our internal proper motion errors). We quickly identified by eye two galaxies with sharp nuclei in our images, and marked their position on the top-left panel, with red crosses. Their average location on the proper-motion diagram can be used to define the zero-point of the absolute motion of cluster, field (and in turn, constrain the Galaxy potential), and Sgr dSph stars in the background.
2.3 Mass segregation and equipartition
Thanks to the extended field-of-view (up to 100 arcsec or more) of most of the clusters (typically beyond the half-light radius), the availability of high-precision PMs even in the dense clusters core, and, most importantly, the fact that we can now measure kinematics as a function of the position on the main sequence (stellar mass), for the first time we have the possibility to directly study in detail the degree of equipartition of each cluster (by measuring at the same time stars’ velocity and mass), using thousands of stars and two components of the motion.
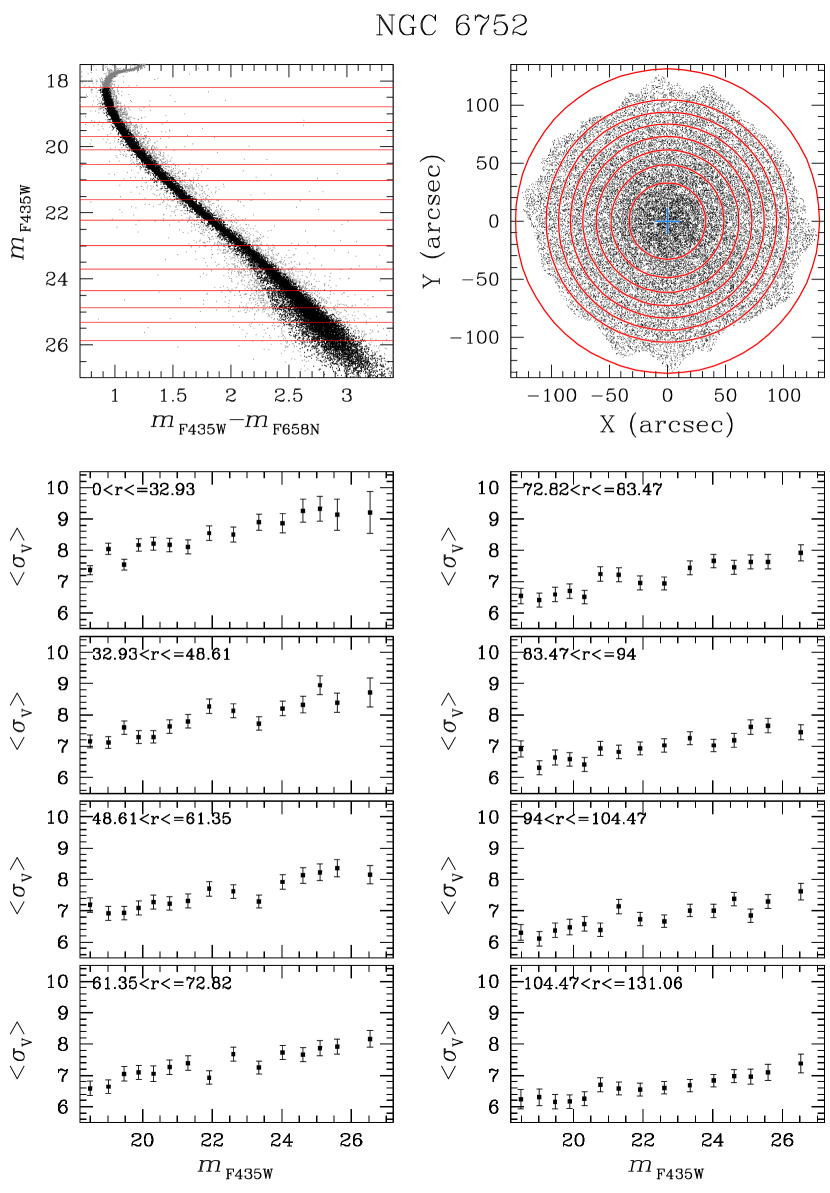
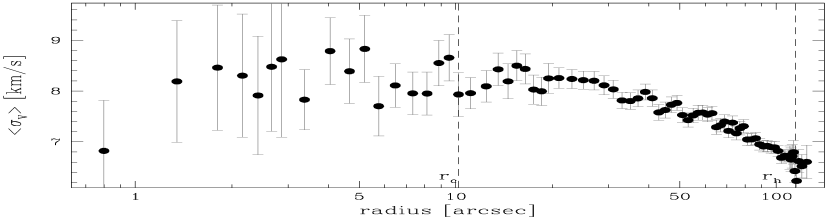
Figure 2 illustrates the case for NGC 6752. The top panels show the main sequence of the cluster (which we divided into 15 equally-populated magnitude bins, on the left), and the total field-of-view (divided into 8 radial intervals, on the right). The eight panels below show, for each radial interval, the average velocity dispersion within each magnitude bin. We can easily see, from the figure, that inner stars move, on average, faster than outer ones. Moreover, more massive stars are slower than less massive ones. In Figure 3 we extended our analysis to all stars, regardless of their evolutionary stage, and plot their as a function of the logarithmic radial distance from the cluster center. The distribution appears, within the errors, to be flat inside 3 core radii, then it drops steeply.
One way to infer whether a cluster has reached equipartition is to measure the slope of the average velocity dispersion vs. stellar mass in the log-log plane: a value of 0.5 would mean that the cluster is in full equipartition. On the other hand, a flat slope implies no equipartition at all. In Figure 4 we show this slope for a sample of eight GCs. The preliminary slopes we measured range from zero to 0.5, and suggest that the paradigm that all GCs have reached equipartition long ago may not be valid.
3 Conclusions
Our preliminary results clearly demonstrate the power of high-precision proper motions of globular clusters. Many scientific applications will benefit from this project. Once our analysis has been completed, we will make our proper-motion catalogs available to the astronomical community, with photometry in the available filters. Moreover, we will produce stacked images of the fields with accurate WCS headers, so that users can easily cross-identify stars in our catalogs with other surveys.
Acknowledgements.
A.B., R.P.vdM, and J.A. acknowledge support from STScI grants GO-11988, GO-12274, GO 12656, and GO-12845.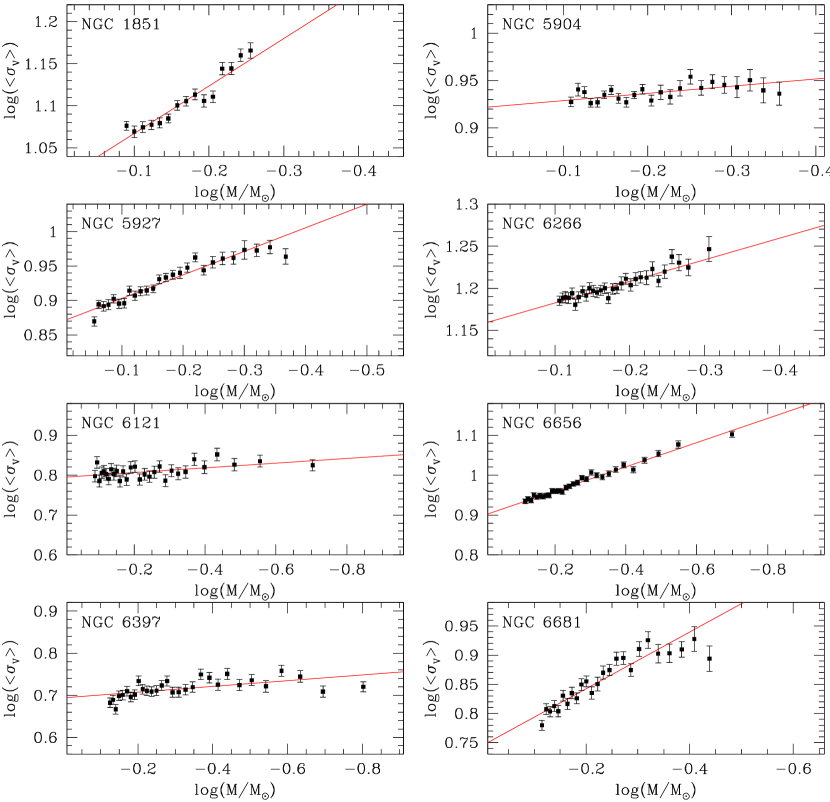
References
- (1) Anderson, J., & King, I. R. 2006a, ACS/ISR 2004-15 (Baltimore: STScI)
- (2) Anderson, J., & King, I. R. 2006b, ACS/ISR 2006-01 (Baltimore: STScI)
- (3) Anderson, J., & Bedin, L. R. 2010, PASP. 122. 1035
- (4) Bellini, A., & Bedin, L. R. 2009, PASP, 121, 1419
- (5) Bellini, A., Anderson, J., & Bedin, L. R. 2011, PASP, 123, 622
- (6) Sarajedini, A., Bedin, L. R., Chaboyer, B., et al. 2007, AJ, 133, 1658
- (7) van der Marel, R. P., & Anderson, J. 2010, ApJ, 710, 1063