How Significant is Radiation Pressure in the Dynamics of the Gas Around Young Stellar Clusters?
Abstract
The impact of radiation pressure on the dynamics of the gas in the vicinity of young stellar clusters is thoroughly discussed. The radiation over the thermal/ram pressure ratio time evolution is calculated explicitely and the crucial role of the cluster mechanical power and of the strong time evolution of the ionizing photon flux and of the bolometric luminosity of the exciting cluster is stressed. It is shown that radiation has only a narrow window of opportunity to dominate the wind-driven shell dynamics. This may occur only at early stages of the bubble evolution and if the shell expands into a dusty and/or a very dense proto-cluster medium. The impact of radiation pressure on the wind-driven shell becomes always negligible after about 3 Myr. Finally, the wind-driven model results allow one to compare the model predictions with the distribution of thermal pressure derived from X-ray observations. The shape of the thermal pressure profile allows then to distinguish between the energy and the momentum dominated regimes of expansion and thus conclude whether radiative losses of energy or the leakage of hot gas from the bubble interior have been significant during the bubble evolution.
1 Introduction
Several driving mechanisms have been proposed to explain the origin and evolution of large expanding structures discovered in deep Halpha images and HI surveys of the Milky Way and other local group galaxies. The most thoroughly discussed model involves the thermalization of the kinetic energy released by stellar winds and supernovae explosions inside a compact star cluster (McCray & Kafatos, 1987; Mac Low & McCray, 1988). While this model is broadly consistent with observations of many bubbles in the visible and X-ray emission, several others driving forces, such as radiation pressure from the field stars (Elmegreen & Chiang, 1982) or the encounter of a high velocity cloud with the galactic disk (Tenorio-Tagle, 1981), were also discussed in the literature (see for a review Tenorio-Tagle & Bodenheimer, 1988). The impact of radiation pressure on the dynamics of giant HII regions has been discussed recently by several authors who claimed that radiation pressure may play a crucial role in shaping the interstellar medium (ISM) around young massive clusters. For example, Lopez et al. (2011) compared the thermal pressure in the X-ray emitting plasma with the flux of radiation energy in the 30 Dor region and claimed that the hot gas pressure is generally weak and not dynamically important. Yeh & Matzner (2012) reached the same conclusion by making use the ionization parameter technique and claimed that in many individual and averaged over the galactic scale targets the shocked wind pressure cannot be large compared to radiation pressure. However Pellegrini et al. (2011) measured the ionization parameter across the 30 Dor region and concluded that radiation pressure does not currently play a major role in star forming regions such as 30 Dor, although it may have been an important factor during the early evolution. The revision of the classical model is thus required for better understanding of such controversial results.
The development of HII regions begins right from the formation of the stellar cluster, when the ample supply of ionizing photons leads to a supersonic weak R ionization front (Kahn, 1954; Tenorio-Tagle, 1976), supersonic with respect to the neutral gas ahead and also supersonic with respect to the ionized gas behind it. The ionization front rushes then through the surrounding gas leaving it warm ( 104 K) and ionized but dynamically unperturbed. This situation prevails throughout the formation phase, until the ionization front reaches the Strömgreen radius. The ionization front becomes then of D type with a strong shock progressing ahead of it into the surrounding gas. From then onwards and through the whole of the expansion phase, only a small fraction (less than 1) of the ionizing photon flux will impinge on the ionization front and exert a pressure on the surrounding shell of swept up matter. For such a reason, in the classic HII region model one cannot use the full bolometric luminosity of the central cluster to estimate the strength of radiative pressure during the expansion of an HII region. Krumholz & Matzner (2009) assumed that radiation pressure causes the ionized gas to pile up into a thin outer shell and then concluded that while radiation pressure is generally not important for HII regions around a single or a handful of massive stars, it dominates the dynamics of giant HII regions driven by massive star clusters. Draine (2011) calculated the density distribution in dusty HII regions with radiation pressure in the isothermal static approximation and showed that radiation pressure indeed produces a density gradient. However, the deviation from the homogeneous distribution is moderately small unless the parameter , where is the number of ionizing photons in units of s-1 and is the mean density in the HII region, is large ( cm-3).
A more realistic and also very different situation arises if one considers also the mechanical power of the exciting cluster and the strong evolution that the ionizing photon flux, the bolometric and the mechanical luminosities suffer after the first supernova explosion. Soon after the cluster wind interacts with the ionized surrounding gas, a strong shock wave begins to form a secondary wind-driven shell with the surrounding swept up matter. As the situation evolves, the pressure in the inner shell becomes larger than that of the free wind and thus a second, reverse shock is established in order to equalize and maintain an even pressure between the shocked wind and the swept up ionized gas. The wind-driven shell sooner or latter cools down and begins to recombine, depending on the value of the background density. Such recombinations deplete photons from the outer HII region and cause the ionization front to supersonically recede towards the cluster to finally become trapped within the inner wind-driven shell. The contribution of the star cluster UV radiation to the expansion of the original HII region becomes then insignificant. From then onwards the wind-driven shock travels through a warm neutral or molecular gas whose sound speed is much smaller than that in the ionized interstellar medium. This permits the wind-driven bubble to survive for a much longer time and leads to the regime which Capriotti & Kozminski (2001) named the “best case for wind” model. Capriotti & Kozminski (2001) concluded that in this case the dynamical evolution of the nebula is dictated by the stellar wind, but noted that the “best case for wind” scenario requires the product , where is the luminosity of the ionizing source in the Lyman continuum and is the density of the ambient medium, to be large. In the case of a single massive star, this requires a very high density ambient medium as the bolometric luminosities are rather small even in the case of the most massive O-stars. Arthur (2012) took into consideration the effects of mass loading and thermal conduction and developed a detailed numerical model for the stellar wind bubble around Ori C, the main exiting star of the Orion nebula. The calculations confirmed the “best case for wind” scenario and demonstrated that radiative heating makes the ionized part of the wind-driven shell thick. However, neither the ionizing source time evolution nor the radiation pressure effects have been taken into consideration in these calculations.
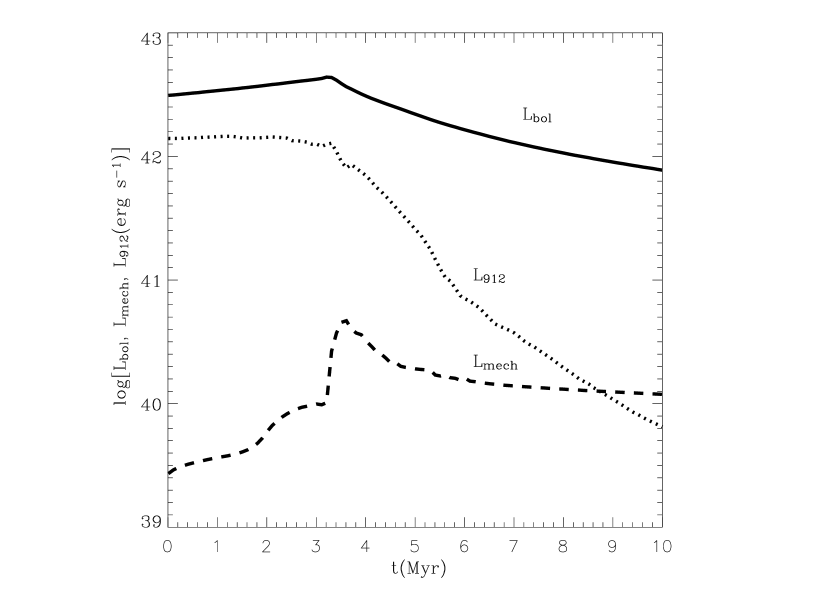
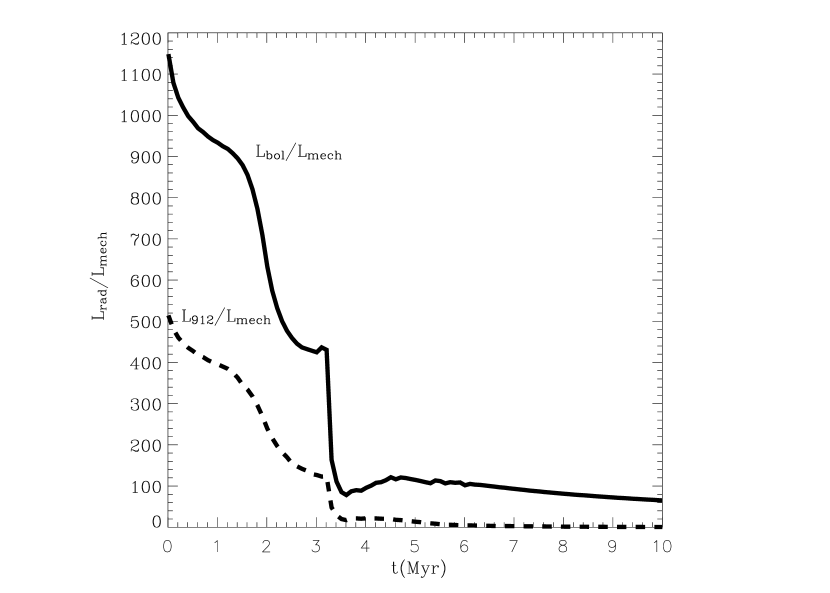
Here we consider the impact that radiation pressure provides on bubbles inflated by winds driven by massive star clusters. In such a case, the ionizing () and the bolometric luminosity of a typical coeval cluster fall down rapidly after the first supernova explosion, whereas the mechanical luminosity of the cluster is maintained at a nearly constant level. One can notice this in Figure 1 which presents the results from the Starburst99 synthetic model (Leitherer et al., 1999) for a coeval stellar cluster with stellar metallicity and standard Kroupa initial mass function. We also display on the right-hand panel of this figure the over and the over ratios as these quantities are central to our further discussion and lead us to conclude that radiation pressure has a poor impact on the expansion of the wind-driven shell and thus on the global dynamics of giant HII regions.
The paper is organized as follows: the inner structure, the impact from radiative cooling and the time evolution of star cluster driven bubbles in the two possible (energy-dominated and momentum-dominated) hydrodynamic regimes are discussed in section 2. The impact of radiation pressure on the wind-driven shell is thoroughly discussed in section 3, where we calculate the radiation over the dynamical pressure ratio and discuss how this ratio evolves with time. Section 4 presents the distribution of thermal pressure obtained from the wind-driven model and derives its appearance when projected onto the plane of the sky. We also show in this section that the shape of the projected thermal pressure profile allows one to distinguish between bubbles evolving in the energy and in the momentum-dominated regimes. Our results are compared with observations and other theoretical models in section 5 and a summary of our major conclusions is given in section 6.
2 The inner structure and evolution of star cluster driven bubbles
The thermalization of the kinetic energy supplied by stellar winds and supernovae explosions within the exciting cluster leads to a large central pressure that causes the exit of the reinserted matter as a star cluster wind (Chevalier & Clegg, 1985; Cantó et al., 2000; Tenorio-Tagle et al., 2007; Silich et al., 2011). Several physically distinct regions are then formed in the recently ionized gas (Weaver et al., 1977). The innermost (free wind) zone is occupied by the high temperature reinserted plasma whose density, temperature and pressure asymptotically fall as , and while the wind velocity monotonically increases to reach its terminal value, , where is the sound speed at the star cluster center (e.g. Cantó et al., 2000; Silich et al., 2011). The encounter of such high velocity outflow with the ambient, uniform density ionized medium, leads to the formation of the leading and reverse shocks. The leading shock sweeps up the ionized gas and compresses it into a secondary inner dense shell. The reverse shock decelerates and re-heats the free wind matter what results in a high thermal pressure in the shocked wind region. The thermal pressure in this zone is almost homogeneous as the temperature and the sound speed in the shocked wind plasma are large (Weaver et al., 1977). Note that both, the free wind and the shocked wind regions are bright in the X-ray regime (e.g. Chu et al., 1995; Cantó et al., 2000; Stevens & Hartwell, 2003; Silich et al., 2005) due to the large temperature in these zones (K - K). Thus the interior of the secondary, wind-driven shell is usually transparent to the ionizing radiation from the central cluster.
2.1 Energy dominated wind-driven bubbles
The theory of interstellar wind-driven bubbles with a constant energy input rate was developed by Weaver et al. (1977), Mac Low & McCray (1988), Koo & McKee (1992) (see for a review Bisnovatyi-Kogan & Silich, 1995). In this case the radius, , the expansion velocity of the wind-driven shell, , and the thermal pressure inside the bubble volume, , are:
| (1) | |||
| (2) | |||
| (3) |
where is the dynamical time, is the ambient gas density and is the mechanical luminosity of the central cluster. One can find the location of the reverse shock from the relation , where is the free wind ram pressure and the density in the wind, , is calculated at the reverse shock position: (e.g. Weaver et al., 1977):
| (4) |
The wind-driven shell of swept up interstellar matter is initially adiabatic and hot and thus transparent to the ionizing radiation. However, it cools down in a short time scale (Mac Low & McCray, 1988):
| (5) |
where and are the atomic number density and metallicity in the surrounding medium, is the star cluster mechanical luminosity in units of erg s-1 and . As soon as the wind-driven shell cools down, it recombines and begins to absorb ionizing photons emerging from the central cluster. This reduces the number of Lyman continuum photons in the outer HII region. From then onwards, the ionization front detaches from the outer shell and moves back towards the wind-driven shell reaching it when this grows thick enough as to absorb all ionizing photons from the central cluster. One can obtain the characteristic trapping time, , from the condition (Comeron, 1997):
| (6) |
where is the number of Lyman continuum photons, cm3 s-1 is the recombination coefficient to all but the ground level. We assume that thermal pressure in the ionized shell is uniform and equal to that in the shocked wind region (see Arthur, 2012). The density of the ionized shell then is , where is the mean mass per ion, is the isothermal speed of sound in the ionized gas and is the mean mass per particle in the completely ionized plasma with one helium atom per every ten hydrogen atoms. The shell thickness, , is calculated from mass conservation:
| (7) |
Equations (1), (2), (6) and (7) then yield:
| (8) |
During the forthcoming evolution the HII region is bounded by the wind-driven shell. The leading shock then remains strong even when the shell velocity drops below as the leading shock Mach number must be calculated with respect to the sound speed in the neutral ambient medium. Note, that the ionizing radiation may be trapped within the shell at much earlier times if the shell is dusty (see Murray et al., 2011).
Similarly, one can find the relative thickness of the ionized shell before and after the trapping time . For the shell is completely photoionized and the value of is restricted by the swept up mass while for the shell is partially ionized and the thickness of the ionized layer depends on the number of incident ionizing photons :
| (9) | |||
| (10) |
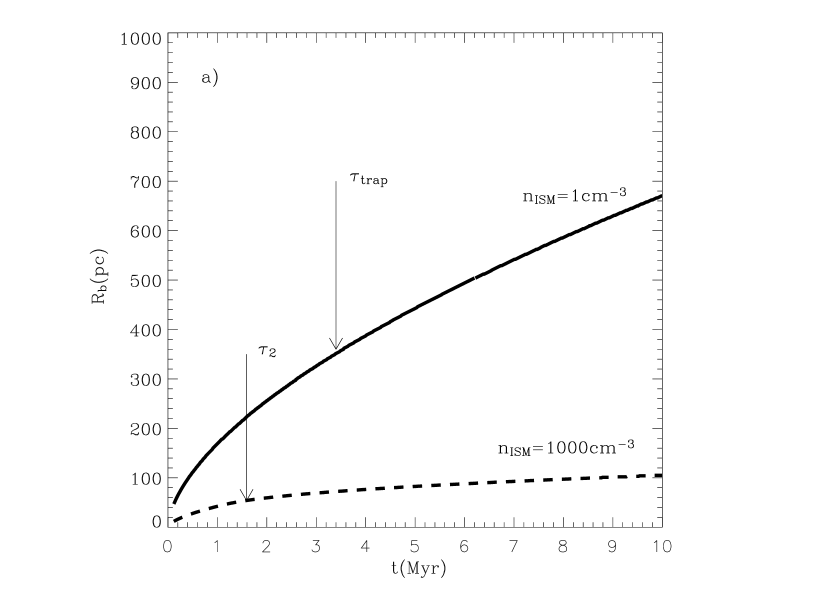
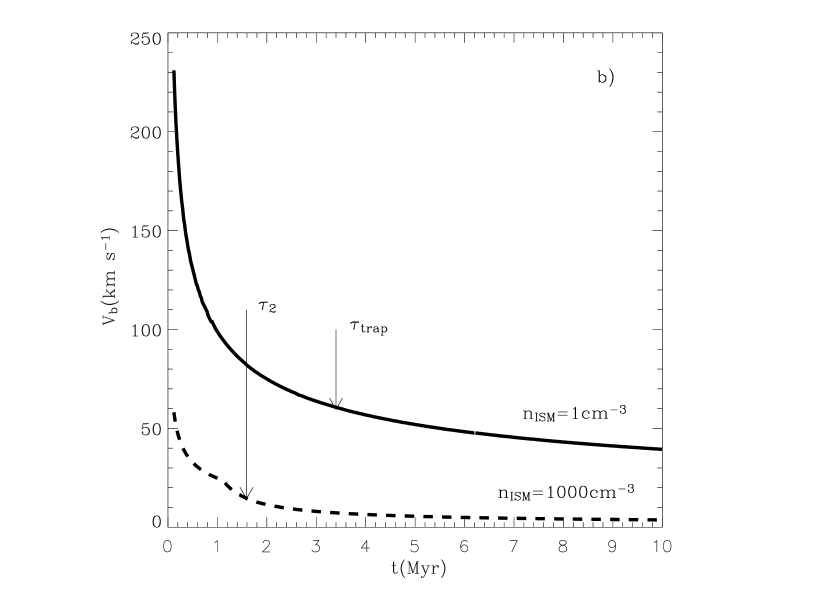
Figure 2 shows the wind-driven shell evolution onto an ambient medium with densities cm-3 and cm-3 (solid and dashed lines, respectively). The selected mechanical luminosity of the driving cluster is erg s-1 in both cases, which is the average value for a young cluster with a standard Kroupa initial mass function and 0.4Z⊙ metallicity (Leitherer et al., 1999) whereas the number of ionizing photons changes with time as is predicted by the evolutionary synthetic models (see Figure 1). It will be shown below that this approximation does not affect our major results significantly because the radiative over dynamical pressure ratio depends mainly on the bolometric over mechanical luminosity ratio and only weakly on the star cluster mechanical luminosity itself (see section 3). In the lower density case the wind-driven shell cools after yr and grows thick enough to absorb all ionizing photons ( s-1) at about Myr (see Figure 2). At that time the radius of the shell reaches about 360 pc and its expansion velocity has dropped to about 60 km s-1. Also, the number of Lyman continuum photons emerging from the central cluster begins to decrease due to the explosion of the most massive stars (see Figure 1).
2.2 Momentum dominated wind-driven bubbles
It is likely that young stellar clusters are embedded initially into dense parental clouds. Therefore Figure 2 also presents the wind-driven bubble evolution into a dense ambient medium with cm-3 (dashed lines). In this case the shell absorbs all ionizing photons as soon as it grows enough to encompass all the cluster. Thus, in the high density environment the shell cools down and traps the ionizing radiation from the driving cluster very rapidly, much faster than when it expands into a typical ISM with cm-3. Besides this, in the denser environment the shocked wind region may lose a significant fraction of the deposited energy in a short time scale due to strong radiative cooling in the conduction zone dominated by mass evaporated from the wind-driven shell (Mac Low & McCray, 1988):
| (11) |
In the case under consideration this occurs at Myr, when the shell radius reaches about 60 pc and the expansion velocity is km s-1. Without a pressure support, the reverse shock moves rapidly towards the shell and the further expansion is then due to the direct impact of the free wind momentum. This may also be the case if a collisionless reverse shock at is not formed (see the discussion of the reverse shock conditions in Capriotti & Kozminski, 2001). One can neglect this transition phase and compute the shell dynamics in the momentum dominated regime by writing down the momentum equation, assuming that the transition to the momentum dominated regime occurs at :
| (12) |
where is the mass of the shell at time and is the rate of mass deposition due to the wind.
The integration of equation (12) yields:
| (13) | |||
| (14) | |||
| (15) |
where is the radius of the shell at the time when the transition to the momentum dominated regime occurs: and is calculated by means of equation (1). Note, that if and , equation (13) is reduced to a well known relation (e.g. equation 3.1 in Koo & McKee, 1992).
Note that in the momentum-dominated regime the value of the thermal pressure in the wind-driven shell is equal to the wind ram pressure at the shell inner edge. The relative thickness of the ionized layer then is:
| (16) |
If thermal conduction and mass evaporation from the cold shell are inhibited by magnetic fields (Spitzer, 1962), the radiative losses of energy from the shocked wind region are much smaller. In this case the ion number density and temperature in the shocked wind region are:
| (17) | |||
| (18) |
Thus temperature in the shocked wind region in this case depends only on the wind terminal speed and does not change with time. If km s-1, K.
Radiative cooling begins to reduce the thermal pressure in the shocked wind zone and affect the bubble dynamics only when radiative losses of energy from the bubble interior exceed the energy input rate from the central cluster: . This occurs if the evolutionary time grows larger than
| (19) |
where is the gas metallicity in the shocked wind region and is the cooling function. One can obtain from equation (19) that is much longer than the characteristic life-time of giant HII regions ( Myr). This implies that the radiative losses of energy from the shocked wind region in this case are insignificant and the wind-driven bubble expands in the energy dominated regime during the whole evolution of the HII region.
The reverse shock may also be closer to the wind-driven shell than one would expect from equation (4), if the hot, shocked wind plasma escapes from the bubble into the surrounding low density medium, as suggested in Lopez et al. (2011). In this case the expansion velocity of the wind-driven shell differs from that predicted by the energy dominated model (equations 1 - 3) and may be more similar to what the momentum dominated model predicts.
3 The impact of radiation pressure on the wind-driven shell
The radiation pressure on the wind-driven shell is:
| (20) |
where is the fraction of the bolometric luminosity absorbed within the shell, is the speed of light and is the radius of the shell. In the energy dominated regime equations (4) and (20) yield:
| (21) |
One can note from relation (21) that the small over ratio and the fact that is usually much smaller than , decrease significantly from what one would expect during the early bubble evolution when the bolometric luminosity of the driving cluster exceeds the mechanical energy input rate by a factor of (see Figure 1). Hereafter we assume in our calculations that km s-1.
The over ratio may be presented in a different form which shows explicitely how it evolves with time, if one makes use of equation (3) instead of equation (4):
| (22) |
Equation (22) shows that the ratio of the bolometric over mechanical luminosity is the major factor which decides which of the two driving forces, radiation or thermal pressure, dominates the shell dynamics and that the over ratio has only a weak dependence on the ambient gas density and on the star cluster mechanical luminosity.
The relation between and will be different if the shell expands in the momentum dominated regime. In this case, one has to compare the radiation and the free wind ram pressure at the inner edge of the shell:
| (23) |
Note, that relationship (23) is universal as it does not depend on the ambient gas density and the over ratio is a universal function of time for all clusters with a given initial mass function and metallicity.
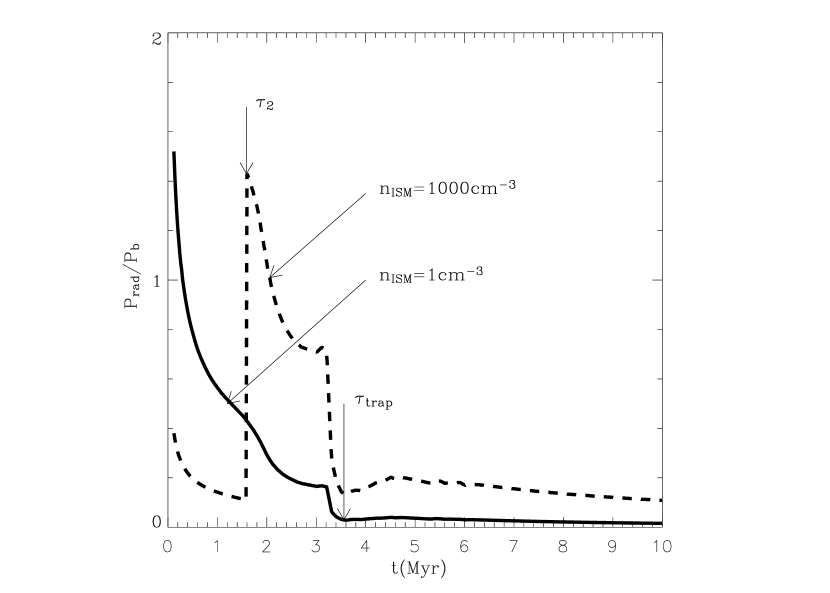
Figure 3 presents the over ratio time evolution for the two cases here considered. As mentioned above, it was assumed that the over changes with time as predicted by the evolutionary synthesis model Starburst99 but a constant value of the mechanical luminosity, erg s-1, was used in the calculations as depends on the value of itself only in the energy dominated regime and even then this dependence is weak (see equations 22 and 23). Numerical solutions with Starburst99-generated input mechanical luminosity were used by Dopita et al. (2005) in their discussion of the synthetic spectral energy distribution in starbursts.
Note that in Figure 3 is the thermal pressure in the shocked wind region in the energy dominated case and in the momentum dominated regime, respectively. In the low density case (solid line) the over ratio is larger than unity only at very early times ( yr) and only if the shell is dusty and optically thick to the bolometric luminosity of the central cluster (). Otherwise it should grow thick enough to absorb all ionizing photons only after Myr, when the contribution of radiation pressure to the shell dynamics is already negligible. The over ratio is small during the initial shell evolution if the driving cluster is embedded into a high density medium (see dashed line in Figure 3 and equation 22). It then suddenly grows to a value of 1.4 (see equation 23) as the gas in the bubble interior cools down, the reverse shock reaches the shell and the further bubble evolution proceeds in the momentum dominated regime. However, even in this case the over ratio becomes smaller than one after Myrs and thus radiation has only a narrow window of opportunity to dominate the shell dynamics. Note also that the true value of is set by the SED of the incident spectrum and by the optical depth of the shell and may be smaller than unity. In this respect Figure 3 presents an upper limit for the over ratio. For example, if the shell is thick to the Lyman continuum only, the over ratio would be smaller than what is shown in Figure 3 within a factor of 2 - 4, depending on the star cluster age (compare the bolometric and the Lyman continuum luminosities in Figure 1). On the other hand, the adiabatic wind terminal speed also changes with time and may be different within a factor of 3 from the selected value (see Wünsch et al., 2011).
4 Thermal pressure as an indicator of the hydrodynamic regime
Here we calculate the distribution of thermal pressure inside a wind-driven bubble volume and compare it to its projection onto the plane of the sky as it is done in high resolution studies of X-ray emission (e.g. Lopez et al., 2011).
In order to calculate the distributions of physical quantities (density, temperature, thermal pressure, velocity) in the free wind region and localize the reverse shock position, we make use of Silich et al. (2011) star cluster wind driven model, which assumes that stars are exponentially distributed within the star cluster volume. The model input parameters are: the starburst mechanical luminosity, erg s-1, the characteristic scale length of the stellar density distribution, pc, the adiabatic wind terminal speed, km s-1, and the metallicity in the free wind region, which we set to be . The position of the reverse shock at different times was calculated by means of equation (4) which relates the thermal pressure in the shocked wind zone and the ram pressure in the free wind region. We then compute the density and the temperature in the shocked wind region by means of equations (17) and (18) and calculate the distribution of thermal pressure in the same way, as in Lopez et al. (2011). Specifically, we calculate the emission measure and the waited temperature of the hot X-ray plasma along lines of sight with different impact parameters by integrating the model predicted density and temperature distributions. The emission measure and the waited temperature then are:
| (24) | |||
| (25) |
where and are the distance and the path length along the line of sight, and are calculated at . One can obtain then the plasma density and the thermal pressure along lines of sight with an impact parameter from the relations:
| (26) |
Note, that the procedure takes into account that lines of sight cross the free wind region if the impact parameter is smaller than the reverse shock radius . We also take care to omit segments along lines of sight where the temperature drops below the X-ray cut-off temperature, K (see Figure 4).
In the momentum-dominated regime the shocked wind region collapses and the star cluster wind impacts directly on the shell. Strong radiative cooling reduces then the temperature immediately behind the reverse shock leaving the shocked wind matter photoionized and at K. Thus, in the momentum-dominated regime the contribution of the shocked wind gas to the X-ray emission is negligible.
The distributions of thermal pressure obtained from the wind-driven bubble model and those, obtained by integration along different lines of sight are compared in Figure 4 (upper and bottom panels, respectively). The middle panels present the temperature distributions, which one can obtain from the wind-driven bubble model. Panels on the left-hand and the right-hand sides compare profiles obtained in the low ( cm-3) and high ( cm-3) density cases. Solid and dashed lines show the distributions of thermal pressure and temperature at different evolutionary times: Myr and Myr, respectively.
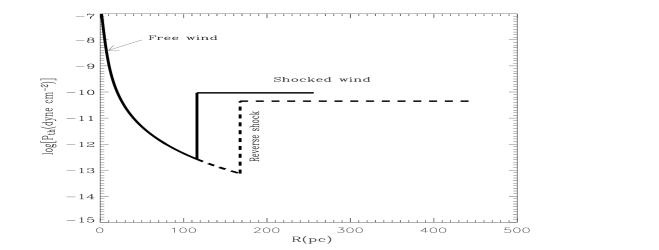
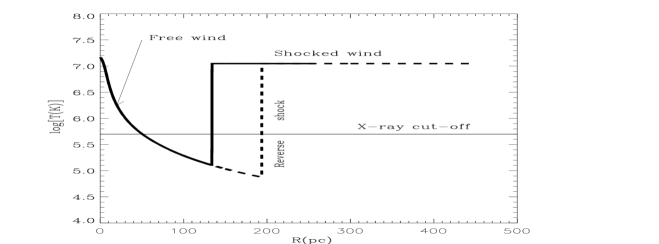
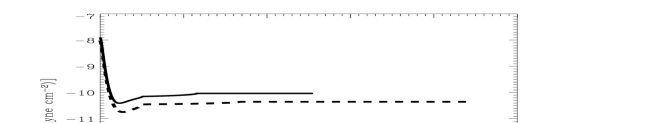
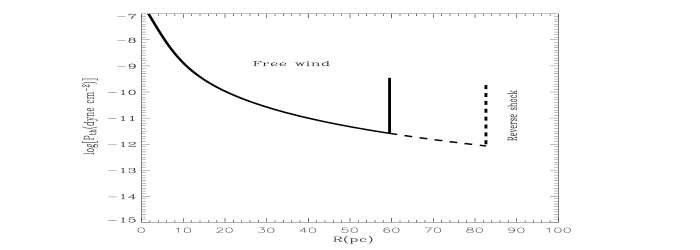
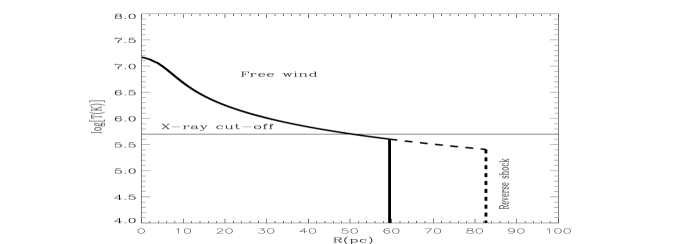

Figure 4 shows that the physical properties of the X-ray plasma derived from observations must be taken with care as the distribution of thermal pressure may be significantly distorted and the true central pressure significantly underestimated due to the inhomogeneous distribution of plasma inside the wind-driven bubble volume. For example, in the energy dominated regime the value of central pressure obtained by integration along lines of sight is within a factor of ten smaller than the actual value of the thermal pressure at the star cluster center. The integrated profile is significantly shallower and does not show a deep gap, which one can notice in the model predicted distribution of thermal pressure. The minimum in the integrated distribution of thermal pressure is shifted from the model predicted position towards the center and therefore it does not mark the position of the reverse shock (compare the top and the bottom panels in the left-hand column of Figure 4).
One can also note in Figure 4 that the shape of the integrated profiles is very different in the energy (low density) and momentum (high density) dominated cases. In the energy dominated regime the distribution of thermal pressure has a strong maximum in the center and a uniform plateau at larger radii. In the momentum dominated case the integrated profile is more similar to what the free wind model predicts (compare the top and the bottom panels in the right-hand side of Figure 4). In this case the major difference between the model and the integrated profiles occurs in the center, where the model predicted pressure is about ten times larger than that obtained by integration, as it also occurs in the energy-dominated case.
Thus, the shape of the thermal pressure profile allows one to distinguish between the two possible hydrodynamic regimes. The thermal pressure profile with a narrow central spike and a uniform plateau implies that the wind-driven bubble evolves in the energy dominated regime and that the reverse shock stands within the explored volume. A thermal pressure that drops continuously with distance from the star cluster center indicates that the shocked wind zone has collapsed due to strong radiative cooling and the wind-driven bubble evolves in the momentum dominated regime. The reverse shock accelerates then out from its energy-dominated position and finally the star cluster wind ends up impacting directly on the outer shell.
5 Comparison to other results
The impact from radiation pressure on the dynamics of giant HII regions has recently been discussed by Krumholz & Matzner (2009) who claimed that radiation pressure might dominate the dynamics of HII regions around massive star clusters, whereas we found that radiation has only a narrow window of opportunity to dominate the giant HII regions global dynamics.
The key difference between our results is that Krumholz & Matzner (2009) did not take into consideration the mechanical power of the exciting cluster and the time evolution of the star cluster bolometric luminosity. Thus, the radiation force in their and our models is compared with different pressures: with thermal pressure in the ionized gas behind the ionization front in the Krumholz & Matzner model and with thermal/ram pressure in the shocked/free wind zone in the wind-driven bubble model. Another significant difference is that we consider the time evolution of the exciting cluster explicitely that restricts the radiative feedback as the bolometric luminosity and the flux of ionizing radiation drop rapidly in massive coeval clusters with a normal IMF and ages larger than 3 Myrs.
The impact of radiative heating on the bubble dynamics has been discussed by Capriotti & Kozminski (2001) and Arthur (2012) who have considered bubbles driven by a single massive star. As it was stressed by Capriotti & Kozminski (2001), the real distinction between the ionizing radiation and the star cluster wind feedback to the ambient medium is that the characteristic lifetime of the star is much longer than the wind-blown bubble stalling time, the time when the bubble expansion velocity drops to the sound speed value in the ambient medium and the wind-induced shock dissipates. This is, however, not true in the case when bubbles are driven by massive star clusters as the characteristic stalling time increases with the mechanical luminosity of the driving cluster:
| (27) | |||
| (28) |
where and are stalling times in the energy and momentum-dominated regimes, respectively, is the sound speed in the ambient medium and we have used an asymptotic () relation for a momentum-dominated bubble expansion velocity (see equation 14). In the case of massive star clusters the characteristic trapping time is short compared with both, the wind-driven bubble stalling time, , and the characteristic lifetime of the HII region, Myr (e.g. in our models Myr and Myr if K). This implies that in this case wind-blown bubbles expand for a rather long time in the “best case for wind” regime, when the wind-driven shell traps all ionizing photons from the central source and the leading shock Mach number must be calculated with respect to a low sound speed in the neutral ambient medium.
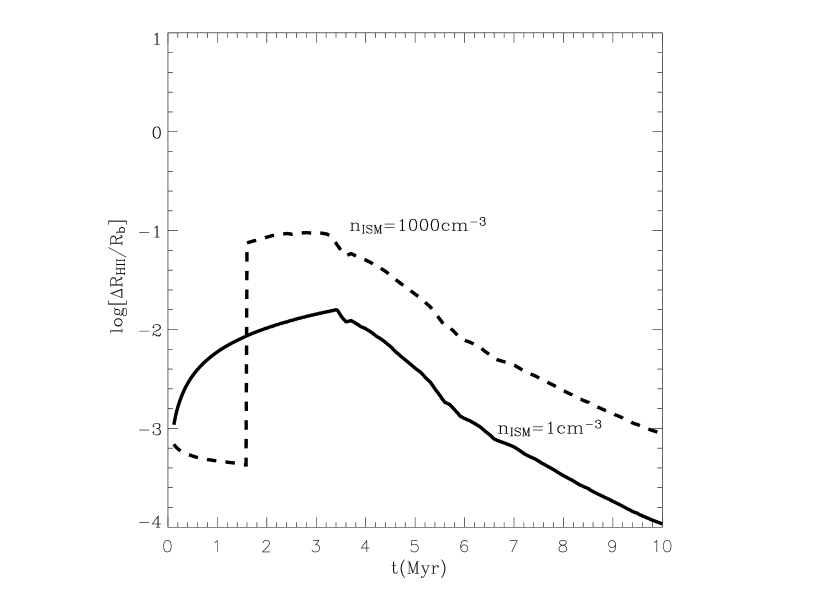
In the calculations by Arthur (2012) the ionized shell grows thick due to radiative heating what affects the wind-driven bubble dynamics because it reduces the volume occupied by the shocked wind gas and thus enhances the thermal pressure in the shocked wind zone and behind the leading shock front. This effect, however, strongly depends on the mechanical luminosity of the driving cluster because the thickness of the ionized shell is smaller in systems with a higher internal pressure (compare Figures 2 - 3 and 4 - 5 in Arthur, 2012). Figure 5 shows the relative thickness of the photoionized shell calculated by means of equations (9) - (10) and (16). As one can see, in the case of a coeval cluster, the thickness of the ionized shell does not exceed % of the wind-blown bubble radius what implies that in this case radiative heating does not affect significantly the bubble dynamics. Equations (9) - (10) and (16) predict that the ratio grows larger for low mass/energetic clusters. Thus, it is expected that the HII gas filling factor, , has to be larger in the HII regions developed by the less massive clusters as it is the case in the Carina nebula, where (Harper-Clark & Murray, 2009) and in the 30 Dor region, where the filling factor of the ionized gas is very small: (Mills et al., 1978). The effects of radiative heating must be also reduced if the wind-driven shells are dusty as the dust competes with the gas for ionizing photons what reduces the number of the incident photons heating the shell.
Harper-Clark & Murray (2009) discussed the dynamics and the X-ray emission from the Carina Nebula bubble and claimed that the leakage of the shocked wind gas through the holes in the expanding shell may solve a long time standing problem of the shell growth descipancy what implies that Weaver et al. (1977) model often overpredicts the sizes and expansion velocities of the wind-driven shells (see Oey, 1996). The leakage gas model, however, does not work in this case as the reverse shock radius calculated by means of equation (4) with the values of thermal pressure, Tr 16 cluster mechanical luminosity and mass-loss rate taken from Harper-Clark & Murray (2009): dynes cm-2, erg s-1 and yr-1 is comparable or even exceeds the observed size of the Carina bubble ( pc while the observed values of the Carina bubble radius range from 10 pc to 20 pc). The leakage bubble model then cannot be used in order to evaluate the X-ray luminosity and brightness profile from the Carina Nebula as it does not account for the free wind zone (it is assumed that ) and thus neglects the contribution of the free wind region to the X-ray emission. Note also that the apparent discrepancy between the Weaver et al. (1977) model predictions and the observed bubble radii and expansion velocities may be understood if bubbles evolve from flattened parental clouds and are observed face-on (see Silich & Franco, 1999).
The geometrical ionization parameter , where is the speed of light, reaches the maximum value in the momentum-dominated, high density model: . This value is smaller than the maximum value obtained by Yeh & Matzner (2012), , who used the Draine (2011) static model and assumed that the density and thus thermal pressure are zero at the inner edge of the strongly illuminated HII region (see Appendix B in the paper). This may be the case in a static, pressure confined HII regions (Draine, 2011), but is not valid in the case of the wind-driven shell where the thermal pressure at the inner edge of the shell must be equal to that in the shocked wind zone even if the density distribution in the ionized shell is not homogeneous due to strong radiation pressure.
A flat plateau and a steep central spike predicted by the energy-dominated wind-driven bubble model agree surprisingly well with the shape of the thermal pressure profile of 30 Dor region obtained by Lopez et al. (2011). This allows one to rule out the momentum dominated regime and conclude that the leakage of the hot gas from the 30 Dor shell is not a significant factor as suggested in Lopez et al. (2011). This conclusion also agrees with the detailed analysis of the X-ray emission from the 30 Dor region by Wang & Helfand (1991) and Townsley et al. (2006) who claimed that the diffuse X-ray emission is enveloped and probably confined by the cooler gas which outlines the classic picture of 30 Dor and extends for about 300 pc from north to south.
Radiation pressure is approximately equal to the gas pressure in the highly ionized ridge in the center of 30 Dor region. Outside of this central zone the ratio drops below 1/3 (Pellegrini et al., 2011) and the ionization parameter does not show much gradient (Indebetouw et al., 2009). The value is roughly consistent with the wind-driven model predictions (see Figure 3), if one bears in mind the complicated history of star formation in the 30 Dor starburst with three episodes of star formation of increasing intensity which took place approximately 5 Myr, 2.5 Myr and about 1.5 Myr ago (Selman et al., 1999). The radius of the central arc ( pc) is comparable to the size of NGC 2070, the major driving cluster in the 30 Dor starburst, what requires a more realistic than a spherical shell illuminated by a central source model as was also stressed by Snijders et al. (2007) when discussing the large values of the ionization parameter () detected in the HII regions around two young (ages less than 3 Myr) stellar clusters in the Antenna.
Our calculations thus favor the results by Pellegrini et al. (2011) who obtained a much lower radiation over thermal pressure ratio in the 30 Dor region than Lopez et al. (2011). Note also that Pellegrini et al. results look in better agreement with the spectroscopic virial mass of the 30 Dor cluster obtained by Bosch et al. (2009) ( ) which leads, in the case of a coeval cluster with a Kroupa IMF and metallicity, to the maximum value of bolometric luminosity erg s-1 what is about two times smaller than the obtained by Lopez et al. (2011).
6 Conclusions
Here we have explored the contribution of radiative and dynamical (thermal or ram) pressure to the dynamics of giant HII regions and found only a narrow window of opportunity for radiation pressure to be a dominant factor. We stress the importance of the mechanical feedback from the exciting cluster and the radiation power time evolution, and derive analytic relations which show how the radiation over dynamical pressure ratio evolves with time. Careful analysis of the two extreme models which cover conditions ranging from the interstellar medium in normal galaxies to those found in dense giant molecular clouds, led us to conclude that the dynamical pressure dominates always after about 3 Myr, if one uses the standard bubble and star cluster synthesis models. By that time the major factor which defines the relative contribution from the two driving forces, the bolometric over the mechanical luminosity ratio, drops within a factor of ten (see Figure 1) and the impact of radiation pressure becomes soon negligible even in the most preferable case. We want to stress that the reduction of thermal pressure in the shocked wind zone due to leakage of the hot shocked plasma out of a porous shell cannot change this conclusion as may only lead to the displacement of the reverse shock from the Weaver et al. (1977) model predicted position, but does not affect the distribution of the ram pressure in the free wind zone. In the extreme case this may lead to the momentum dominated expansion as it is the case if the shocked wind zone collapses due to strong radiative cooling or if the reverse shock is not formed due to the large proton mean free path in the shocked wind region (Capriotti & Kozminski, 2001). This leads to the maximum value of the over ratio which is shown in Figure 3 and occurs when the wind-driven bubble evolves in the momentum-dominated regime. However, even in this “best case for radiation” regime the contribution from radiation pressure becomes small after about 3 Myr (see dashed line in Figure 3). We thus conclude that radiation pressure, despite being significant during the earlier evolution, in general has a poor impact on the expansion of giant shells powered by massive star clusters unless the Starburst99 synthesis model overestimates the star cluster mechanical luminosity significantly or a significant fraction of the mechanical energy is lost inside the star cluster volume where the stellar mechanical energy is thermalized in random collisions of nearby stellar winds and supernovae ejecta.
References
- Arthur (2012) Arthur, S. J. 2012, MNRAS, 421, 1283
- Bisnovatyi-Kogan & Silich (1995) Bisnovatyi-Kogan, G. S. & Silich, S. A. 1995, Reviews of Modern Physics, 67, 661
- Bosch et al. (2009) Bosch, G., Terlevich, E., & Terlevich, R. 2009, AJ, 137, 3437
- Cantó et al. (2000) Cantó, J., Raga, A. C., & Rodríguez, L. F. 2000, ApJ, 536, 896
- Capriotti & Kozminski (2001) Capriotti, E. R. & Kozminski, J. F. 2001, PASP, 113, 677
- Chevalier & Clegg (1985) Chevalier, R. A. & Clegg, A. W. 1985, Nature, 317, 44
- Chu et al. (1995) Chu, Y.-H., Chang, H.-W., Su, Y.-L., & Mac Low, M.-M. 1995, ApJ, 450, 157
- Comeron (1997) Comeron, F. 1997, A&A, 326, 1195
- Dopita et al. (2005) Dopita, M. A., Groves, B. A., Fischera, J., et al. 2005, ApJ, 619, 755
- Draine (2011) Draine, B. T. 2011, ApJ, 732, 100
- Elmegreen & Chiang (1982) Elmegreen, B. G. & Chiang, W.-H. 1982, ApJ, 253, 666
- Harper-Clark & Murray (2009) Harper-Clark, E. & Murray, N. 2009, ApJ, 693, 1696
- Indebetouw et al. (2009) Indebetouw, R., de Messières, G. E., Madden, S., et al. 2009, ApJ, 694, 84
- Kahn (1954) Kahn, F. D. 1954, Bull. Astron. Inst. Netherlands, 12, 187
- Koo & McKee (1992) Koo, B.-C. & McKee, C. F. 1992, ApJ, 388, 93
- Krumholz & Matzner (2009) Krumholz, M. R. & Matzner, C. D. 2009, ApJ, 703, 1352
- Leitherer et al. (1999) Leitherer, C., Schaerer, D., Goldader, J. D., et al. 1999, ApJS, 123, 3
- Lopez et al. (2011) Lopez, L. A., Krumholz, M. R., Bolatto, A. D., Prochaska, J. X., & Ramirez-Ruiz, E. 2011, ApJ, 731, 91
- Mac Low & McCray (1988) Mac Low, M.-M. & McCray, R. 1988, ApJ, 324, 776
- McCray & Kafatos (1987) McCray, R. & Kafatos, M. 1987, ApJ, 317, 190
- Mills et al. (1978) Mills, B. Y., Turtle, A. J., & Watkinson, A. 1978, MNRAS, 185, 263
- Murray et al. (2011) Murray, N., Ménard, B., & Thompson, T. A. 2011, ApJ, 735, 66
- Oey (1996) Oey, M. S. 1996, ApJ, 467, 666
- Pellegrini et al. (2011) Pellegrini, E. W., Baldwin, J. A., & Ferland, G. J. 2011, ApJ, 738, 34
- Selman et al. (1999) Selman, F., Melnick, J., Bosch, G., & Terlevich, R. 1999, A&A, 347, 532
- Silich et al. (2011) Silich, S., Bisnovatyi-Kogan, G., Tenorio-Tagle, G., & Martínez-González, S. 2011, ApJ, 743, 120
- Silich & Franco (1999) Silich, S. & Franco, J. 1999, ApJ, 522, 863
- Silich et al. (2005) Silich, S., Tenorio-Tagle, G., & Añorve-Zeferino, G. A. 2005, ApJ, 635, 1116
- Snijders et al. (2007) Snijders, L., Kewley, L. J., & van der Werf, P. P. 2007, ApJ, 669, 269
- Spitzer (1962) Spitzer, L. 1962, Physics of Fully Ionized Gases
- Stevens & Hartwell (2003) Stevens, I. R. & Hartwell, J. M. 2003, MNRAS, 339, 280
- Tenorio-Tagle (1976) Tenorio-Tagle, G. 1976, A&A, 53, 411
- Tenorio-Tagle (1981) Tenorio-Tagle, G. 1981, A&A, 94, 338
- Tenorio-Tagle & Bodenheimer (1988) Tenorio-Tagle, G. & Bodenheimer, P. 1988, ARA & A, 26, 145
- Tenorio-Tagle et al. (2007) Tenorio-Tagle, G., Wünsch, R., Silich, S., & Palouš, J. 2007, ApJ, 658, 1196
- Townsley et al. (2006) Townsley, L. K., Broos, P. S., Feigelson, E. D., et al. 2006, AJ, 131, 2140
- Wang & Helfand (1991) Wang, Q. & Helfand, D. J. 1991, ApJ, 370, 541
- Weaver et al. (1977) Weaver, R., McCray, R., Castor, J., Shapiro, P., & Moore, R. 1977, ApJ, 218, 377
- Wünsch et al. (2011) Wünsch, R., Silich, S., Palous, J., Tenorio-Tagle, G., & Munoz-Tunon, C. 2011, ApJ, 740, 75
- Yeh & Matzner (2012) Yeh, S. C. C. & Matzner, C. D. 2012, ApJ, 757, 108