PSR J18401419: A very cool neutron star
Abstract
We present upper limits on the X-ray emission for three neutron stars. For PSR J18401419, with a characteristic age of 16.5 Myr, we calculate a blackbody temperature upper limit (at 99% confidence) of eV, making this one of the coolest neutron stars known. PSRs J18141744 and J18470130 are both high magnetic field pulsars, with inferred surface dipole magnetic field strengths of and G, respectively. Our temperature upper limits for these stars are eV and eV, showing that these high magnetic field pulsars are not significantly hotter than those with lower magnetic fields. Finally, we put these limits into context by summarizing all temperature measurements and limits for rotation-driven neutron stars.
Subject headings:
pulsar: general — stars: magnetic fields — X-rays: stars1. Introduction
Measurements of the temperatures of neutron stars (NSs) are few and far between. They are often impossible as, for ages Myr, the star will have experienced significant cooling since its formation (Yakovlev & Pethick, 2004). The thermal emission from NSs peaks in soft X-rays, below keV, and the luminosities are such that sources even a few kiloparsecs away are difficult to detect. Currently, a total of 37 measurements, and 9 upper-limit measurements, of rotation-driven NS temperatures have been published (Li et al., 2005; Caraveo et al., 2010; Abdo, 2010; Speagle et al., 2011; Chang et al., 2011; Zhu et al., 2011; Marelli et al., 2011; Guver et al., 2012; Pires et al., 2012). Of these, only 11 are for NSs with characteristic ages older than Myr (excluding 5 millisecond pulsars for whom we have no meaningful estimate of age), and only three of those greater than Myr: PSRs B095008, J21443933 and J01081431. The emission from PSR B095008, a Myr pulsar, is non-thermal, with a power-law spectrum, and an upper limit of eV, or MK, on the thermal contribution (Becker et al., 2004). To put this in context, it is at the level of the lowest measured temperature for any NS: eV for Geminga (De Luca et al., 2005). PSR J21443933 is the slowest spinning pulsar known ( s) and an order of magnitude older ( Myr) than PSR B095008 so that it is perhaps not surprising that no X-ray emission has been seen from it, with an upper limit of eV (Tiengo et al., 2011). Posselt et al. (2012) have recently reported the detection of PSR J01081431 ( Myr) with eV, a source which seems to be undergoing a heating process.
In a recent re-analysis of the Parkes Multi-beam Pulsar Survey, PSR J18401419 was discovered (Keane et al., 2010). This -s pulsar shows sporadic radio emission with strong single pulses detected, on average, every rotation periods, at flux densities up to Jy. At Myr, PSR J18401419 has a very similar characteristic age to PSR B095008, and therefore might be expected to have somewhat similar X-ray properties. This, plus its relative proximity at pc, make PSR J18401419 an excellent target for adding to our knowledge of the X-ray emission and temperature of old NSs. In this paper we present the result of a Chandra observation of PSR J18401419.
One factor which has been suggested to be a major factor in NS cooling is the magnetic field strength. Several authors have suggested that NSs with higher magnetic field strengths are hotter than those with lower field strengths, for the same age (Gonzalez et al., 2007; Zhu et al., 2009; Olausen et al., 2010; Zhu et al., 2011). Such an effect is theoretically predicted (Yakovlev & Pethick, 2004) and the work of Geppert et al. (2004) and Pérez-Azorín et al. (2006) shows that high magnetic fields supress heat conductivity perpendicular to the field lines, naturally producing an anisotropic temperature distribution on the stellar surface with small hot regions at the magnetic poles. We examine this claim with XMM-Newton observations of two pulsars: J18141744 and J18470130, both of which have high magnetic field strengths, of and G, respectively.
Finally, we present an updated plot of vs characteristic age for all X-ray measurements of, and upper limits on, rotation-powered NS temperature made thus far, and re-examine the temperature-magnetic field strength relationship.
2. Observations & Results
2.1. Calculating Limits
For a non-detection, one could determine a count rate limit by following the procedure of Pivovaroff et al. (2000): (i) define an aperture on the image about the position of the source, and add up the counts in this region, ; (ii) define a background region of the same area (or appropriately scale to the same area) elsewhere on the image and add up the counts in the background region, . The signal from the source is and the noise is . The signal-to-noise ratio is then . To set a ‘ limit’ count rate we can then solve for in , where is known. We can see that in the ‘photon-rich’ case this tends to the expected Poisson value in the absence of background sky noise. However, in the ‘photon-poor’ case we clearly can not use this expression, e.g. for , naïvely suggests a 99.7% detection/limit, however we know that the Poisson probability for counts due to noise is ; for such a background rate counts represents a 99.8% limit. The observations presented here are in the photon-poor scenario, so that using the Pivovaroff et al. (2000) procedure would result in a much poorer limit than what has truly been obtained.
To convert count rate limits to flux limits we need either some kind of absolute scale, e.g. from observing a standard source of known flux, or a model for our source, e.g. an assumed spectral form (McLaughlin et al., 2003). Below we calculate one set of limits for a blackbody model (whence we obtain temperature limits as a function of the emitting radius), and another set of limits for a non-thermal model with a power law with negative index of .
2.2. PSR J18401419
PSR J18401419 is an old pulsar ( Myr) with a -s spin period. Due to its sporadic radio emission it was detected in a search for single pulses, rather than in a periodicity search (Keane et al., 2010). Pulsars discovered in this way are often referred to as “RRATs” (Keane & McLaughlin, 2011). The properties of PSR J18401419, both measured and derived, are given in Table 1.
On 2011-02-20, we performed a -ks observation of PSR J18401419, using the ACIS-S detector on Chandra in the energy range keV. We detected only one photon within the arcsec ( pixel) error circle of the position derived from pulsar timing (Keane et al., 2011). Assuming that this 1 count is consistent with background noise (the background rate being counts/pixel), and ignoring the Poisson nature of the source, the count rate limit is counts/s (at confidence).
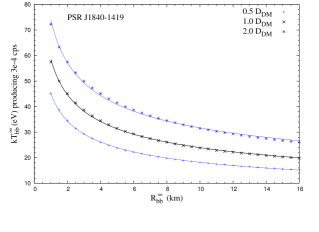
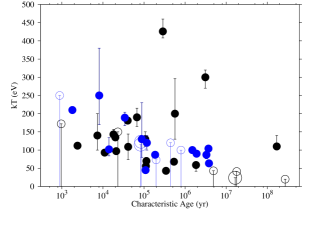
In the case of a blackbody model this count rate limit implies a temperature limit of , where the dependence on is a purely empirical fit to a simple power law of the form , where is the blackbody radius in units of km and is the temperature when : see top left panel of Figure 1. The error bars reflect both NE2001 ‘worst case’ errors of a factor of two in the distance (Cordes & Lazio, 2002) as well as factor of two uncertainties in the neutral hydrgoen column density (see below). The bottom right panel of Figure 1 shows all measured neutron star temperatures as a function of age. The PSR J18401419 limit is amongst the coolest of all published limits. The corresponding flux and luminosity limits are and , respectively. In the case of the non-thermal model (power law, with negative index of ), the flux and luminosity limits are and , respectively.
The above estimates use a neutral hydrogen column density of which is derived from the dispersion measure, assuming 10 neutral hydrogen atoms per free electron (Seon & Edelstein, 1998). Predicted count levels were calculated using the standard PIMMS (Portable, Interactive Multi-Mission Simulator) tool111http://asc.harvard.edu/toolkit/pimms.jsp.
2.3. PSRs J18141744 & J18470130
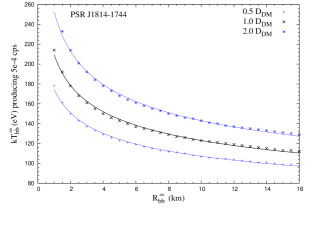
We also present the results of two XMM-Newton observations using the PN detector and medium filter in the energy range keV. PSR J18141744 was observed for ks on 2004-10-21, and PSR J18470130 was observed for ks on 2004-09-14. The observations of these young, high-B pulsars also resulted in non-detections. As above for PSR J18401419 we derive temperature upper limits for these sources of: , for PSR J18140130, and , for PSR J18470130 (see Figure 1). These limits are much less constraining given the much larger estimated distances ( and kpc respectively). The associated flux and luminosity limits for the blackbody scenario are: and for PSR J18141744; and and for PSR J18470130.
The non-thermal limits are: and for PSR J18141744; and: and for PSR J18470130. For PSR J18141744 the value of derived from the dispersion measure was higher than the maximum Galactic value for this line of sight, as calculated by the standard COLDEN tool222http://asc.harvard.edu/toolkit/colden.jsp, so the COLDEN value of was used. For this reason is unlikely to be underestimated, but we have allowed for the possibility that it may be overestimated by as much as a factor of two. Likewise, for PSR J18470130, the neutral hydrogen column density was derived to be . This value of is very close to the maximum value for this line of sight, so that it too is unlikely to be an overestimate.
3. Discussion & Conclusions
Although this paper reports three null results we deem it to be of the utmost importance to report such investigations to avoid duplicated efforts, wasted telescope resources, etc. Table 1 summarises the temperature, flux and luminosity limits for the sources reported here. From the non-thermal luminosity limits we can determine upper-limits on the non-thermal X-ray efficiency, , where is the spin-down energy loss rate. Although the luminosity limits for the XMM-Newton observations are orders of magnitude poorer than for the Chandra observation of J18401419, the values are correspondingly higher, such that for all 3 pulsars the limit turns out to be . Possenti et al. (2002) determined, for their study of 39 pulsars, that all sources had a value of less than . Our limits are all significantly higher than this predicted value. However, we note this critical value is arrived at upon considering pulsars studied in the keV energy range, narrower than the observations reported here.
These observations bring the total number of rotation-powered NSs with detections of thermal emission, or upper limits thereupon, to 49. In Figure 1 we show our limits, along with all previous measurements and limits. Zhu et al. (2011) suggest that there is a “hint” that the high magnetic field pulsars are hotter than the low magnetic field pulsars. To quantify this we first ignored the upper limits and divided the remaining data into ‘low’ and ‘high’ magnetic-field-strength sources, below and above an arbitrarily chosen field strength value of G. We also excluded three ‘low’ magnetic-field-strength sources as their fitted blackbody radii are so much smaller than those of the rest of the sources (at , and m) so that their thermal emission is thought to be due to some heating process (Misanovic et al., 2008). Comparing the two distributions with a Kolmogorov-Smirnov (K-S) test we find a K-S statistic of , and thus a probability of that these two distributions are the same. There is therefore no evidence that the high magnetic field pulsars are hotter than those with lower magnetic fields. However we note the caveat that, in addition to the age estimates being uncertain (as mentioned above), the magnetic field estimates are uncertain, and should only be considered accurate to within an order of magnitude. Knowledge of the inclination angles between the magnetic and rotation axes would be needed to estimate the magnetic field strengths more accurately (e.g. as in Spitkovsky (2006)).
Acknowledgments
This work has been supported by NASA CXO guest observer support grant GO1-12059X, and made use of software provided by the Chandra X-ray Center. EFK thanks the FSM for support, K. J. Lee for useful discussions on statistics, R. P. Eatough for useful comments on the manuscript and the anonymous referee for providing valuable input that improved the quality of this paper. MAM is supported by the Research Corporation for Scientific Advancement.
| Quantity | J18401419 | J18141744 | J18470130 |
|---|---|---|---|
| (s) | |||
| (fs/s) | 6.3 | 745 | 1270 |
| (kyr) | 16500 | 85 | 83 |
| ( G) | 6.5 | 55.1 | 93.6 |
| () | 1.0 | 468 | 167 |
| () | 19 | 792 | 667 |
| (kpc) | 0.9 | 9.8 | 7.7 |
| Telescope | Chandra | XMM | XMM |
| Instrument | ACIS-S | PN | PN |
| Date | 2011-02-20 | 2004-10-21 | 2004-09-14 |
| Energy Range (keV) | |||
| (ks) | 10.0 | 6.1 | 17.0 |
| () | 6 | 157 | 205 |
| (eV) | |||
| (MK) | |||
| () | |||
| () | |||
| () | |||
| () | |||
Note. — The measured and derived properties for the three pulsars discussed in this paper. The spin period, , and its derivative, , are derived from pulsar timing techniques, and , and , the characteristic age, magnetic field strength and spin-down energy respectively, are inferred from these (Keane et al., 2011). The distance, , is derived from the measured using the NE2001 model for the Galactic free electron distribution (Cordes & Lazio, 2002). The -confidence temperature limits are derived as outlined in the text. Non-thermal flux limits are given for a power law with negative index of . these limits are for an emitting radius of km, and scale as , where equals , and , respectively for the three sources (see main text). The blackbody flux and luminosity limits similarly scale as .

References
- Abdo (2010) Abdo A. A. e. a., 2010, ApJ, 712, 1209
- Becker et al. (2004) Becker W., Weisskopf M. C., Tennant A. F., Jessner A., Dyks J., Harding A. K., Zhang S. N., 2004, ApJ, 615, 908
- Caraveo et al. (2010) Caraveo P. A., De Luca A., Marelli M., Bignami G. F., Ray P. S., Saz Parkinson P. M., Kanbach G., 2010, ApJ, 725, L6
- Chang et al. (2011) Chang C., Pavlov G. G., Kargaltsev O., Shibanov Y. A., 2011, ApJ, in press
- Cordes & Lazio (2002) Cordes J. M., Lazio T. J. W., preprint (arXiv:astro-ph/0207156)
- De Luca et al. (2005) De Luca A., Caraveo P. A., Mereghetti S., Negroni M., Bignami G. F., 2005, ApJ, 623, 1051
- Geppert et al. (2004) Geppert U., Küker M., Page D., 2004, A&A, 426, 267
- Gonzalez et al. (2007) Gonzalez M. E., Kaspi V. M., Camilo F., Gaensler B. M., Pivovaroff M. J., 2007, Astrophys. Space Sci., 36
- Guver et al. (2012) Guver T., Gogus E., Ozel F., 2012, MNRAS, in press
- Keane et al. (2011) Keane E. F., Kramer M., Lyne A. G., Stappers B. W., McLaughlin M. A., 2011, MNRAS, 838
- Keane et al. (2010) Keane E. F., Ludovici D. A., Eatough R. P., Kramer M., Lyne A. G., McLaughlin M. A., Stappers B. W., 2010, MNRAS, 401, 1057
- Keane & McLaughlin (2011) Keane E. F., McLaughlin M. A., 2011, Bulletin of the Astronomical Society of India, 39, 333
- Li et al. (2005) Li X. H., Lu F. J., Li T. P., 2005, ApJ, 628, 931
- Marelli et al. (2011) Marelli M., De Luca A., Caraveo P. A., 2011, ApJ, 733, 82
- McLaughlin et al. (2003) McLaughlin M. A. et al., 2003, ApJ, 591, L135
- Misanovic et al. (2008) Misanovic Z., Pavlov G. G., Garmire G. P., 2008, ApJ, 685, 1129
- Olausen et al. (2010) Olausen S. A., Kaspi V. M., Lyne A. G., Kramer M., 2010, ApJ, 725, 985
- Pérez-Azorín et al. (2006) Pérez-Azorín J. F., Miralles J. A., Pons J. A., 2006, A&A, 451, 1009
- Pires et al. (2012) Pires A. M., Motch C., Turolla R., Schwope A., Pilia M., Treves A., Popov S. B., Janot-Pacheco E., 2012, A&A, submitted
- Pivovaroff et al. (2000) Pivovaroff M., Kaspi V. M., Camilo F., 2000, ApJ, 535, 379
- Posselt et al. (2012) Posselt B., Arumugasamy P., Pavlov G. G., Manchester R. N., Shannon R. M., Kargaltsev O., 2012, ApJ, in press
- Possenti et al. (2002) Possenti A., Cerutti R., Colpi M., Mereghetti S., 2002, A&A, 387, 993
- Seon & Edelstein (1998) Seon K.-I., Edelstein J., 1998, AJ, 115, 2097
- Speagle et al. (2011) Speagle J. S., Kaplan D. L., van Kerkwijk M. H., 2011, ApJ, 743, 183
- Spitkovsky (2006) Spitkovsky A., 2006, ApJ, 648, L51
- Tiengo et al. (2011) Tiengo A., Mignani R. P., de Luca A., Esposito P., Pellizzoni A., Mereghetti S., 2011, MNRAS, 412, L73
- Yakovlev & Pethick (2004) Yakovlev D. G., Pethick C. J., 2004, Ann. Rev. Astr. Ap., 42, 169
- Zhu et al. (2009) Zhu W., Kaspi V. M., Gonzalez M. E., Lyne A. G., 2009, ApJ, 704, 1321
- Zhu et al. (2011) Zhu W. W., Kaspi V. M., McLaughlin M. A., Pavlov G. G., Ng C.-Y., Manchester R. N., Gaensler B. M., Woods P. M., 2011, ApJ, 734, 44