]Received 30 April 2011
Development of the Magnetic Excitations of Charge-Stripe Ordered La2-xSrxNiO4 on Doping Towards Checkerboard Charge Order.
Abstract
The magnetic excitation spectrums of charge stripe ordered La2-xSrxNiO4 and were studied by inelastic neutron scattering. We found the magnetic excitation spectrum of from the ordered Ni2+ S = 1 spins to match that of checkerboard charge ordered La1.5Sr0.5NiO4. The distinctive asymmetry in the magnetic excitations above 40 meV was observed for both doping levels, but an additional ferromagnetic mode was observed in and not in the . We discuss the origin of crossover in the excitation spectrum between and with respect to discommensurations in the charge stripe structure.
pacs:
71.45.Lr, 75.30.Fv, 75.40.GbI Introduction
Recent understanding of how charge-striped ordered phases containing significant disorder can produce hourglass-shaped magnetic excitation spectrum add further support to the charge stripe picture of hole doped cupratesboothroyd-Nature ; Ulbrich . With evidence for a normal phase charge-stripe order around 1/8 doping in yttrium based cuprates also highlighting the potential ubquitous nature of stripes beyond La based cupratesYBCOstripes . These studies strongly motivate all efforts to improve our understanding of the charge-stripe ordered phase, to further our studies in non-superconducting charge-stripe ordered materials such as La2-xSrxNiO4 (LSNO).
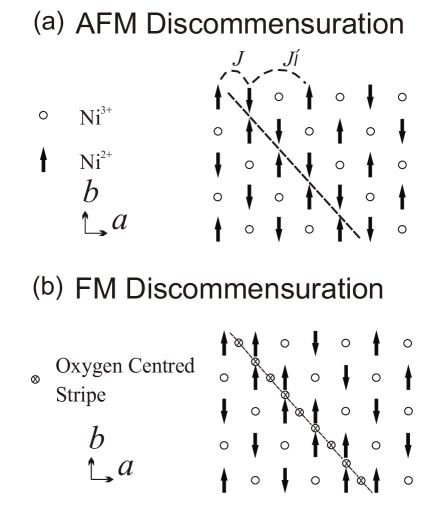
The magnetic excitation spectrum of charge-stripe ordered LSNO, has been studied in detail for several doping levels, and boothroyd-PRB-2003 ; bourges-PRL-2003 ; Woo ; freeman-PRB-2005 . Despite the success of modelling the excitation spectrums, significant differences in the role of discommensurations in the magnetic excitations of LSNO and are observedWoo ; freeman-PRB-2005 . Discommensurations are variations in the charge stripe spacing, caused by pinning of the charge stripes to either the Ni or O sites of the Ni-O planes of LSNO. For doping levels near discommensurations cause damping of the spatial extent of magnetic excitations. While the magnetic excitation spectrum can be understood as a checkerboard charge order state containing discommensurations that lead to a spin stripe order, where discommensurations cause the development of new gapped magnetic excitation modes. Figure 1 shows the two types of discommensurations that can exist in LSNO, that cause (a) antiferromagnetic, and (b) ferromagnetic excitations in the . The ferromagnetic or antiferromagnetic character of these modes is implied from the wavevector centre that they disperse away from with increasing energy transfer, being either a ferromagnetic or antiferromagnetic zone centres. We do however note that an alternative theory has been proposed to describe the antiferromagnetic excitation as due to stripe twiningYao-PRB-2007 . In this study we wish to address how discommensurations effect the magnetic excitation spectrum on doping towards , and determine the role, if any, of checkerboard charge order.
II Experiment Details and Results
Single crystals of La1.55Sr0.45NiO4 and La1.6Sr0.4NiO4 were grown using the floating-zone techniqueprab . The La1.55Sr0.45NiO4 crystal was a rod of 6 mm in diameter and 25 mm in length weighing 2.6 g, and the La1.6Sr0.4NiO4 crystal was a slab of dimensions mm and weighed 1.8 g . The samples used here are the same samples that were studied in our previous neutron diffraction measurements, which are reported elsewherepaul2 ; giblin-PRB-2008 . Oxygen content of the La1.6Sr0.4NiO4 was determined to be stoichiometric by thermogravimetric analysis,prab whereas the results of the neutron diffraction study of La1.55Sr0.45NiO4 are consistent with stoichiometric oxygen contentgiblin-PRB-2008 . The bulk magnetization of the is consistent with that of an slightly oxygen deficient freeman-JSNM-2011 , but studying the has the advantage of being well away from the half doped checkerboard charge ordered phase.
Neutron scattering were performed on the triple-axis spectrometers PUMA at FRM II, and IN8 at the Institut Laue-Langevin. The data was collected with a fixed final neutron wavevector of Å. A pyrolytic graphite (PG) filter was placed after the sample to suppress higher-order harmonic scattering. We measured the excitation spectrum of the La1.55Sr0.45NiO4 on PUMA, and the excitation spectrum of La1.6Sr0.4NiO4 was measured on IN8. On both instruments the neutrons final and initial energy was selected by Bragg reflection off a double focusing pyrolytic graphite (PG) monochromator and analyzer respectively. On PUMA the La1.55Sr0.45NiO4 sample was mounted inside a cold cycle refrigerator, and on IN8 the La1.6Sr0.4NiO4 sample was mounted inside an orange cryostat. Both samples were orientated so that (, , 0) positions in reciprocal space could be accessed. In this work we refer to the tetragonal unit cell of LSNO, with unit cell parameters Å, Å.
In the we observed for meV that the magnetic excitations of the acoustic magnon branch dispersed towards without a counter propagating modefreeman-PRB-2005 . In figure 2 we show the magnetic excitations from the ordered moments of LSNO and for meV. The magnetic zone centres for the and are , with and respectively. For the we see in Fig. 2 (a) excitations that disperse towards on increasing from 42.5 meV to 47.5 meV with no observable counter propogating mode, consistent with magnetic excitations of the . Similarly in Fig. 2(b) we observe magnetic excitations in the are shifted towards the from the magnetic zone centre at meV. It appears the magnetic excitations in LSNO lose their symmetry in the dynamic structure factor at a doping level between and , with this effect decoupled from checkerboard charge-ordering.
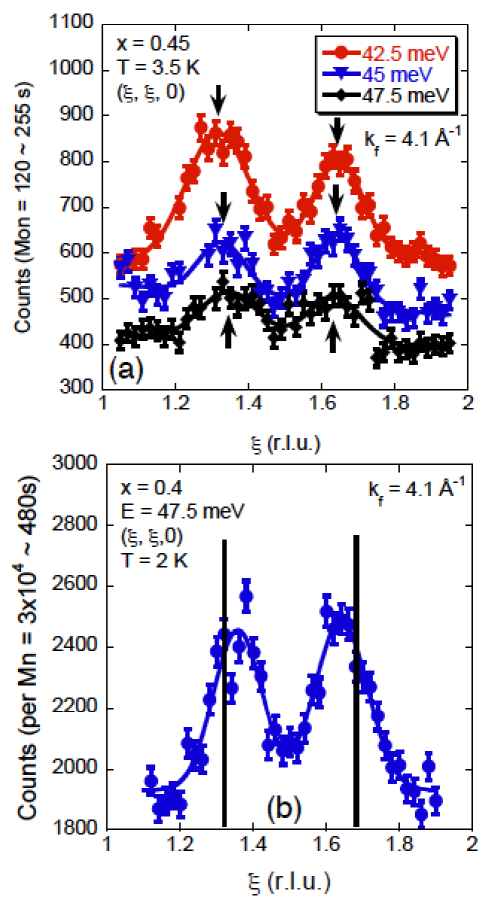
.
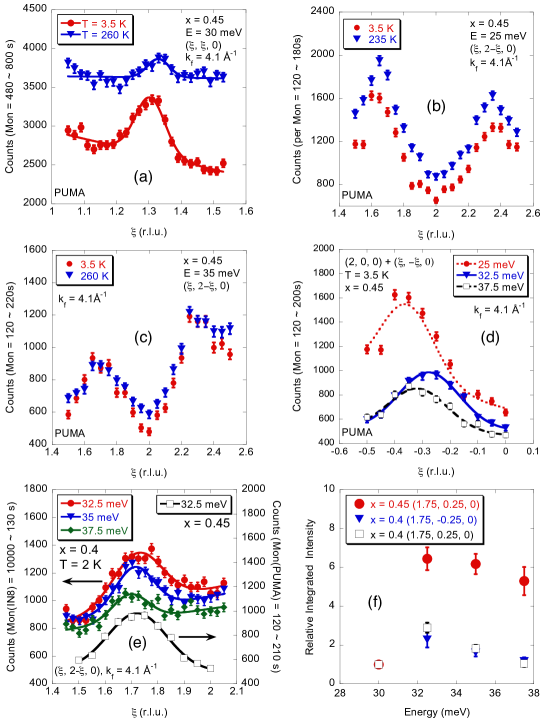
Having studied the magnetic excitations from the acoustic magnon branch we searched for evidence of additional magnetic excitation modes. In figure 3(a)-(d) we show constant energy scans over the energy range 25 meV to 37.5 meV in the . In this energy range in La2-xSrxNiO4 magnon, phonon mixing in measurements by inelastic neutron scattering is a problem. We first measured the excitations from the acoustic magnon dispersion at 30 meV at 3.5 K and 260 K, as we show in Fig.3(a). At this specific energy and wavevector we expect to observe no phonons in a constant energy scanboothroyd-PRB-2003 ; Woo ; freeman-PRB-2005 . Consistent with a magnetic excitation measured above and below the magnetic ordering temperature, we observe a reduction in intensity of the acoustic magnetic excitation on increasing temperature from 3.5 K to 260 K due to the Bose effect. In Fig.3(b) we show a constant energy scan at 25 meV parallel to that passes through at 3.5 K and 235 K. At 25 meV the background increases with increasing temperature and the observed excitations appear to be temperature independent. This scan passes over the wavevector of the acoustic magnon mode, at 235 K the acoustic magnon will lose the same intensity as in Fig .3 (a) in the scan of Fig.3(b). Therefore to account for the apparent temperature independence of the scan in Fig.3(b) an additional excitation must exist at the same wavevector. This excitation gains in intensity with increasing temperature; this temperature dependence implies it should be assigned as a phonon excitation. In Fig.3(c) we show the same scan as in Fig.3 (b) but at 35 meV . We observe the excitation to lose intensity with increasing temperature, with the loss in intensity being larger than that expected for the acoustic magnon branch. The additional excitation observed in Fig.3(c) loses intensity with increasing temperature implying a magnetic origin, consistent with the additional ferromagnetic mode observed in the .
In figure 3(d) we show how we measured the dispersion of the additional magnetic excitation in the with increasing energy transfer, and observe a dispersion apparently consistent with that observed in the freeman-PRB-2005 . After finding evidence of an additional magnetic excitation in the sample, we searched for the same excitation in the . We performed the same scans in reciprocal space in the as in the in Fig.3(e). In Fig.3(e) there is an excitation in the that appears to disperse, but there is a problem with this observation. To compare the excitations observed between 32.5 meV to 37.5 meV in the and we compare in Fig.3(f) the fitted intensities obtained from fits of a Gaussian lineshape on a sloping background, relative to the intensity of the acoustic magnon at 30 meV, without correcting for magnetic form factor or doping variation of the acoustic magnon at 30 meV. In the the intensity of the mode at meV is a factor of 6.40.5 times greater than the acoustic magnon at 30 meV, and at 37.5 meV the excitation is still 5.30.7 times larger than the 30 meV acoustic magnon. Whereas in the , the intensity of the mode at 32.5 meV is a factor of 2.30.3 larger than the 30 meV acoustic magnon, but by 37.5 meV there is no intensity difference, with a relative intensity of 1.20.2. Tentatively we conclude from the observed intensity variation, that there is a ferromagnatic excitation mode in the but not in the , and that there is a presence of a flat phonon mode at 32.5-35 meV at both doping levels. Within this interpretation we can estimate the strengths of the different excitations present in the at 32.5 meV. We know that between 30 meV and 32.5 meV the intensity of the acoustic magnon is smallfreeman-PRB-2005 , assuming this loss is negligble we use the measured intensity of teh acoustic magnon at 30 meV to estimate the relative intensities of the acoustic magnon and phonon measured at 32.5 meV in the . Assuming the ratio between the acoustic magnon and phonon at 32.5 meV has little doping variation, we estimate that the ratio of acoustic magnon to optic phonon to ferromagnetic gapped excitation in the at 32.5 meV shown in Fig. 3 3(d) is 1:1.6:3.9. We can, however, definitely say that a ferromagnetic excitation rapidly gains intensity on doping from to .
.
A second additional magnetic excitation was observed in the above the top of the acoustic magnon branch, and due to the mode centring it was interpreted as due to antiferomagnetic discommensurationsfreeman-PRB-2005 . We searched inconclusively for this mode, due to the difficulty in establishing the maximum energy of the acoustic magnon dispersion, and not knowing the effect of charge ordering on the phonon modes at high doping levelsTranquada-PRL-2002 .
III CONCLUSIONS
Our measurements of the magnetic excitation spectrums of the and appear to show two effects, with neither effect requiring the presence of checkerboard charge order. The first effect is that the excitation spectrum at high energies ( meV) for both the and are not centred symmetrically about the magnetic zone centre, but are shifted towards . This contrasts with the symmetric spin wave cones observed in the and , with counter propagating modes that disperse with equal intensity towards and away from in reciprocal space. Between and the only change in the materials we are aware of is the change in nature of the free charge carriers from electron like to hole like, but it is unclear how this should effect the magnetic excitationskatsufji-PRB-1999 .
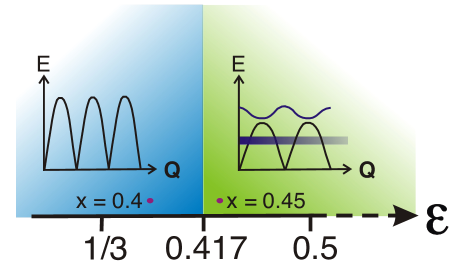
In the an additional excitation mode is observed, that appears not to be present in the . In the , over the energy range 32.5 to 37.5 meV we have shown evidence of a ferromagnetic excitation, which is consistent with one of two additional excitation modes observed in the . In the the additional magnetic modes are qualitatively explained as arising from discommensurations in the magnetic structure. That discommensurations produce new modes in the excitation spectrum of the and not , we tentatively propose is due to whether the discommensurations are distortions of the checkerboard spin state or the charge-stripe phase with stripes 3 Ni-Ni distances appart. That is, is the charge stripe order closer to the checkerboard order state or a stripe state with charge stripes three Ni sites apart, i.e. is (= 1/charge order periodicity) or is . For discommensurations only broaden the excitations, but for discommensurations lead to new excitation modes, as we depict in figure 4. Whether this means there will be a doping crossover in the magnetic excitation between charge stripe order with which has an optic magnetic excitation, and which only has an acoustic magnetic excitation branch, we cannot say. But oxygen doped La2NiO4.11 with appears to have an optic excitation mode, whereas the and appear not to have an optic magnetic excitation mode. As the number of magnetic excitation modes is a distingushing feature of theories of the magnetic excitations of the cupratesSeibold-PRB-2006 , we need to resolve the issue of whether the charge stripe ordered nickelates have the magnetic dispersion relation of their nearest commensurate charge-stripe structure or the dispersion of admixtures of different commensurate charge stripe ordered phases.
Acknowledgements.
We wish to acknowledge that crystal growth for this work was supported by the Engineering and Physical Sciences Research Council of Great Britain. This research project has been supported by the European Commission under the 6th Framework Programme through the Key Action: Strengthening the European Research Area, Research Infrastructures. Contract n : RII3-CT-2003-505925.References
- (1) A. T. Boothroyd, P. Babkevich, D. Prabhakaran, and P. G. Freeman, 2011 Nature 375, 561 (2011).
- (2) H. Ulbrich, P. Steffens, D. Lamago, Y. Sidis, M. Braden, arXiv:1112.1799
- (3) David LeBoeuf, Nicolas Doiron-Leyraud, Julien Levallois, R. Daou, J.-B. Bonnemaison, N. E. Hussey, L. Balicas, B. J. Ramshaw, Ruixing Liang, D. A. Bonn, W. N. Hardy, S. Adachi, Cyril Proust, and Louis Taillefer Nature 450, 533 (2007); David LeBoeuf, Nicolas Doiron-Leyraud, B. Vignolle, Mike Sutherland, B. J. Ramshaw, J. Levallois, R. Daou, Francis Laliberté, Olivier Cyr-Choinière, Johan Chang, Y. J. Jo, L. Balicas, Ruixing Liang, D. A. Bonn, W. N. Hardy, Cyril Proust, and Louis Taillefer, Phys Rev. B 83, 054506 (2011); F. Laliberte, J. Chang, N. Doiron-Leyraud, E. Hassinger, R. Daou, M. Rondeau, B. J. Ramshaw, R. Liang, D. A. Bonn, W. N. Hardy, S. Pyon, T. Takayama, H. Takagi, I. Sheikin, L. Malone, C. Proust, K. Behnia, and L. Taillefer, Nature Communications 2, 432 (2011); Tao Wu, Hadrien Mayaffre, Steffen Kr mer, Mladen Horvatić, Claude Berthier, W. N. Hardy, Ruixing Liang, D. A. Bonn,and Marc-Henri Julien Nature 477, 191 (2011).
- (4) A. T. Boothroyd, D. Prabhakaran, P. G. Freeman, S. J. S. Lister, M. Enderle, A. Hiess, and J. Kulda, Phys. Rev. B 67, 100407(R) (2003).
- (5) P. Bourges, Y. Sidis, M. Braden, K. Nakajima, and J. M. Tranquada Phys. Rev. Lett. 90 147202 (2003).
- (6) H. Woo, A. T. Boothroyd, K. Nakajima, T.G. Perring, C. D. Frost, P. G. Freeman, D. Prabhakaran, K. Yamada and J. M. Tranquada, Phys. Rev. B 72, 064437 (2005).
- (7) P. G. Freeman, A. T. Boothroyd, D. Prabhakaran, C. D. Frost, M. Enderle, and A. Heiss, Phys. Rev. B 71, 174412 (2005).
- (8) D. X. Yao and E. W. Carlson, Phys. Rev. B 75 ,012414 (2007) .
- (9) R. Kajimoto, K. Ishizaka, H. Yoshizawa, and Y. Tokura, Phys Rev B 67, 014511 (2003).
- (10) D. Prabhakaran, Isla P., and A. T. Boothroyd, J. Cryst. Growth 237, 815 (2002)
- (11) P. G. Freeman, A. T. Boothroyd, D. Prabhakaran, M. Enderle and C. Niedermayer, Phys. Rev. B 70, 024413 (2004)
- (12) S. R. Giblin, P. G. Freeman, K. Hradil, D. Prabhakaran, and A. T. Boothroyd, Phys. Rev. B 78 ,184423 (2008) .
- (13) P. G. Freeman, S. R. Giblin and D. Prabhakaran, J Supercond. Nov. Mag. 24, 1149 (2011).
- (14) J. M. Tranquada, K. Nakajima, M. Braden, L. Pintschovius, and R. J. McQueeney, Phys. Rev. Lett. 88, 075505 (2002).
- (15) T. Katsufuji, T. Tanabe, T. Ishikawa, S. Yamanouchi, Y. Tokura, T. Kakeshita, R. Kajimoto, and H. Yoshizawa, Phys. Rev. B 60, R5097 (1999)
- (16) G. Seibold, and J. Lorenzana, Phys. Rev. B 73, 144515 (2006).