Average-Case Performance of Rollout Algorithms
for Knapsack Problems††thanks: Supported by NSF grant 1029603. The first author is supported in part by a NSF graduate research fellowship.
Abstract
Rollout algorithms have demonstrated excellent performance on a variety of dynamic and discrete optimization problems. Interpreted as an approximate dynamic programming algorithm, a rollout algorithm estimates the value-to-go at each decision stage by simulating future events while following a greedy policy, referred to as the base policy. While in many cases rollout algorithms are guaranteed to perform as well as their base policies, there have been few theoretical results showing additional improvement in performance. In this paper we perform a probabilistic analysis of the subset sum problem and knapsack problem, giving theoretical evidence that rollout algorithms perform strictly better than their base policies. Using a stochastic model from the existing literature, we analyze two rollout methods that we refer to as the consecutive rollout and exhaustive rollout, both of which employ a simple greedy base policy. For the subset sum problem, we prove that after only a single iteration of the rollout algorithm, both methods yield at least a reduction in the expected gap between the solution value and capacity, relative to the base policy. Analogous results are shown for the knapsack problem.
Keywords Rollout algorithms, lookahead, knapsack problems, approximate dynamic programming
1 Introduction
Rollout algorithms provide a natural and easily implemented approach for approximately solving many discrete and dynamic optimization problems. Their motivation comes from problems that can be solved using classical dynamic programming, but for which determining the value function (or value-to-go function) is computationally infeasible. The rollout technique estimates these values by simulating future events while following a simple greedy/heuristic policy, referred to as the base policy. In most cases the rollout algorithm is ensured to perform as well as its base policy [1]. As shown by many computational studies, the performance is often much better than the base policy, and sometimes near optimal [2].
Theoretical results showing a strict improvement of rollout algorithms over base policies have been limited to average-case asymptotic bounds on the breakthrough problem and a worst-case analysis of the knapsack problem [3, 4]. The latter work motivates a complementary study of rollout algorithms for knapsack-type problems from an average-case perspective, which we provide in this paper. Our goals are to give theoretical evidence for the utility of rollout algorithms and to contribute to the knowledge of problem types and features that make rollout algorithms work well. We anticipate that our proof techniques may be helpful in achieving performance guarantees on similar problems.
We use a stochastic model directly from the literature that has been used to study a wide variety of greedy algorithms for the subset sum problem [5]. This model is extended in a natural manner for our analysis of the knapsack problem. We analyze two rollout techniques that we refer to as the consecutive rollout and the exhaustive rollout, both of which use the same base policy. The first algorithm sequentially processes the items and at each iteration decides if the current item should be added to the knapsack. During each iteration of the exhaustive rollout, the algorithm decides which one of the available items should be added to the knapsack. The base policy is a simple greedy algorithm that adds items until an infeasible item is encountered.
For both techniques, we derive bounds showing that the expected performance of the rollout algorithms is strictly better than the performance obtained by only using the base policy. For the subset sum problem, this is demonstrated by measuring the gap between the total value of packed items and capacity. For the knapsack problem, the difference between total profits of the rollout algorithm and base policy is measured. The bounds are valid after only a single iteration of the rollout algorithm and hold for additional iterations.
The organization of the paper is as follows. In the remainder of this section we review related work, and we introduce our notation in Section 2. Section 3 describes the stochastic models in detail and derives important properties of the blind greedy algorithm, which is the algorithm that we use for a base policy. Results for the consecutive rollout and exhaustive rollout are shown in Section 4 and Section 5, respectively; these sections contain the most important proofs used in our analysis. A conclusion is given in Section 6. A list of symbols, omitted proofs, and an appendix with evaluations of integrals are provided in the supplementary material.
1.1 Related work
Rollout algorithms were introduced by Tesauro and Galperin as online Monte-Carlo search techniques for computer backgammon [6]. The application to combinatorial optimization was formalized by Bertsekas, Tsitsiklis, and Wu [1]. They gave conditions under which the rollout algorithm is guaranteed to perform as well as its base policy, namely if the algorithm is sequentially consistent or sequentially improving, and presented computational results on a two-stage maintenance and repair problem. The application of rollout algorithms to approximate stochastic dynamic programs was provided by Bertsekas and Castañon, where they showed extensive computational results on variations of the quiz problem [2]. Rollout algorithms have since shown strong computational results on a variety of problems including vehicle routing, fault detection, and sensor scheduling [7, 8, 9].
Beyond simple bounds derived from base policies, the only theoretical results given explicitly for rollout algorithms are average-case results for the breakthrough problem and worst-case results for the 0-1 knapsack problem [4, 3]. In the breakthrough problem, the objective is to find a valid path through a directed binary tree where some edges are blocked. If the free (non-blocked) edges occur with probability , independent of other edges, a rollout algorithm has a larger probability of finding a free path in comparison to a greedy algorithm [3]. Performance bounds for the knapsack problem were recently shown by Bertazzi [4], who analyzed the rollout approach with variations of the decreasing density greedy (DDG) algorithm as a base policy. The DDG algorithm takes the best of two solutions: the one obtained by adding items in order of non-increasing profit to weight ratio, as long as they fit, and the solution resulting from adding only the item with highest profit. He demonstrated that from a worst-case perspective, running the first iteration of a rollout algorithm (specifically, what we will refer to as the exhaustive rollout algorithm) improves the approximation guarantee from (bound provided by the base policy) to .
An early probabilistic analysis of the subset sum problem was given by d’Atri and Puech [10]. Using a discrete version of the model used in our paper, they analyzed the expected performance of greedy algorithms with and without sorting. They showed an exact probability distribution for the gap remaining after the algorithms and gave asymptotic expressions for the probability of obtaining a non-zero gap. These results were refined by Pferschy, who gave precise bounds on expected gap values for greedy algorithms [11].
A very extensive analysis of greedy algorithms for the subset sum problem was given by Borgwardt and Tremel [5]. They introduced the continuous model that we use in this paper and derived probability distributions of gaps for a variety of greedy algorithms. In particular, they showed performance bounds for a variety of prolongations of a greedy algorithm, where a different strategy is used on the remaining items after the greedy policy is no longer feasible. They also analyzed cases where items are ordered by size prior to use of the greedy algorithms.
In the area of probabilistic knapsack problems, Szkatula and Libura investigated the behavior of greedy algorithms, similar to the blind greedy algorithm used in our paper, for the knapsack problem with fixed capacity. They found recurrence equations describing the weight of the knapsack after each iteration and solved the equations for the case of uniform weights [12]. In later work they studied asymptotic properties of greedy algorithms, including conditions for the knapsack to be filled almost surely as [13].
There has been some work on asymptotic properties of the decreasing density greedy algorithm for probabilistic knapsack problems. Diubin and Korbut showed properties of the asymptotical tolerance of the algorithm, which characterizes the deviation of the solution from the optimal value [14]. Similarly, Calvin and Leung showed convergence in distribution between the value obtained by the DDG algorithm and the value of the knapsack linear relaxation [15].
2 Notation
Before we describe the model and algorithms, we summarize our notation. Since we must keep track of ordering in our analysis, we use sequences in place of sets and slightly abuse notation to perform set operations on sequences. These operations will mainly involve index sequences, and our index sequences will always contain unique elements. Sequences will be denoted by bold letters. If we wish for to be the increasing sequence of integers ranging from to , we write . We then have while . We also say that and . The concatenation of sequence with sequence is denoted by . If then . A sequence is indexed by an index sequence if the index sequence is shown in the subscript. Thus indicates the sequence . For a sequence to satisfy equality with another sequence, equality must be satisfied element by element, according to the order of the sequence. We use the notation to denote the sequence with item moved to the front of the sequence: .
The notation indicates probability and indicates expectation. We define . For random variables, we will use capital letters to denote the random variable (or sequence) and lowercase letters to denote specific instances of the random variable (or sequence). The probability density function for a random variable is denoted by . For random variables and , we use to denote the conditional density of given the event . When multiple variables are involved, all variables on the left side of the vertical bar are conditioned on all variables on the right side of vertical bar. The expression should be interpreted as and not , for example. Events are denoted by the calligraphic font, such as , and the disjunction of two events is shown by the symbol . We often write conditional probabilities of the form as . The notation indicates the density of a uniform random variable on interval . The indicator function is denoted by and the positive part of an expression is denoted by . Finally, we use the standard symbols for assignment (), definition (), the positive real numbers (), and asymptotic growth ().
3 Stochastic model and blind greedy algorithm
In the knapsack problem, we are given a sequence of items where each item has a weight and profit . Given a knapsack with capacity , the goal is to select a subset of items with maximum total profit such that the total weight does not exceed the capacity. This is given by the following integer linear program.
| (1) |
For the subset sum problem, we simply have for all .
We use the stochastic subset sum model given by Borgwardt and Tremel [5], and a variation of this model for the knapsack problem. In their subset sum model, for a specified number of items , item weights and the capacity are drawn independently from the following distributions:
| (2) |
Our stochastic knapsack model simply assigns item profits that are independently and uniformly distributed,
| (3) |
These values are also independent with respect to the weights and capacity.
For evaluating performance, we only consider cases where . In all other cases, any algorithm that tries adding all items is optimal. Since it is difficult to understand the stochastic nature of optimal solutions, we use as a performance metric for the subset sum problem, where is the sequence of items selected by the algorithm of interest. This is the same metric used in [5], where they note with a simple symmetry argument that for all values of ,
| (4) |
For the knapsack problem, we directly measure the difference between the rollout algorithm profit and the profit given by the base policy, which we refer to as the gain of the rollout algorithm.
For both the subset sum problem and the knapsack problem, we use the Blind-Greedy algorithm, shown in Algorithm 1, as a base policy. The algorithm simply adds items (without sorting) until it encounters an item that exceeds the remaining capacity, then stops. Throughout the paper, we will sometimes refer to Blind-Greedy simply as the greedy algorithm.
Blind-Greedy may seem inferior to a greedy algorithm that first sorts the items by weight or profit to weight ratio and then adds them in non-decreasing value. Surprisingly, for the subset sum problem, it was shown in [5] that the algorithm that adds items in order of non-decreasing weight (referred to as Greedy 1S) performs equivalently to Blind-Greedy. Of course, we cannot say the same about the knapsack problem. A greedy algorithm that adds items in decreasing profit to weight ratio is likely to perform much better. Applying our analysis to a sorted greedy algorithm requires work beyond the scope of this paper.
In analyzing Blind-Greedy, we refer to the index of the first item that is infeasible as the critical item. Let be the random variable for the index of the critical item, where indicates that there is no critical item (meaning ). Equivalently, assuming , the critical item index satisfies
| (5) |
We will refer to items with indices as packed items. We then define the gap of Blind-Greedy as
| (6) |
for . The gap is relevant to both the subset sum problem and the knapsack problem. For the knapsack problem, we define the gain of the rollout algorithm as
| (7) |
where is the sequence of items selected by the rollout algorithm. A central result of [5] is the following, which does not depend on the number of items .
Theorem 3.1 (Borgwardt and Tremel, 1991)
Independent of the critical item index , the probability distribution of the gap obtained by Blind-Greedy satisfies
| (8) |
| (9) |
Many studies measure performance using an approximation ratio (bounding the ratio of the value obtained by some algorithm to the optimal value) [16, 4]. While this metric is generally not tractable under the stochastic model, we can observe a simple lower bound on the ratio of expectations of the value given by Blind-Greedy to the optimal value, for the subset sum problem111The expected ratio, rather than the ratio of expectations, may be a better benchmark here, but is less tractable. A natural upper bound on the optimal solution is , and the solution value given by Blind-Greedy is equal to . Thus by Theorem 9 and linearity of expectations, the ratio of expected values is at least . For , this value is at least , which is the best worst-case approximation ratio derived in [4]. A similar comparison for the knapsack problem is not possible because there is no simple bound on the expected optimal solution value.
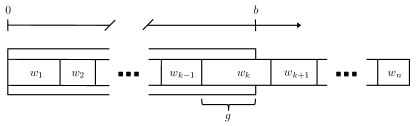
We describe some important properties of the Blind-Greedy solution that will be used in later sections and that provide a proof of Theorem 9. For the proofs in this section as well as other sections, it is helpful to visualize the Blind-Greedy solution sequence on the nonnegative real line, as shown in Figure 1.
Previous work on the stochastic model has demonstrated that the critical item index is uniformly distributed on for cases of interest (i.e. ) [5]. In addition to this property, we show that the probability that a given item is critical is independent of weights of all other items222In other sections we follow the convention of associating the index with the random variable . The index is used in this section to make the proofs clearer..
Lemma 3.1
For each item , for all subsequences of items and all weights , the probability that item is critical is
| (10) |
Proof.
Assume that we are given the weights of all items . We can divide the interval into segments as a function of item weights as shown in Figure 1, so that the th segment occupies the interval for and the last segment is on . The probability that item is critical is the probability that intersects the th segment. Since is distributed uniformly over the interval , we have
| (11) |
showing that this event only depends on . Integrating over the uniform density of gives the result. ∎
An important property of this stochastic model, which is key for the rest of our development, is that conditioning on the critical item index only changes the weight distribution of the critical item; all other item weights remain independently distributed on .
Lemma 3.2
For any critical item and any subsequence of items , the weights are independently distributed on , and independently follows the distribution
| (12) |
Proof.
For any item , consider the subsequence of items . Using Bayes’ theorem, the conditional joint density for is given by
| (13) | |||||
where we have used the results of Lemma 3.1. This holds for the and , so we replace the index with in the expression. ∎
We can now analyze the gap obtained by Blind-Greedy for . This gives the following lemma and a proof of Theorem 9.
Lemma 3.3
Independent of the critical item index , the conditional distribution of the gap obtained by Blind-Greedy satisfies
| (14) |
Proof.
For any and any , the posterior distribution of given the event satisfies
| (15) |
since we have a uniform random variable that is conditionally contained in a given interval. Now using the definition of in (6),
| (16) |
∎
Proof of Theorem 9. Using Lemma 14 and the distribution for from Lemma 3.2, we have for ,
| (17) |
where we have used that with probability one. This serves as a simpler proof of the theorem from [5]; their proof is likely more conducive to their analysis. ∎
Finally, we need a modified version of Lemma 3.2, which will be used in the subsequent sections.
Lemma 3.4
Given any critical item , gap , and any subsequence of items , the weights are independently distributed on , and is independently distributed on .
4 Consecutive rollout
The Consecutive-Rollout algorithm is shown in Algorithm 2. The algorithm takes as input a sequence of item weights and capacity , and makes calls to Blind-Greedy as a subroutine. At iteration , the algorithm calculates the value () of adding item to the solution and using Blind-Greedy on the remaining items, and the value () of not adding the item to the solution and using Blind-Greedy thereafter. The item is then added to the solution only if the former valuation () is larger.
We only focus on the result of the first iteration of the algorithm; bounds from the first iteration are valid for future iterations333The technical condition for this property to hold is that the base policy/algorithm is sequentially consistent, as defined in [1]. It is easy to verify that Blind-Greedy satisfies this property.. A single iteration of Consecutive-Rollout effectively takes the best of two solutions, the one obtained by Blind-Greedy and the solution obtained from using Blind-Greedy after removing the first item. Let denote the gap obtained by a single iteration of the rollout algorithm for the subset sum problem with items under the stochastic model.
Theorem 4.1
For the subset sum problem with , the gap obtained by running a single iteration of Consecutive-Rollout satisfies
| (21) |
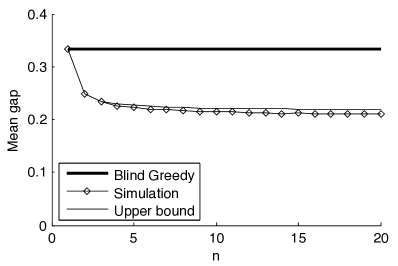
As expected, there is not a strong dependence on for this algorithm. The bound is tight for , where it evaluates to . It is also clear that . The bounds are shown with simulated performance in Figure 2(a). A similar result holds for the knapsack problem.
Theorem 4.2
For the knapsack problem with , the gain obtained by running a single iteration of Consecutive-Rollout satisfies
| (22) |
The bound is plotted with simulated values in Figure 2(b). Again the bound is tight for with a gain of . Asymptotically, . The rest of this section is devoted to the proof of Theorem 21. The proof of Theorem 22 follows a similar structure and is given in the supplementary material.
4.1 Consecutive rollout: subset sum problem analysis
The proof idea for Theorem 21 is to visually analyze the solution sequence given by Blind-Greedy on the nonnegative real line, as shown in Figure 1, and then look at modifications to this solution caused by removing the first item. Removing the first item causes the other items to slide to the left and may make some remaining items feasible to pack. We determine bounds on the gap produced by this procedure while conditioning on the greedy gap , critical item , and the item weights . We then take the minimum of this gap and the greedy gap and integrate over conditioned variables to obtain the final bound. Our analysis is divided into lemmas based on the critical item . We show a detailed proof of the lemma corresponding to . For the cases where or , the proofs are similar and are placed in the supplementary material.
To formalize the behavior of Consecutive-Rollout, we introduce the following two definitions. The drop critical item is the index of the item that becomes critical when the first item is removed and thus satisfies
| (24) |
where the latter case signifies that all remaining items can be packed. The drop gap then has definition
| (25) |
We are ultimately interested in the minimum of the drop gap and the greedy gap, which we refer to as the minimum gap, and is the value obtained by the first iteration of the rollout algorithm:
| (26) |
We will often write write simply as . We will also use to denote the event that item is critical and for the event that . Also recall that we have for the subset sum problem.
Lemma 4.1
For , the expected minimum gap satisfies
| (27) |
Proof.
Fix for . The drop gap in general may be a function of the weights of all remaining items. To make things more tractable, we define the random variable that satisfies with probability one, and as we will show, is a deterministic function of only . The variable is specifically defined as
| (30) |
In effect, does not account for the additional reduction in the gap given if any of the items become feasible, so it is clear that .
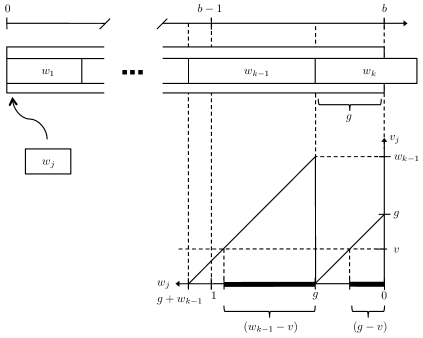
To determine the distribution of , we start by considering scenarios where is not possible and thus . For and , an illustration of the drop gap as determined by is shown in Figure 3. We will follow the convention of using lowercase letters for random variables shown in figures and when referring these variables. The knapsack is shown at the top of the figure with items packed from left to right, and at the bottom the drop gap is shown as a function of . The shape of the function is justified by considering different sizes of . As long as is smaller than , the gap given by removing the first item increases at unit rate. As soon as , item becomes feasible and the gap jumps to zero. The gap then increases at unit rate and another jump occurs when reaches . The case shown in the figure satisfies . It can be seen that this is a sufficient condition for the event to be impossible since even if , item cannot become feasible. It is for this reason that is uniquely determined by here.
Continuing with the case shown in the figure, if we only condition on , we have by Lemma 3.4 that follows distribution , meaning that the event is given by the length of the bold regions on the axis. We explicitly describe the size of these regions. Assuming that , we derive the following expression:
| (31) | |||||
The first three terms in the expression come from the three bold regions shown in Figure 3. We have specified that , so the length of the first segment is always . For the second term, it is possible that , so we only take the positive portion of . In the third term, we take the positive portion to account for the cases where (1) item does not become feasible, meaning , and (2) if it is feasible, where is greater than the height of the third peak, where .
The last term is required for the case where item does not become feasible, as we must subtract the length of the bold region that potentially extends beyond . Note that we always subtract one in this expression since it is not possible for the value where on the second peak to be greater than one. To see this, assume the contrary, so that . This inequality is obtained since on the second peak we have and the value that satisfies is equal to . The statement , however, violates our previously stated assumption that .
We now argue that we in fact have with probability one, where
| (32) | |||||
We have simply replaced with in (31) and removed the condition . We already know that the expression is true for . For , we refer to Figure 3 and visualize the effect of a much smaller , so that . This would yield four (or more) peaks in the function. To determine the probability of the event while is random, we would have to evaluate the sizes of these extra peaks, which would be a function of , , etc. However, our definition of does not account for the additional reductions in the gap given by items beyond . We have already shown that , and it is now clear that is a deterministic function of , and that (32) is justified.
We now evaluate the minimum of and and integrate over the conditioned variables. To begin, note that conditioning on the gap makes and independent, so,
| (33) |
Marginalizing over , which has uniform density according to Lemma 3.4, gives
| (34) | |||||
Using Lemma 14, we have
| (35) | |||||
Finally, we integrate over according to Lemma 3.2
| (36) | |||||
This term is sufficient for calculating the expected value bound. ∎
Lemma 4.2
For , the expected minimum gap satisfies
| (37) |
Proof. Supplementary material.
Lemma 4.3
For , the expected minimum gap satisfies
| (38) |
Proof. Supplementary material.
The final result for the subset sum problem follows easily from the stated lemmas.
5 Exhaustive rollout
The Exhaustive-Rollout algorithm is shown in Algorithm 3. It takes as input a sequence of item weights and capacity . At each iteration, indexed by , the algorithm considers all items in the available sequence . It calculates the value obtained by moving each item to the front of the sequence and applying the Blind-Greedy algorithm. The algorithm then adds the item with the highest estimated value (if it exists) to the solution. We implicitly assume a consistent tie-breaking method, such as giving preference to the item with the lowest index. The next iteration then proceeds with the remaining sequence of items.
 |
 |
| (a) | (b) |
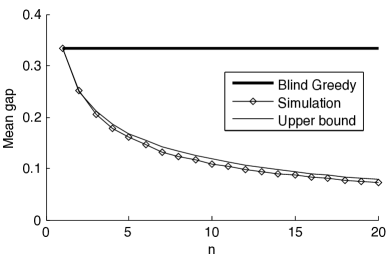
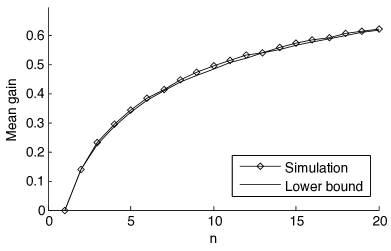
We again only consider the first iteration, which tries using Blind-Greedy after moving each item to the front of the sequence, and takes the best of these solutions. This gives an upper bound for the subset sum gap and a lower bound on the knapsack problem gain following from additional iterations. For the subset sum problem, let denote the gap obtained after a single iteration of Exhaustive-Rollout on the stochastic model with items. We have the following bounds.
Theorem 5.1
For the subset sum problem, the gap after running a single iteration of Exhaustive-Rollout satisfies
| (39) |
Corollary 5.1
| (40) |
Theorem 5.2
| (41) |
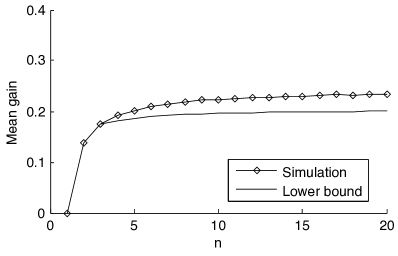
A plot of the bounds and simulated results is shown in Figure 4(a). For the knapsack problem, let denote the gain given by a single iteration of Exhaustive-Rollout. The expected gain is bounded by the two following theorems, where is the th harmonic number, .
Theorem 5.3
For the knapsack problem, the gain after running a single iteration Exhaustive-Rollout satisfies
where
| (43) | |||||
Theorem 5.4
| (44) |
The expected gain approaches unit value at a rate slightly slower than the convergence rate for the subset sum problem444This is likely a result of the fact that in the subset sum problem, the algorithm is searching for an item with one criteria: a weight approximately equal to the gap. For the knapsack problem, however, the algorithm must find an item satisfying two criteria: a weight smaller than the gap and a profit approximately equal to one.. The gain is plotted with simulated values in Figure 4(b). While the bound in Theorem 5.3 does not admit a simple integral bound, omitting the nested summation term gives a looser but valid bound. We show the proof of Theorem 5.1 in the remainder of this section. All remaining results are given in the supplementary material.
5.1 Exhaustive rollout: subset sum problem analysis
The proof method for Theorem 5.1 is similar to the approach taken in the previous section. With Figure 1 in mind, we will analyze the effect of individually moving each item to the front of the sequence, which will cause the other items to shift to the right. Our strategy is to perform this analysis while conditioning on three parameters: the greedy gap , the critical item , and the weight of the last packed item . We then find the minimum gap given by trying all items and integrate over conditioned variables to obtain the final bound.
To analyze solutions obtained by using Blind-Greedy after moving a given item to the front of the sequence, we introduce two definitions. The th insertion critical item is the first item that is infeasible to pack by Blind-Greedy when item is moved to the front of the sequence. Equivalently, satisfies
| (47) |
We then define the corresponding th insertion gap , which is the gap given by the greedy algorithm when item is moved to the front of the sequence:
| (48) |
In the following three lemmas, we bound the probability distribution of the insertion gap for packed items (), he critical item (), and the remaining items (), while assuming that . Lemma 5.4 then handles the case where . Thereafter we bound the minimum of these gaps and the greedy gap , and finally integrate over the conditioned variables to obtain the bound on the expected minimum gap. The key analysis is illustrated in the proof of Lemma 5.2; the related proofs of Lemma 5.3 and Lemma 5.4 are given in the supplementary material. The event again indicates that item is critical, and indicates the event that the first item is not critical.
Lemma 5.1
For and , the th insertion gap satisfies
| (49) |
with probability one.
Proof.
This follows trivially since the term in (5) does not depend on the order of summation. ∎
Lemma 5.2
For and , the th insertion gap satisfies with probability one, where is a deterministic function of and conditioning only on gives
| (50) | |||||
Proof.
Fix for . To simplify notation make the event implicit throughout the proof. Define the random variable so that
| (52) |
While may in general depend on , the variable is chosen so that it only depends on . In cases where does only depend on , we have . When depends on more than these three variables, assumes a worst-case bound of unit value.
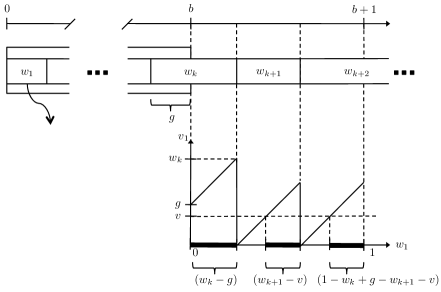
We begin by analyzing the case where so that the insertion gap is equal to . For and , a diagram illustrating the insertion gap as determined by , , and is shown in Figure 5. The knapsack is shown at the top of the figure with items packed sequentially from left to right. The plot at the bottom shows the insertion gap that occurs when item is inserted at the front of the sequence, causing the remaining packed items to slide to the right. The plot is best understood by visualizing the effect of varying sizes of . If is very small, the items slide to the right and reduce the gap by the amount . Clearly if then as indicated by the function. As soon as is slightly larger than , it is infeasible to pack item and the gap jumps. Thus for the instance shown, the th insertion gap is a deterministic function of .
Considering the instance in the figure, if we only condition on and and allow to be random, then becomes a random variable whose only source of uncertainty is . Since by Lemma 3.4 has distribution , the probability of the event is given by the length of the bold regions on the axis.
We now explicitly describe the length of the bold regions for all cases of and ; this will include the case (not possible for the instance in the figure), so the length of the bold regions will define . Starting with the instance shown, we have as given by the lengths of the two bold regions, corresponding to the events and , respectively. This requires that and , so the expression becomes . We must account for the case where , requiring that we subtract length , so we revise the expression to . Finally, for the case of , we must take care of the region where . It is at this point that the event or becomes possible and the distinction between and is made. Here we have by definition , which trivially satisfies , so for any this region contributes to This is handled by adding the term to the expression. We finally arrive at
| (53) |
This holds true for any fixed as long as , so we may replace with and make the event explicit to obtain the statement of the lemma. ∎
Lemma 5.3
For , the th insertion gap satisfies with probability one, where is a deterministic function of and conditioning only on gives
| (54) | |||||
Proof. Supplementary material.
Lemma 5.4
For and , the th insertion gap is a deterministic function of , and conditioning only on gives
| (55) |
Proof. Supplementary material.
Recall that is the gap obtained after the first iteration of the rollout algorithm on an instance items, which we refer to as the minimum gap,
| (56) |
We will make the dependence on implicit in what follows so that . We may now prove the final result.
Proof of Theorem 5.1. For , we have with probability one, where
| (57) |
This follows from Lemmas 5.1 - 5.3, as for . From the analysis in Lemmas 5.2 and 5.3, for each , is a deterministic function of . Furthermore from Lemma 3.4, the item weights for are independently distributed on , and is independently distributed on . Thus, conditioning only on and makes independent for , and by the definition of the minimum function,
Marginalizing over and using Lemma 3.4 and Theorem 9,
| (59) |
We refer to as via the substitution to simplify expressions. As shown in the appendix (see supplementary material), evaluation of the integral gives
| (62) |
where
| (63) | |||||
| (64) |
Calculating the expected value gives a surprisingly simple expression
| (65) |
We now consider the case where the first item is critical. By Lemma 5.4, each for is a deterministic function of and . All for are independent by Lemma 3.2, so
| (66) |
Integrating over by Theorem 9, we have
| (67) |
which can be used to calculate the expected value. Finally, accounting for all cases of using total expectation and Lemma 3.1,
| (68) |
Throughout all of the analysis in this section, we have implicitly assumed that . Making this condition explicit gives the desired bound. ∎
6 Conclusion
We have shown strong performance bounds for both the consecutive rollout and exhaustive rollout techniques on the subset sum problem and knapsack problem. These results hold after only a single iteration and provide bounds for additional iterations. Simulation results indicate that these bounds are very close in comparison with realized performance of a single iteration. We presented results characterizing the asymptotic behavior (asymptotic with respect to the total number of items) of the expected performance of both rollout techniques for the two problems.
An interesting direction in future work is to consider a second iteration of the rollout algorithm. The worst-case analysis of rollout algorithms for the knapsack problem in [4] shows that running one iteration results in a notable improvement, but it is not possible to guarantee additional improvement with more iterations for the given base policy. This behavior is generally not observed in practice [2], and is not a limitation in the average-case scenario. A related topic is to still consider only the first iteration of the rollout algorithm, but with a larger lookahead length (e.g. trying all pairs of items for the exhaustive rollout, rather than just each item individually). Finally, it is desirable to have theoretical results for more complex problems. Studying problems with multidimensional state space is appealing since these are the types of problems where rollout techniques are often used and perform well in practice. In this direction, it would be useful to consider problems such as the bin packing problem, the multiple knapsack problem, and the multidimensional knapsack problem.
References
- [1] Bertsekas, D.P., Tsitsiklis, J., Wu, C.: Rollout algorithms for combinatorial optimization. Journal of Heuristics 3, 245–262 (1997)
- [2] Bertsekas, D.P., Castanon, D.A.: Rollout algorithms for stochastic scheduling problems. Journal of Heuristics 5, 89–108 (1999)
- [3] Bertsekas, D.P.: Dynamic Programming and Optimal Control. Athena Scientific, 3rd edn. (2007)
- [4] Bertazzi, L.: Minimum and worst-case performance ratios of rollout algorithms. Journal of Optimization Theory and Applications 152, 378–393 (2012)
- [5] Borgwardt, K., Tremel, B.: The average quality of greedy-algorithms for the subset-sum-maximization problem. Mathematical Methods of Operations Research 35, 113–149 (1991)
- [6] Tesauro, G., Galperin, G.R.: On-line policy improvement using monte-carlo search. Advances in Neural Information Processing Systems pp. 1068–1074 (1997)
- [7] Secomandi, N.: A rollout policy for the vehicle routing problem with stochastic demands. Oper. Res. 49, 796–802 (2001)
- [8] Tu, F., Pattipati, K.: Rollout strategies for sequential fault diagnosis. AUTOTESTCON Proceedings, pp. 269–295. IEEE (2002)
- [9] Li, Y., Krakow, L.W., Chong, E.K.P., Groom, K.N.: Approximate stochastic dynamic programming for sensor scheduling to track multiple targets. Digit. Signal Process. 19, 978–989 (2009)
- [10] D’Atri, G., Puech, C.: Probabilistic analysis of the subset-sum problem. Discrete Applied Mathematics 4, 329–334 (1982)
- [11] Pferschy, U.: Stochastic analysis of greedy algorithms for the subset sum problem. Central European Journal of Operations Research 7, 53–70 (1999)
- [12] Szkatula, K., Libura, M.: Probabilistic analysis of simple algorithms for binary knapsack problem. Control and Cybernetics 12, 147–157 (1983)
- [13] Szkatula, K., Libura, M.: On probabilistic properties of greedy-like algorithms for the binary knapsack problem. Proceedings of Advanced School on Stochastics in Combinatorial Optimization pp. 233–254 (1987)
- [14] Diubin, G., Korbut, A.: The average behaviour of greedy algorithms for the knapsack problem: general distributions. Mathematical Methods of Operations Research 57, 449–479 (2003)
- [15] Calvin, J.M., Leung, J.Y.T.: Average-case analysis of a greedy algorithm for the 0/1 knapsack problem. Operations Research Letters 31, 202–210 (2003)
- [16] Kellerer, H., Pferschy, U., Pisinger, D.: Knapsack problems. Springer (2004)