Effects of rf breakdown on the beam in the Compact Linear Collider prototype accelerator structure
Abstract
Understanding the effects of RF breakdown in high-gradient accelerator structures on the accelerated beam is an extremely relevant aspect in the development of the Compact Linear Collider (CLIC) and is one of the main issues addressed at the Two-beam Test Stand at the CLIC Test Facility 3 at CERN. During a RF breakdown high currents are generated causing parasitic magnetic fields which interact with the accelerated beam affecting its orbit. The beam energy is also affected because the power is partly reflected and partly absorbed thus reducing the available energy to accelerate the beam. We discuss here measurements of such effects observed on an electron beam accelerated in a CLIC prototype structure. Measurements of the trajectory of bunch-trains on a nanosecond time-scale showed fast changes in correspondence of breakdown which we compare with measurements of the relative beam spots on a scintillating screen. We identify different breakdown scenarios for which we offer an explanation based also on measurements of the power at the input and output ports of the accelerator structure. Finally we present the distribution of the magnitude of the observed changes in the beam position and we discuss its correlation with RF power and breakdown location in the accelerator structure.
pacs:
29.20.Ej, 52.80.Pi, 29.27.-aI Introduction
The Compact Linear Collider (CLIC) study aims to develop a linear accelerator to accelerate electrons and positrons to TeV scale energies Aicheler et al. (2012). In order to achieve this goal in a realistic and cost-effective way the loaded accelerating gradient needs to be as high as 100 MV/m. This high gradient precludes the use of superconducting accelerator structures Furuta et al. (2006) and therefore uses room-temperature X-band (12 GHz) technology.
The extremely high accelerating gradient entails the presence of electric field strengths on the inner surfaces of the structures in excess of 200 MV/m Grudiev (2010) which causes field emission and even discharges, so-called RF breakdown. The field emission is triggered from nano-metric imperfections on the structure walls which is observed as dark current during normal operation. It can randomly initiate an avalanche process which results in a RF breakdown. Breakdowns are a severe problem for the operational reliability of any accelerator, because an accelerator structure with a discharge is effectively “shorted” and the RF power is partly reflected and partly absorbed in the process, thus reducing the available power to accelerate the beam. A second effect is that the strong currents flowing during the discharge cause fields that deflect the beam. These processes were investigated earlier at SLAC where dark currents and breakdown in both waveguides and accelerator structures have been simulated Dolgashev et al. (2004); Dolgashev and Tantawi (2001); Bane et al. (2005). It was found that transverse momentum can be transferred to the beam and its magnitude was experimentally measured up to 30 keV/c Adolphsen (2005); Dolgashev and Raubenheimer (2004).
In this report we present the first study of the effect of discharges on an accelerated beam in the Two-beam Test Stand Ruber et al. (2008) in the CLIC Test Facility CTF3 at CERN Geschonke and Ghigo (2002). We focus on the measurements of transverse kicks to the beam due to RF breakdown in a CLIC prototype accelerator structure, carried on during the CTF3 2012 run.
The remainder of this report is organised as follows. First, we describe the experimental set-up, beam characteristics and diagnostics installed and used in the experiment. We then discuss the effect of the acceleration in the CLIC prototype accelerator structure on a single bunch-train. Afterwards we present evidence for RF breakdown effects on the beam, showing and discussing measurements of a few selected examples of bunch-trains accelerated in a CLIC prototype accelerator structure while a breakdown occurs. Finally, the methodology used for the analysis of the examples of breakdown presented is applied to a bigger data set for which we discuss the distribution of transverse kick magnitude and its correlation with RF power and breakdown location in the accelerator structure.
II CLIC and CTF3
The experiments we discuss were performed at CTF3 which was constructed in a collaborative effort in order to address several key issues of the CLIC design: the discharges in the accelerator structures is one of them and the experimental verification of the two-beam acceleration scheme is another. The latter is based on extraction of RF power from a moderate energy, high-current electron beam called drive beam, and transfer of such power to a low-current beam called main beam which is accelerated. The drive beam is decelerated in so-called Power Extraction and Transfer Structures (PETS) providing multi-MW 12 GHz radio frequency at the expense of the drive beam energy Adli et al. (2011). This setup is mimicked in CTF3 where the drive beam is passed through an experimental section, the Two-beam Test Stand Ruber et al. (2008), in parallel to a second low-current beam, so-called probe beam, which is then accelerated in a prototype accelerator structure using the energy extracted from the drive beam.
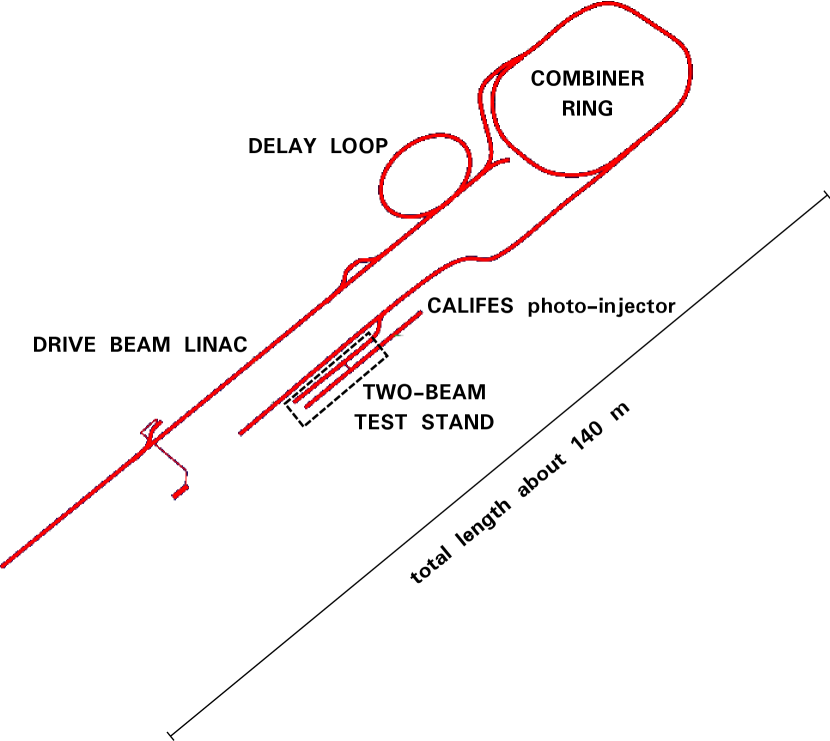
The Two-beam Test Stand is part of the CTF3 complex sketched in Fig. 1 where a 4 A drive beam consisting of a 1.2 long train of electron bunches extracted from a thermionic gun at 1.5 GHz is accelerated in a normal conducting linac to an energy of about 150 MeV. Its bunch frequency and its current are multiplied up to a maximum of 12 GHz and 28 A, respectively, by means of a delay line called delay loop and a ring called combiner ring, in order to build the time structure needed to efficiently produce 12 GHz RF power in the PETS. The probe beam is generated on a photocathode in a linac called CALIFES Farabolini et al. (2010) and then sent to the Two-beam Test Stand for two-beam acceleration experiments. A comparison between CLIC and CTF3 beam parameters is given in Table 1. The final drive beam time structure at CTF3 is the same as the CLIC one although in CTF3 it is achieved using a different combination of delay lines and rings than in CLIC. The beam current and energy (before deceleration) are lower in CTF3 than in CLIC. The CLIC main beam and the CTF3 probe beam have a similar time structure but different energy (before acceleration) and current, the latter being limited by beam loading and space charge in the accelerator structures used in the CALIFES linac Mosnier et al. (2006). The two-beam acceleration was successfully demonstrated at CTF3 in 2010 Ruber (2010) and afterwards even beyond the CLIC nominal requirements of 100 MV/m Skowroński et al. (2011). Nevertheless other experimental aspects are addressed at the Two-beam Test Stand which are connected to the acceleration technology.
| CLIC nominal | CTF3 2012 | |
| Drive beam | ||
|---|---|---|
| current | 101 A | 28 A |
| energy | 2.4 GeV | 150 MeV |
| bunch frequency | 12 GHz | 12 GHz |
| Main/Probe beam | ||
| current | 1 A | 0.2 A |
| energy | 9 GeV | 180 MeV |
| bunch frequency | 2 GHz | 1.5 GHz |
| bunch charge | 0.6 nC | 0.085 - 0.6 nC |
| bunches per pulse | 312 | 1 - 225 |
| repetition rate | 50 Hz | 0.8 - 5 Hz |
| transverse emittance | 0.6 mm mrad | mm mrad |
| name | TD24_vg1.8_disk |
|---|---|
| frequency | 11.995 GHz |
| number of cells | 24 + input cell + output cell |
| length | 22.77 cm |
| filling time | 64.55 ns |
| inner radius | 3.15/2.35 mm |
| group velocity | 1.617/0.811 % of c |
| phase advance/cell | 2/3 |
| input power (unloaded) | 46.55 MW for 100 MV/m |
| input power (loaded) | 64 MW for 100 MV/m |
III Experimental set-up
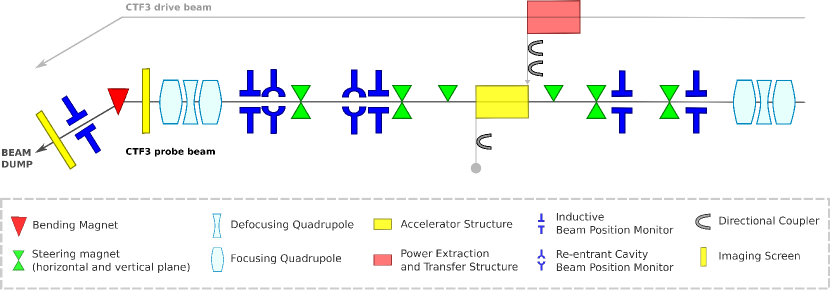
The Two-beam Test Stand consists of two parallel beam lines designed to test power extraction from the CTF3 drive beam in a CLIC prototype Power Extraction and Transfer Structure and its transfer through a waveguide network to a probe beam which is accelerated in a CLIC prototype accelerator structure. Both beam lines consist of a 11 m long straight section ending with a 1.6 m long spectrometer line where the beam energy is measured before the beam dump. Both beam lines are equipped with five inductive beam position monitors Gasior (2003), two upstream and three downstream of each structure, the last one being in the spectrometer line. The probe beam line sketched in Fig. 2 is also equipped with two cavity beam position monitors Simon et al. (2009) downstream of the accelerator structure. They were recently installed to resolve fast changes in the beam position thanks to their bandwidth of 600 MHz centred at a frequency of 6 GHz which makes them insensitive to the low frequency noise visible on the inductive beam position monitor signals.
Both beam lines are equipped with removable imaging screens which are used to measure the beam spot either just before or after the dipole magnet which bends the beam in the spectrometer line. The screen in the spectrometer line of the probe beam is a high sensitivity fluorescent screen whereas at the end of the straight section of the beam line, before the spectrometer, both an optical transition radiation and a scintillating screen Farabolini et al. (2008) are available. The measurements discussed in this paper are based on the latter.
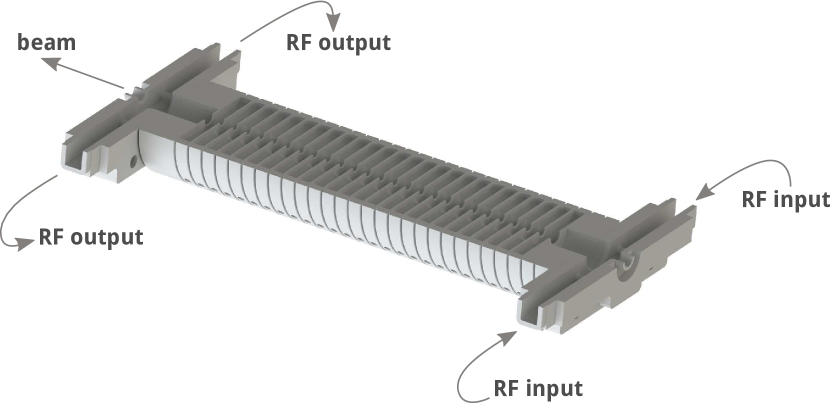
The accelerator structure installed in the beam line is a CLIC prototype. It is a X-band travelling wave resonant structure made of copper. It consists of 24 regular cells, i.e. cells providing nominal field gradient, plus 1 input and 1 output matching cells. The phase advance per cell is . Its total length is 22.77 cm. It has a small aperture and a strong linear tapering - group velocity varies from 1.62% in the first cell to 0.81% of the speed of light in the last cell Grudiev (2010). More specifications are given in Table 2 and a cut-out of a 3D model of the structure is shown in Fig. 3. No high-order modes damping material are installed in this prototype. It is equipped with directional couplers at its input and output ports. Their output signals are sent to diode detectors and IQ demodulators and then calibrated for power and phase measurements.
Every time that a drive beam bunch-train is sent into the PETS it excites electromagnetic radiation peaked at 12 GHz, which is sent to the accelerator structure in the probe beam through a waveguide network. Such a RF pulse is used to accelerate a probe beam bunch-train that is sent into the structure synchronous with the RF. The probe beam is generated in the CALIFES linac and accelerated to an energy of about 180 MeV before entering the Two-beam Test Stand. In this experiment, 148 ns long probe beam bunch-trains were used with a total charge of 10.2 nC or 0.1 nC per bunch. Because we observed slow fluctuations of the energy and orbit of the probe beam over a few-minute time scale, we need to consider relative measurements between accelerated and non-accelerated bunch-trains which are subsequent in time. This can be achieved in the Two-beam Test Stand operating the probe beam at twice the repetition rate of the drive beam. We successfully operated the drive beam up to a repetition rate of 2.5 Hz and the probe beam up to a repetition rate of 5 Hz. This way it was possible to have a RF pulse sent to the accelerator structure every second probe beam pulse and therefore to accelerate every other probe beam bunch-train, with a non-accelerated bunch-train in between.
IV Effect of the acceleration on the beam
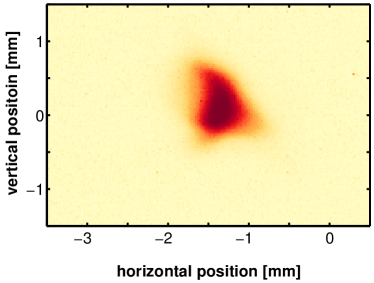
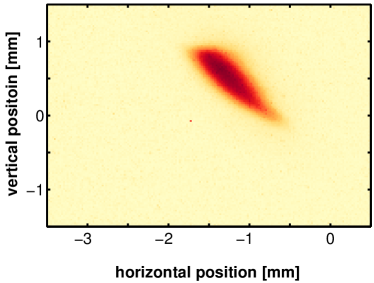
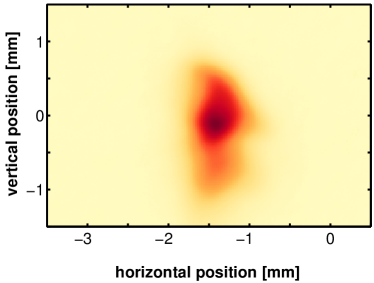
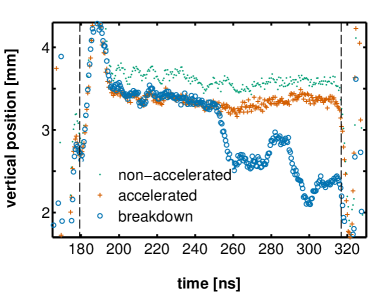
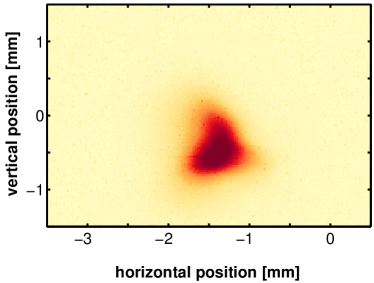
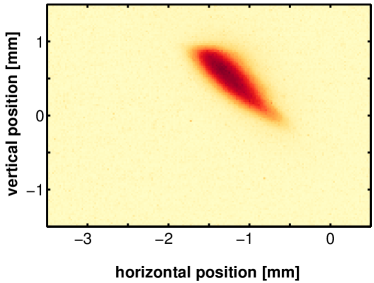
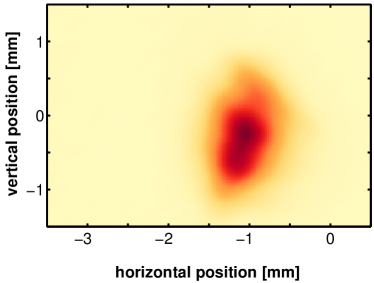
Two representative examples of beam spots measured on the screen installed before the spectrometer line (see Fig. 2) are shown in Fig. 4 and Fig. 4. Both beam spots were measured when neither the quadrupole triplet nor the correctors between accelerator structure and screen were powered, i.e. the beam was following a ballistic trajectory after the accelerator structure. The beam spot in Fig. 4 stems from a bunch-train accelerated in the structure by about 23 MeV whereas the beam spot in Fig. 4 corresponds to a bunch-train non-accelerated. The size of the latter is determined in the CALIFES linac and is about 0.4 mm in both planes throughout this experiment. We observed that the centroids of the two beam spots have different positions and shapes. The centroid position is calculated by means of a fit of a 2D-Gaussian to the beam spot image and is found to differ by mm between the two cases. Such difference was not due to any changes in the incoming beam orbit as the beam centroid measured on the screen was stable within 0.13 mm from pulse to pulse. In Fig. 4 we show the beam position measured by the cavity beam position monitor installed just before the imaging screen. The two upper-most signals correspond to the bunch-trains whose spot is shown in Fig. 4 and Fig. 4, the accelerated one at the top and the non-accelerated one in the middle. The signal at the bottom corresponds to a breakdown and is discussed in Sec. V. The accelerated and non-accelerated positions are about 0.26 mm apart on the vertical plane whereas their shift is negligible on the horizontal plane. Given the distances of the screen and the cavity beam position monitor from the accelerator structure of 5 m and 3.4 m respectively, the different beam position measured with the beam position monitor should correspond to a difference of mm between the position of the beam centroids measured on the screen, which is in agreement with what was measured. In other words, the beam was always kicked vertically by about 0.07 mrad whenever it was accelerated. Such kick corresponds to a momentum of about 13 keV/c for a beam energy of 180 MeV. Such effect is consistent with a misalignment of the accelerator structure with respect to the rest of the beam line. Given a total energy gain of 23 MeV in the 23 cm long accelerator structure, a tilt of mrad would correspond to a displacement of m which is consistent with the mechanical accuracy of the alignment of the structure in the beam line Riddone (2012). It is worth noting that even if the beam could be steered on an orbit which was stable irrespective whether the beam was accelerated or not, we chose to maintain the shift between accelerated and non-accelerated positions. That permits an indirect measurement of the beam energy change, even if it introduces a bias in the measurement of transverse breakdown kicks as discussed in sec. V.
Beyond the position of the centroids of the two beam spots in Fig. 4 and Fig. 4, we also observed that both their shapes and orientations are different. First of all it is worth noting that the beam spot corresponding to the non-accelerated bunch-train in Fig. 4 is elliptical and tilted, which indicates coupling between the horizontal and the vertical plane. This coupling is caused by the solenoids surrounding the CALIFES accelerator structures to provide transverse focusing when the beam is generated and accelerated before being sent to the Two-beam Test Stand. On the other hand, no solenoidal field is present in the Two-beam Test Stand therefore we attribute the change in size and orientation of the accelerated bunch-train to the field in the structure. If we consider that the beam size of the accelerated beam spot measured on the screen is almost doubled with respect to the non-accelerated one, such change can be accounted for by a defocusing quadrupole with a focal length of 5 m. This effect can be explained if we consider that a quadrupolar component of the fundamental accelerating mode is present in both the input and output couplers of the accelerating structure due to their symmetry which is broken by the presence of two feeding waveguides. Moreover the symmetry of all the cells in the accelerator structure is broken by the presence of wakefield damping waveguides such that there an octupolar component of the fundamental mode is introduced. The integrated strength of such additional multipolar modes were calculated for a CLIC baseline accelerator structure Grudiev et al. (2012) and resulted in T integrated throughout the input and output couplers and Tm-2 integrated throughout all regular cells of the accelerator structure. For a beam energy of 180 MeV the quadrupolar field component contributes with a focal length of about 30 m, which is not enough to explain our observation. On the other hand, the slope of octupolar field component in the regular cells at a beam offset of 200 m in the structure produces a quadrupolar effect with a focal length of about 5 m. Thus the effect of the octupolar mode in the regular cells of the accelerator structure can account for the observed focusing effect.
V Evidence for breakdown effects on the beam
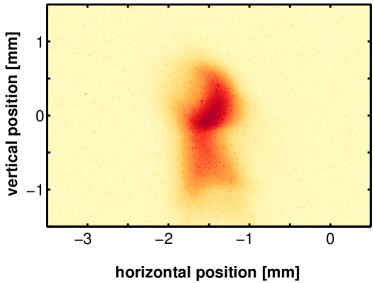
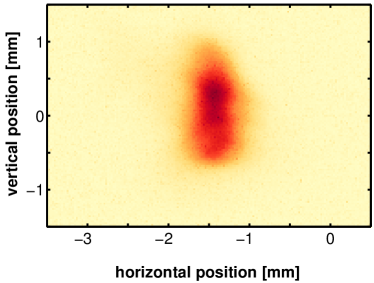
When a RF breakdown occurred in the accelerator structure while the beam was accelerated, we often observed a beam spot like the one shown in Fig. 4. Such spot must be compared with the two immediately preceding accelerated and non-accelerated beam spots in Fig. 4 and Fig. 4, respectively. A second spot is visible in Fig. 4 below the original spot, which we explain as resulting from part of the bunch-train receiving a transverse momentum in correspondence of the breakdown location in the structure, and therefore travelling on a different orbit and hitting the screen in a different position. To verify that such a secondary spot was part of the beam, we recorded images of discharge currents reaching the screen without beam. This always resulted in low intensity images of breakdown current spread over a wide portion of the screen. Therefore discharge currents could be distinguished in every case from the beam and they can be excluded as possible source of secondary spots detected in breakdown events. The explanation offered for the appearance of a second beam spot is supported by the measurements of the beam position on a nano-second time scale with the cavity beam position monitor installed just before the imaging screen, as shown in Fig. 4. The position of the first part of the bunch-train - from 180 ns to 250 ns - is the same of the position of an accelerated bunch-train when no breakdown happens in the accelerator structure, i.e. it gets fully accelerated. Afterwards the position shifts in about 10 ns vertically downwards by about 0.75 mm. It oscillates for the remaining length of the bunch-train but it never shifts back to its initial position. It is worth noting that the overshoot visible at the beginning of the signal is due to the read-out electronics and that it is not related to the beam position. Moreover it is a feature observed in all the signals read-out from the cavity beam position monitors in the beam line. Therefore if we disregard the first 20 ns of such signals, we can identify two main trajectories, the first one corresponding to the fully accelerated beam and the second one corresponding to the beam affected by the breakdown. These two positions will result in two distinct spots on the imaging screen. The position of such spots is calculated as the distance between the two maxima of the sum of two 2D-Gaussian fitted to the beam image and is 1.1 mm in Fig. 4. Given the distance of the screen and the cavity beam position monitor from the accelerator structure, the distance between the two spots measured on the screen corresponds to the shift of the beam position measured by the beam position monitor in Fig. 4 and it is mm.
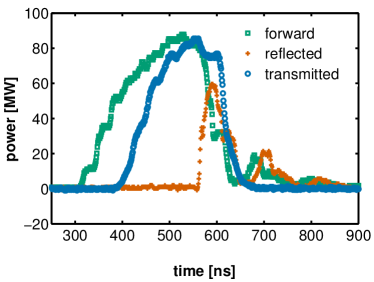
A further indication that the rapid deviation of the beam position measured on the screen and with a beam position monitor is correlated with a RF breakdown in the accelerator structure is given by the RF measurement shown in Fig. 4. Such measurements, corrected for the ohmic losses in the accelerator structure and the waveguides, show that almost 100% of the power fed into the accelerator structure is reflected backwards. The time at which the reflection is measured is consistent with the time at which the beam position recorded by the beam position monitor starts changing.
VI Breakdown scenarios
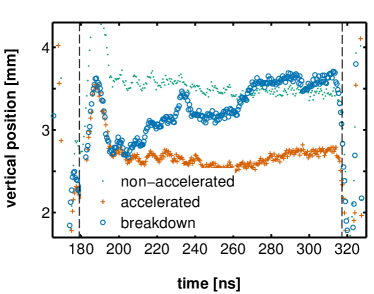
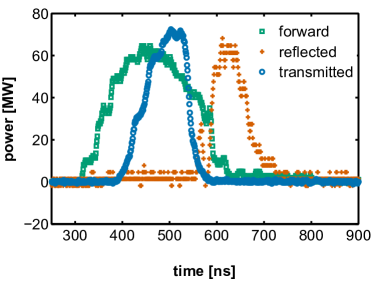
The RF breakdowns measured during this experiment have different characteristics and in addition to the breakdown in Fig. 4 discussed in sec. V, we discuss here two particular cases to illustrate other breakdown scenarios. The plot in Fig. 5 shows a case in which the beam is accelerated for about 20 ns until its vertical position drifts upwards over about 65 ns and finally remains consistent with the position of a non-accelerated bunch-train. The 65 ns drift time of the accelerated position towards the non-accelerated corresponds to the filling time of the accelerator structure. This suggests the following explanation: the first 20 ns of the bunch-train are fully accelerated and then a breakdown happens close to the input port of the accelerator structure. From that moment on, most of the power fed to the structure is reflected backwards and therefore the power which fills the accelerator structure flows towards its output port in 65 ns until the accelerator structure is left almost completely empty. The beam which in the meantime is still travelling in the accelerator structure is less and less accelerated therefore its position slowly drifts towards the position of a non-accelerated bunch-train. Because of the small group velocity in the accelerator structure - from 1.6% to 0.8% of the speed of light - we can estimate the location of the breakdown in the accelerator structure by comparing power measurements at the input and output directional couplers (see Fig. 2). For the breakdown event in Fig. 5 we estimated the breakdown to be localised in the sixth cell of the structure, therefore close to its input port. Moreover the RF measurements for this event in Fig. 5 show that almost 100% of the RF fed to the accelerator structure is reflected backwards and that the amount of power that leaks through the breakdown location drops in about 10 ns down to 50% of the input power, and then down to zero during the following 50 ns. Already at 50% of the input power the acceleration is reduced by a factor which is consistent with the drift of the beam position from the accelerated to the non accelerated one as shown by the beam position monitor signal in Fig. 5.
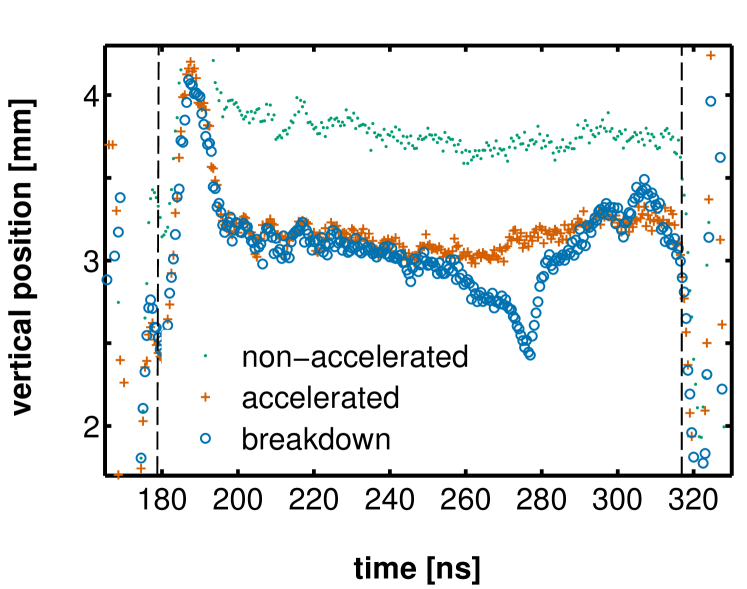
A second breakdown scenario is shown in Fig. 6 where the beam position measured with a cavity beam position monitor has a dip in correspondence of a breakdown which lasts for about 20 ns. In this case, during the breakdown the beam is pushed away from the non-accelerated one as it was the case for the breakdown shown in Fig. 5, suggesting that little or no contribution comes from lack of accelerating gradient after the breakdown location or that the breakdown happened towards the output port of the accelerator structure. The estimation of the breakdown location based on RF measurements supports indeed the latter hypothesis, i.e. that the breakdown happened in the last cell of the accelerator structure.
To test the explanation that we offered to describe a breakdown in the accelerator structure and its effect on the beam orbit and energy, we try to predict how the beam spot looks like on the imaging screen for the breakdown shown in Fig. 4 and Fig. 5. According to what discussed above, we expect the breakdown beam spot to be a mixture of both the non-accelerated and the accelerated beam spots. When the bunch-train is fully accelerated in the accelerator structure its spot corresponds to an unperturbed accelerated beam spot, whereas after a breakdown we expect it to be a mixture of accelerated and non-accelerated spots according to the proximity of the beam to the accelerated or non-accelerated positions, respectively. In other words, the breakdown spot can be expressed by a linear combination of the accelerated and of the non-accelerated beam spots, whose coefficients at a given time along the bunch-train are derived from the beam position monitor measurements, according to the beam position. The results obtained are shown in Fig. 4 Fig. 5. We want to stress that the displacement of the beam position in case of a RF breakdown can be due to two different effects, the lack of power in the structure due to its reflection and the direct effect of the breakdown on the beam. When both affect the beam position in the same direction the two effects cannot be disentangled unless we use the beam position monitor in the spectrometer line, which is obscured by the screen used in our measurements.
VII Statistics
The analysis described in sec. V and sec. VI for three selected breakdowns has been applied to a bigger data set of 246 breakdowns. Accelerating gradient and missing energy calculated for those events are shown in Fig. 7.
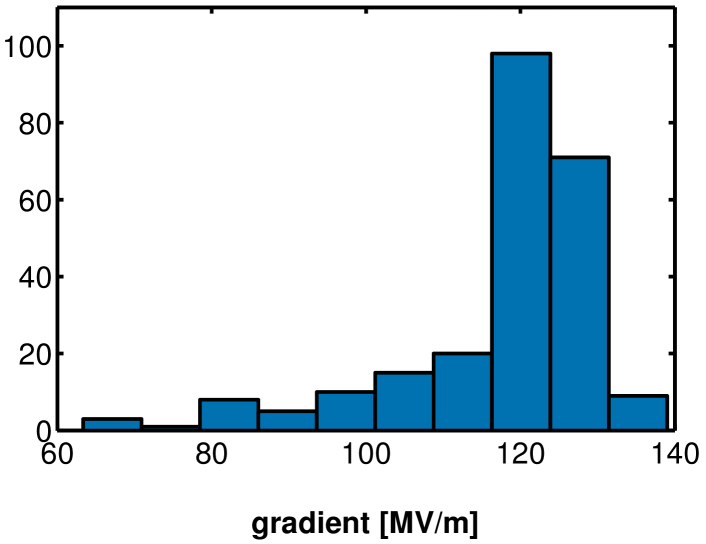
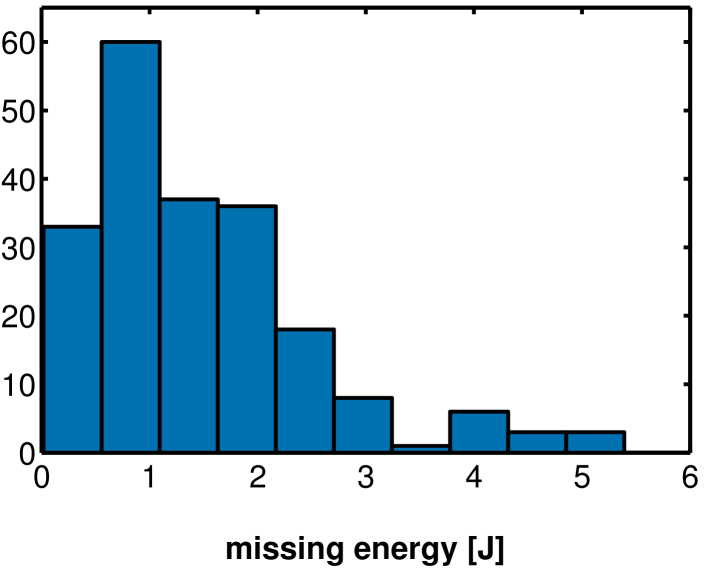
The accelerating gradient is calculated from the measurement of RF power fed to the accelerator structure, given that the nominal power required to have an average unloaded gradient of 100 MV/m is 46.5 MW (see Table 2). The energy absorbed in each breakdown is calculated as the difference between the energy fed to the structure and the energy transmitted to the structure output plus the energy reflected to the structure input. Attenuation due to ohmic losses is taken into account. The histogram in Fig. 8 shows the distribution of the total angular magnitude of transverse kicks to the beam orbit, whose average magnitude is mrad or keV/c. As discussed in sec.VI, this estimation is biased by the effect of the transverse beam acceleration due to the misalignment of the accelerator structure and the beam orbit. Nevertheless, from the analysis of only the non breakdown events we deduce that the maximum magnitude of such effect is about one third of the average magnitude of the kick distribution presented in Fig. 8. In other words the distribution in Fig. 8 represents mainly the effect of breakdown kicks, because the contribution of acceleration kicks is smaller than 30%.
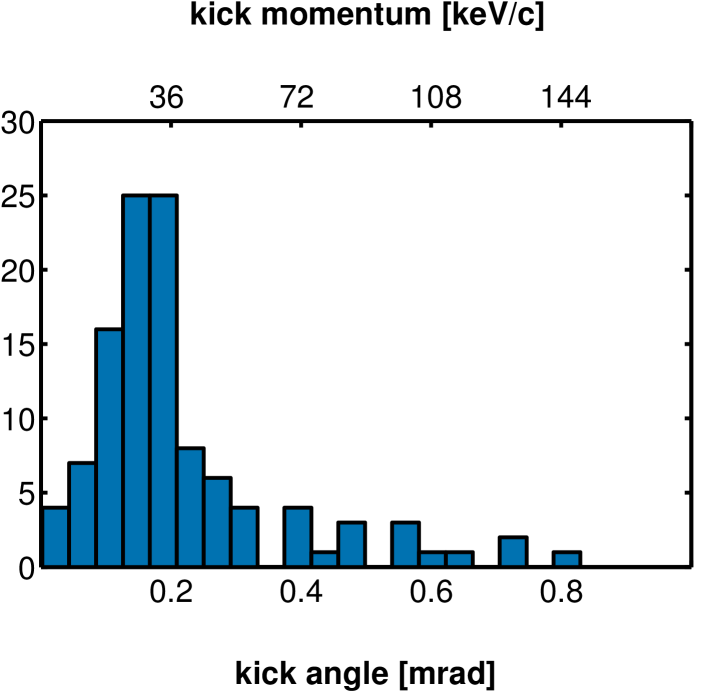
Finally, we looked for correlations between the magnitude of the kick angle and the location of the breakdown in the accelerator structure or the energy dissipated in the breakdown. None of these correlations is statistically significant.
VIII Conclusions
We measured evidence of the effect of RF breakdown on the Two-beam test Stand probe beam accelerated in a CLIC prototype structure. The position of bunch-trains accelerated in the presence of a breakdown in the accelerator structure, showed transverse displacement which we explain as resulting from part of the bunch-train receiving a transverse momentum in correspondence of the breakdown location, and therefore travelling on a different orbit. Both parts of such bunch-trains were also intercepted and measured on a scintillating screen where they resulted in two distinct spots whose distance is compatible with the position measured with the beam position monitors in the beam line. We refer to this transfer of transverse momentum to the beam as RF breakdown kick and we observed that it does not depend on the amount of power dissipated by a breakdown nor on the location at which a breakdown takes place. We measured and discussed different examples of such kicks which suggest different scenarios according to specific breakdown strength, duration and location in the accelerator structure.
Furthermore we observed another source of transverse kicks to the beam orbit which overlaps with the kicks given by breakdown. Such kick was found to be accountable to a misalignment between the beam orbit and the axis of the accelerator structure, and it always had a well defined magnitude and direction. It represents a bias in the measurements of breakdown kicks though, which was not possible to subtract. Nevertheless it provided an indirect measurement of the beam energy during a breakdown, which we did not measure directly due to the low resolution of the beam position monitor in the spectrometer line.
The average magnitude of transverse kicks to the beam measured in this experiment is of keV/c in terms of transverse momentum transferred to the beam, or mrad in terms of the angle given to the 180 MeV probe beam. We consider as worst case scenario the case in which only RF breakdown contribute to the measured kicks because such kicks cannot be avoided. The worst place where a breakdown kick can happen in CLIC is at the beginning of the main linac where the beam energy is 9 GeV. For such energy a transverse kick of 29 keV/c corresponds to a kick angle of about 4 rad. It is worth noting that such angle is one order of magnitude bigger than the nominal CLIC beam divergence of about 0.3 rad, assuming a vertical normalised emittance of 10 nm mrad and a beta function of 10 m at the beginning of the main linac.
On the basis of our observations we suggested an explanation of how the beam energy is affected by a breakdown, due to the reflection of power at the breakdown location and the resulting change of the net acceleration in the accelerator structure. We offered a model to predict how the beam spot looks like in case of a breakdown, starting from measurements of breakdown beam position and non-breakdown beam spots. The result approximates the measurement although a more complete model which takes into account the phase of the reflected power might help achieving increased agreement with the measurements.
Our interpretation of the observed kicks are magnetic fields generated by high currents produced in the structure during a breakdown. In order to estimate the order of magnitude of the currents and fields we assume that an arc is established between two adjacent irises, where the electric fields assume their extreme values. According to Ampere’s law, a current of 250 A causes a magnetic field of mT in the centre of the structure whose radius is 3.1 mm. This field acts on the beam over the distance mm between irises and thus causes a deflection on the beam of mrad where Tm is the rigidity of the 180 MeV electron beam. We conclude that a current of a few 100 A between adjacent irises is consistent with the observed deflection.
Acknowledgements.
The authors would like to acknowledge the support of the CTF3 operations team. Especially we like to acknowledge the support of D. Gamba and A. Dubrovskiy for data acquisition related issues. This work is supported by the 7th European Framework program EuCard under Grant number 227579, the Knut and Alice Wallenberg foundation and the Swedish Research Council.References
- Aicheler et al. (2012) M. Aicheler, P. Burrows, M. Draper, T. Garvey, P. Lebrun, K. Peach, N. Phinney, H. Schmickler, D. Schulte, and N. Toge, A Multi-TeV linear collider based on CLIC technology: CLIC Conceptual Design Report, Tech. Rep. CERN-2012-007, SLAC-R-985, KEK-Report-2012-1, PSI-12-01, JAI-2012-001 (Geneva, 2012).
- Furuta et al. (2006) F. Furuta, K. Saito, T. Saeki, H. Inoue, Y. Morozumi, T. Higo, Y. Higashi, H. Matsumoto, S. Kazakov, H. Yamaoka, Y. Ueno, K. Kobayashi, R. S. Orr, and J. Sekutowicz, “Experimental comparison at KEK of high gradient performance of different single cell superconducting cavity designs,” in Proceedings of EPAC 2006, Edinburgh, Scotland (2006) pp. 750–752.
- Grudiev (2010) A. Grudiev, “RF design and parameters of 12 GHz TD24_vg1.8_disk,” The CERN EDMS (2010), edms.cern.ch/file/1070498/1/.
- Dolgashev et al. (2004) V. A. Dolgashev, K. L. F. Bane, G. Stupakov, J. Wu, and T. O. Raubenheimer, “Effect of dark currents on the accelerated beam in an x-band linac,” in Proceedings of EPAC 2004, Lucerne, Switzerland (2004) pp. 2203 –2205.
- Dolgashev and Tantawi (2001) V. A. Dolgashev and S. G. Tantawi, “Simulations of currents in X band accelerator structures using 2-D and 3-D particle in cell code,” in Proceedings of the 2001 Particel Accelerator Conference, Chicago (2001) pp. 3807–3809.
- Bane et al. (2005) K. L. F. Bane, V. A. Dolgashev, T. Raubenheimer, G. V. Stupakov, and J. H. Wu, “Dark currents and their effect on the primary beam in an X-band linac,” Phys.Rev.ST Accel.Beams 8, 064401 (2005).
- Adolphsen (2005) C. Adolphsen, “Advances in Normal Conducting Accelerator Technology from the X-Band Linear Collider Program,” in Proceedings of PAC 2005, Knoxville, Tennessee (2005) pp. 204 – 208.
- Dolgashev and Raubenheimer (2004) V. A. Dolgashev and T. Raubenheimer, “Simulation of rf breakdown effects on NLC beam,” in 22nd International Linear Accelerator Conference, Lubeck, Germany (2004) pp. 396 – 398.
- Ruber et al. (2008) R. J. M. Y. Ruber, V. G. Ziemann, H. H. Braun, S. Doebert, T. J. C. Ekelof, G. Geschonke, M. Johnson, G. Riddone, J. P. H. Sladen, I. Syratchev, and W. Wuensch, “The CTF3 Two-beam Test-stand installation and experimental program,” in Proceedings of EPAC08, Genoa, Italy (2008) pp. 2821 – 2823.
- Geschonke and Ghigo (2002) G. Geschonke and A. Ghigo, CTF3 Design Report, Tech. Rep. CERN-PS-2002-008-RF, CTF-3-NOTE-2002-047, LNF-2002-008-IR (CERN, Geneva, 2002) revised version number 1.
- Adli et al. (2011) E. Adli, R. Ruber, V. Ziemann, R. Corsini, A. Dubrovskiy, and I. Syratchev, “X-band rf power production and deceleration in the Two-beam Test Stand of the Compact Linear Collider test facility,” Phys. Rev. ST Accel. Beams 14, 081001 (2011).
- Farabolini et al. (2010) W. Farabolini, D. Bogard, A. Curtoni, P. Girardot, F. Peauger, C. S. Simon, E. Chevallay, M. Divall Csatari, N. Lebas, M. Petrarca, A. Palaia, R. J. M. Y. Ruber, and V. G. Ziemann, “CTF3 Probe Beam LINAC Commissioning and Operations,” in Proceedings of Linear Accelerator Conference LINAC2010, Tsukuba, Japan (2010).
- Mosnier et al. (2006) A. Mosnier, M. Authier, D. Bogard, A. Curtoni, O. Delferriere, G. Dispau, R. Duperrier, W. Farabolini, P. Girardot, M. Jablonka, J. Jannin, M. Luong, R. Nelly, F. Peauger, and R. Roux, “The probe beam linac in CTF3,” in Proceedings of EPAC 2006, Edinburgh, Scotland (2006) pp. 679 – 681.
- Ruber (2010) R. Ruber, “CLIC feasibility demonstration at CTF3,” in Proceedings of Linear Accelerator Conference LINAC2010, Tsukuba, Japan (2010) pp. 36 – 40.
- Skowroński et al. (2011) P. K. Skowroński, J. Barranco, S. Bettoni, B. Constance, R. Corsini, M. Divall Csatari, A. E. Dabrowski, S. Doebert, A. Dubrovskiy, O. Kononenko, M. Olvegaard, T. Persson, A. Rabiller, F. Tecker, W. Farabolini, R. L. Lillestol, E. Adli, A. Palaia, and R. Ruber, “The CLIC feasibility demonstration in CTF3,” in Proceedings of IPAC2011, San Sebastian, Spain (2011) pp. 1042 – 1044.
- Gasior (2003) M. Gasior, “An inductive pick-up for beam position and current measurements,” in 6th European Workshop on Beam Diagnostics and Instrumentation for Particle Accelerators, Mainz, Germany (2003) pp. 53 – 56.
- Simon et al. (2009) C. Simon, D. Bogard, and M. Luong, “Instrumentation for high frequency cavity BPM in CALIFES,” in Proceedings of PAC09, Vancouver, BC, Canada (2009) pp. 3497 – 3499.
- Farabolini et al. (2008) W. Farabolini, G. Adroit, P. Girardot, R. Granelli, F. Harrault, et al., “Video Profile Monitors Development for the CTF3 Probe Beam Linac,” in Proceedings of EPAC08, Genoa, Italy (2008) pp. 1101 – 1103.
- Riddone (2012) G. Riddone, private communication (2012).
- Grudiev et al. (2012) A. Grudiev, A. Latina, and D. Schulte, “Study of Fundamental Mode Multipolar Kicks in Double- and Single-feed Power Couplers for the CLIC Main Linac Accelerating Structure,” in Proceedings of IPAC2012, New orleans, Louisiana, USA (2012) pp. 3081–3083.