Galaxy pairs in the Sloan digital sky survey - VII: The merger – luminous infra-red galaxy connection.
Abstract
We use a sample of 9397 low redshift () galaxies with a close companion to investigate the connection between mergers and luminous infra-red (IR) galaxies (LIRGs). The pairs are selected from the Sloan Digital Sky Survey (SDSS) and have projected separations 80 kpc, relative velocities V 300 km s-1 and stellar mass ratios within a factor 1:10. A control sample consisting of 4 galaxies per pair galaxy is constructed by simultaneously matching in stellar mass, redshift and environment to galaxies with no close companion. The IR luminosities (LIR) of galaxies in the pair and control samples are determined from the SDSS – Infra-red Astronomical Satellite (IRAS) matched catalog of Hwang et al. (2010). Over the redshift range of our pairs sample, the IRAS matches are complete to LIRG luminosities (LIR L⊙), allowing us to investigate the connection between mergers and luminous IR galaxies. We find a trend for increasing LIRG fraction towards smaller pair separations, peaking at a factor of 5–10 above the median control fraction at the smallest separations ( kpc), but remaining elevated by a factor 2–3 even out to 80 kpc (the widest separations in our sample). LIRG pairs predominantly have high star formation rates (SFRs), high extinction and are found in relatively low density environments, relative to the full pairs sample. We also find that LIRGs are most likely to be found in high mass galaxies which have an approximately equal mass companion. We confirm the results of previous studies that both the active galactic nucleus (AGN) fraction and merger fraction increase strongly as a function of IR luminosity. About 7% of LIRGs are associated with major mergers, as defined within the criteria and mass completion of our sample. Finally, we quantify a SFR offset (SFR) as the enhancement (or decrement) relative to star-forming galaxies of the same mass and redshift. We demonstrate that there is a clear connection between the SFR and the classification of a galaxy as a LIRG that is mass dependent. Most of the LIRGs in our merger sample are relatively high mass galaxies (log (M⋆/M⊙) ), likely because the SFR enhancement required to produce LIRG luminosities is more modest than at low masses. The SFR offers a redshift-independent metric for the identification of the galaxies with the most enhanced star forming rates that does not rely on fixed LIR boundaries.
keywords:
Galaxies: interactions, infrared: galaxies, galaxies: active1 Introduction
The total far infra-red (IR) luminosity (LIR), which is defined as the bolometric contribution from 8-1000 m, of a galaxy is closely tied to its star formation rate (SFR). The correlation is due to the processing of UV photons by galactic dust, which are re-emitted in the thermal spectrum (see, for example, the reviews on galactic star formation by Kennicutt 1998; Kennicutt & Evans 2012). There can be additional contributions to LIR from an active galactic nucleus (AGN). However, most studies find that for the general population, the AGN contribution to the total LIR is modest, at about 10–20%, although the AGN contribution can become dominant at the highest far-IR luminosities (Nardini et al. 2010; Yuan, Kewley & Sanders 2010; Petric et al. 2011; Lee et al. 2012).
Based on the two mechanisms for IR emission, it can be easily appreciated why mergers provide a fertile environment for high IR luminosities. It is well documented that mergers have, on average, enhanced SFRs relative to isolated counterparts (e.g. Kennicutt et al. 1987; Barton, Geller & Kenyon 2000; Bergvall et al. 2003; Lambas et al. 2003; Nikolic, Cullen & Alexander 2004; Alonso et al. 2004, 2006; Li et al. 2008; Ellison et al. 2008, 2010; Woods et al. 2010; Darg et al. 2010a; Patton et al. 2011). Although typical SFR enhancements are a factor of a few at both low and high redshift (Robaina et al. 2009; Wong et al. 2011), a minority of galaxies can have SFR enhancements of a factor of ten or more (Scudder et al. 2012). Interactions can also lead to nuclear activity, triggering AGN over a wide variety of energies from Seyferts to quasars (Kennicutt et al. 1987; Ramos-Almeida et al. 2011, 2012; Canalizo & Stockton 2001; Ellison et al 2011b; Silverman et al. 2011; Koss et al. 2012). It is therefore not surprising that pairs also show increased LIR and that interactions can contribute significantly to the IR luminosity (e.g. Lonsdale, Persson & Matthews 1984; Kennicutt et al 1987; Telesco, Wolstoncroft & Done 1988; Xu & Sulentic 1991; Xu et al. 2000; Hernandez Toledo, Dultzin-Hacyan, & Sulentic 2001; Bridge et al. 2007; Smith et al. 2007; Hwang et al. 2010, 2011).
At the highest IR luminosities, galaxies are classified as luminous IR galaxies (LIRGs) and ultra-luminous IR galaxies (ULIRGs) when their total far-IR luminosities are log (LIR/L⊙) and log (LIR/L⊙) 12 respectively (see Sanders & Mirabel 1996 and Veilleux et al. 2002 for reviews). It is well known that, at least at low redshift, the vast majority of ULIRGs are mergers, with recent work suggesting that mergers may also contribute significantly to ULIRGs at high (e.g. Dasyra et al. 2008; Kartaltepe et al. 2010, 2012). As the LIR decreases, so does the fractional contribution from mergers (e.g. Kartaltepe et al. 2010), such that at log (LIR/L⊙) = 11.5 about 20% of LIRGs are major mergers. Moreover, at fixed LIR, there is an increasingly important contribution from mergers at lower redshifts (Melbourne, Koo & Le Floc’h 2005; Wang et al. 2006). However, not all mergers lead to such prodigious IR emission. Statistically this is obvious from the comparison of the ULIRG space density of Mpc-3 at low redshift (Kim & Sanders 1998), compared to the space density of mergers (e.g. Chou, Bridge & Abraham 2011) which is 3 orders of magnitude higher.
In this paper, we study the IR properties of a large sample of low redshift close pairs in order to further investigate the connection between high LIR and mergers. Whilst the fraction of LIRGs that are mergers has been previously quantified, the fraction of mergers that result in LIRGs is not well constrained. How frequently does a merger result in a LIRG, and can we identify which mergers are most conducive to LIRG production? We also compare the properties of the LIRGs in close galaxy pairs with LIRGs in our control sample, in order to understand whether merging plays a special role in LIRG production, or whether interactions are simply one pathway to prodigious IR emission.
We adopt a cosmology of , , km/s/Mpc.
2 Sample selection
2.1 Infra-red selection
The study presented here combines a spectroscopically selected sample of pairs from the Sloan Digital Sky Survey (SDSS) with IR luminosities obtained from the Infra-red Astronomical Satellite (IRAS). IRAS surveyed the sky in four bands at 12, 25, 60 and 100 m. Hwang et al. (2010, hereafter H10) matched the IRAS Faint Source Catalogue (FSC), which contains 173, 044 IR sources at deg with the SDSS data release (DR) 7. H10 require that IRAS sources must have robust detections at 60 m, but no requirements are placed on detections in the other bands. Bolometric IR luminosities are calculated by H10 via spectral energy distribution (SED) fits to the templates of Chary & Elbaz (2001) at 60 and (where available) 100 m. Hwang et al. (2010) show that IRAS 60 m only determinations of LIR agree well with those derived from 60+100 m SED fits, with a scatter of only 0.08 dex (see also Zhu et al. 2008).
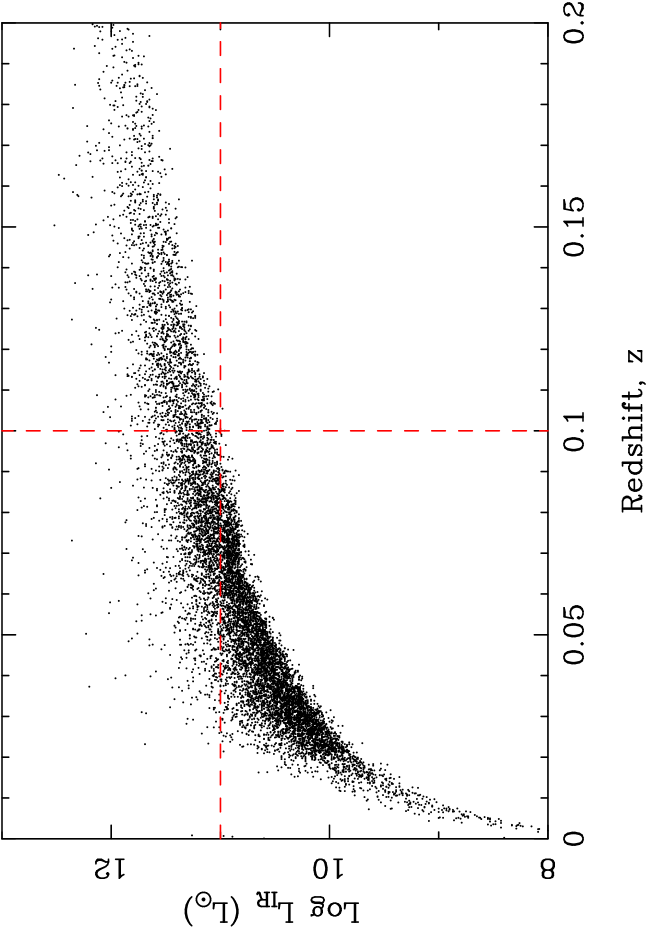
One of the main goals of this work is to study the properties and frequency of LIRGs in our galaxy pair sample. Figure 1 shows the distribution of redshift and LIR for galaxies in the H10 catalog, and demonstrates the increasing incompleteness at small LIR at larger distances. In order to be complete down to the limiting LIRG luminosity (log (LIR/L⊙) 11), we impose a redshift cut .
2.2 Close pairs sample
We select a sample of close galaxy pairs from the subset of galaxies in the SDSS DR7 whose extinction-corrected -band Petrosian magnitudes are in the range 14.0 17.77. For all galaxies, we compute local environmental densities, :
| (1) |
where is the distance in Mpc to the nearest neighbour within 1000 km s-1. Normalized densities, , are computed relative to the median within a redshift slice 0.01. We further restrict the parent sample to have a redshift range of 0.01 0.1. The lower redshift cut ensures cosmological values and the upper redshift cut ensures H10 catalog completeness for LIRGs. From this parent sample, close galaxy pairs are selected that fulfill the following criteria:
-
1.
A projected physical separation 80 kpc.
-
2.
A line of sight velocity difference V 300 km s-1, in order to minimize chance projections.
-
3.
A stellar mass ratio of 0.1 M1/M2 10, as determined by Mendel et al. (2013)111In this paper, we consider the mass ratio to be a property of an individual galaxy, rather than the pair as a whole. That is, the mass ratio is the mass of a galaxy relative to its companion. This approach allows us to distinguish between the more (M1/M) and less (M1/M) massive galaxy in a pair..
-
4.
A normalized local density estimator 75, i.e. the local density must be no more than 75 times more than the median density in a redshift slice of 0.01 around the galaxy. This criterion is imposed so that an adequate number of controls can be matched to the pairs sample, see below.
The pair selection described above is very similar to that which we have used in previous papers (e.g. Patton et al. 2011), but with recently re-calculated (bulge+disk) masses from Mendel et al. (2013). As shown in Simard et al. (2011) and Patton et al. (2011), the SDSS pipeline photometry, which is used to determine masses through spectral energy distribution (SED) fitting, can be seriously affected by the presence of a close companion. Mendel et al. (2013) have performed a thorough re-assessment of masses for the full spectroscopic SDSS DR7 using the improved (contamination-corrected) photometry of Simard et al. (2011). The star formation rates used in this paper are the ‘total’ (aperture-corrected) values determined from the SDSS spectra (Brinchmann et al. 2004; Salim et al. 2007). The star formation rates are determined through a Bayesian fitting procedure that uses spectral energy distribution models with a range of input parameters. For star-forming galaxies, the SFRs are essentially constrained using the strong Balmer emission lines, which agree well with UV measurements (Brinchmann et al. 2004; Salim et al. 2007). Aperture corrections are performed based on a colour dependent term of the light outside of the fibre region, as described in Brinchmann et al. (2004).
The final step in the compilation of the pairs sample is a correction for incompleteness at small angular separations due to fibre collisions. The relative excess of galaxies at wider separations (where the completeness rapidly increases) can be corrected by culling random pairs from the spectroscopic sample. This culling procedure randomly excludes 67.5% of pairs at angular separations 55 arcseconds and has been shown in our previous work to effectively remove any bias in pair properties as a function of projected separation (e.g. Ellison et al. 2008, 2011b; Scudder et al. 2012). Of the 9397 galaxies in a pair which fulfill all of our selection criteria and pass the cull, 400 are matched in the H10 catalog, which associates the closest SDSS counterpart to the IRAS detection.
Since the size of the IRAS beam is much larger than the galaxy-galaxy separations in our pairs, the LIR recorded in the H10 catalog is the sum of the two galaxies. We discuss in Section 3.1 how we account for this in terms of classifying individual galaxies as LIRGs. More fundamentally, we can ask whether the galaxy-galaxy blending of IR flux is systematic for all the pairs in our sample, or whether some pairs will be resolved by the IRAS beam, introducing a separation dependent effect. The size of the IRAS beam is 5 arcmin, 15 arcmin, 25 arcmin and 45 arcmin at 12, 25, 60 and 100 m respectively. Most (95%) of our pair galaxies rely solely on the 60 m flux, so we will consider the effective IRAS beam size for the determination of LIR to be 25 arcmin. 97.6% of our pairs sample have angular separations less than 2 arcminutes and 99.6% have separations less than 3 arcminutes. Therefore, for the vast majority of our pairs the total IR flux of the two galaxies is in the single beam. The LIR measurements therefore consistently include the IR flux from both members of a pair222More recent IR satellites offer an improved spatial resolution, ranging from a few, to a few tens of arcseconds. However, without a careful treatment of deblending, the photometry of close pairs ( 20 kpc) can be still severely affected by near neighbour contamination in imaging at arcsecond resolution (e.g. Simard et al. 2011; Patton et al 2011). It is therefore more straighforward to deal with the fully blended IRAS images, than with images that exhibit a ‘sliding scale’ of contamination as a function of projected separation..
2.3 Control sample
A matched control sample is an important component of understanding the differential changes that occur in galaxies during the merger process (e.g. Perez et al. 2009). The sample of galaxies from which we construct our control is initially all galaxies which have no close spectroscopic companion within a projected separation of 80 kpc and with relative velocity less than 10,000 km s-1. However, due to the spectroscopic incompleteness of the SDSS, this ‘control pool’ will still contain some truly interacting galaxy pairs for which only one (or neither) of the galaxies has a measured redshift. In order to remove contaminating mergers from the control pool, we make use of the visual classifications presented by the Galaxy Zoo project (Lintott et al. 2008). Darg et al. (2010b) describe the identification of a merger sample from the Galazy Zoo, where they use an initial cut of the weighted merger vote fraction, , followed-up by further visual confirmation. Although this vote fraction cut leads to a relatively pure merger sample, and allows a practical starting point for visual confirmation, Darg et al. (2010b) note that the first signs of visible disturbance can occur in galaxies with as low as 0.2. Moreover, our own visual inspection of low galaxies reveals that many galaxies with may not be strongly disturbed, but can still have a close companion (indeed, we have close pairs in our spectroscopic sample with similarly low ), although the companion tends to be faint relative to the main galaxy. We hence conservatively exclude all galaxies with a non-zero from our control pool, which reduces its size from 594,645 to 421,936 galaxies.
The control sample used in this work is matched to the pairs sample simultaneously in mass, and environment (local normalized galaxy density, ). In previous work, we have taken an iterative approach of matching the best control galaxy without replacement until the control distributions are no longer consistent with the pairs (e.g. Scudder et al. 2012). This approach typically yields 10–12 matches per pair galaxy; a similar number is achieved for large samples that have their control samples only matched in mass and redshift (e.g. Patton et al. 2011). However, for a large pairs sample, matching on three parameters yields only a small number (1 or 2) of controls before the statistical comparison fails. The failure is usually in the distribution of densities; a small number of pairs with atypically high local densities have few possible matches amongst the controls. We therefore include a maximum density threshold in the pair selection criteria (Section 2.2) of 75 times the local median. This excludes only 2.5% of pairs333As we show in Section 3.2.2, most IRAS detected galaxies are in relatively low density environments., but allows us to match 4 controls per pair galaxy.
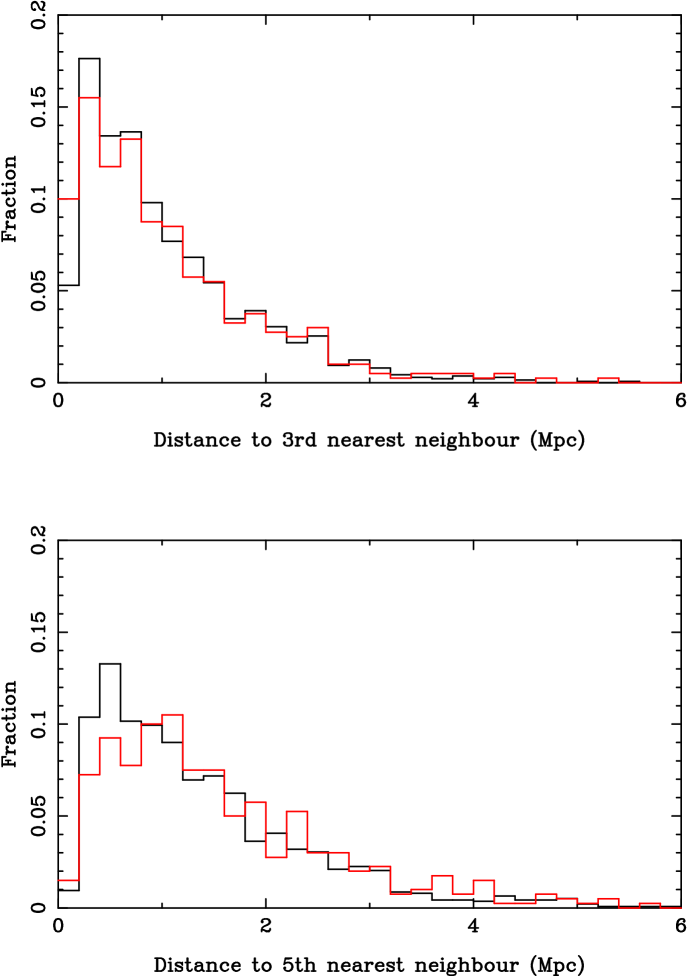
The environmental matching is particularly important for the present study, due to the large size of the IRAS beam. Even for our control galaxies there may be ‘contamination’ (additional IR flux) in the measured LIR from nearby galaxies. However, for a given environmental density, we expect the same contamination for the pairs and control. At the largest dimension of the IRAS beam (5 arcmin) corresponds to more than 0.5 Mpc. Since pairs tend to be in moderately over-dense regions such as groups (Barton et al. 2007), without environmental matching there may be additional IR flux from nearby galaxies (the contribution from the companion is dealt with separately, see Section 3.1 below). We can use our measurements of environmental density to gain some intuition over how well the density matching will perform on the scale of the IRAS beam. Figure 2 shows the distribution of distances to the 3rd and 5th nearest neighbours for the pair and control galaxies that have been matched to the H10 catalog. Although one of the parameters in the control matching process was the locally normalized density, , we do not necessarily expect the pair and control histograms in Figure 2 to be perfectly aligned. This is because only galaxies with IRAS counterparts are included, for both the pair and control distributions. That is, whilst the matching is done independently of IRAS detections, only those in the IRAS sample are shown in Figure 2. Nonetheless, in Fig. 2 there is good agreement between the distributions of in the pairs and control. There is also an excellent agreement between the distribution of the 3rd nearest neighbour distances of pairs and controls, as shown in the top panel of Figure 2 (where, for a pair, its nearest neighbour is the companion). The environmental matching should therefore largely mitigate the issue of multiple galaxies within the IRAS beam.
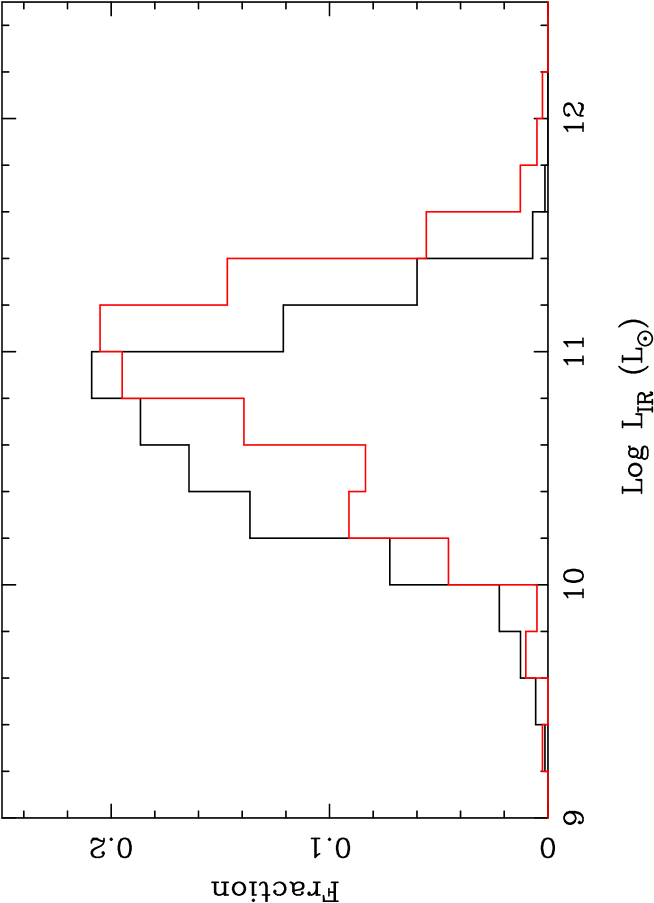
Figure 3 shows the LIR distribution of our pairs and control samples. The pairs are, on average, slightly more IR luminous than the full H10 sample, with a typical log (LIR/L⊙) . Indeed, of the 400 paired galaxies which are matched with H10, 172 are classified as LIRGs (40%) and 1 as a ULIRG. It can already be seen from Figure 3 that the pairs have higher average LIR compared to their mass, redshift and environment matched controls.
3 Results
3.1 The luminous infra-red galaxy fraction in close pairs
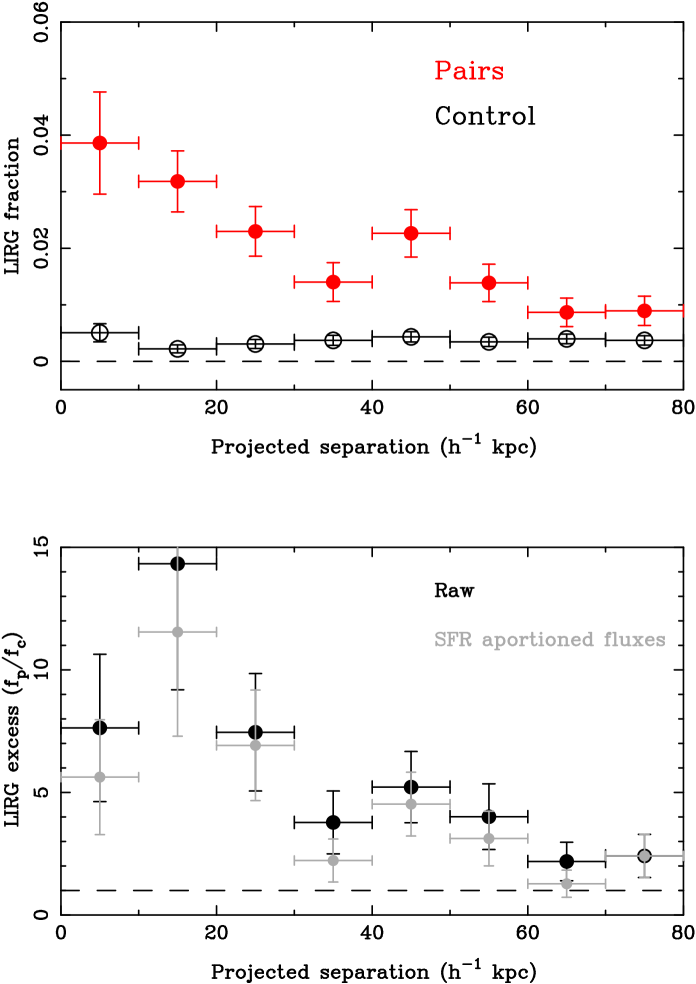
We begin our investigation of the IR properties of pairs by quantifying in Figure 4 the fraction of LIRGs in our pairs sample as a function of projected separation. The LIRG fraction in each bin is calculated relative to the total number of pair galaxies in that range, regardless of IRAS detection. There is a steady increase in the LIRG fraction in the pairs as the projected separation decreases, indicating that their high LIR is associated with the interaction. In addition to the general increase in the LIRG fraction amongst the pairs sample, it is of interest to estimate the relative LIRG frequency compared to the control sample. The lower panel of Fig. 4 shows that the LIRG fraction in pairs is enhanced relative to the control sample at small separations ( kpc) by a factor of 5 – 10, and remains enhanced at the highest separations of the sample (80 kpc) by up to a factor of 2 – 3.
It is important to consider whether the LIRG fraction enhancement is just extra IR flux moving into the beam as galaxies get closer together. Similarly, one might question whether the LIRG fraction plateau at wide separations is caused by residual environmental effects not accounted for in our control sample matching. As argued in Section 2.2, for all but the widest pairs (2%), both galaxies are in the beam, so that the trend of increasing LIRG fraction as a function of can not be due to a gradual trend of beam confusion. Moreover, since the projected separations of this minority of partially resolved galaxies are all kpc, separation dependent beam confusion/resolution can not explain the rise in the LIRG fraction at small projected separations. As a further test, we construct a sample of projected (in redshift space) pairs that we do not expect to show any signs of interaction, but are nonetheless close on the sky. We have previously used such projected samples to test for photometric contamination effects (e.g. Patton et al. 2011). The projected sample is selected identically to the main pairs sample, with the exception that the relative velocity criterion is now 300 V 5000 km s-1. We first confirm that the SFRs of the projected sample do not depend on . Next, the LIRG fraction of the projected pairs is calculated and found to be flat with . Had the IRAS beam been gradually missing flux at larger , then the LIRG fraction of the projected pairs would have decreased with increasing separation. We therefore conclude that the LIRG fraction of the V 300 km s-1 pairs is truly declining with , and the effect shown in Fig. 4 is not a beam confusion effect.
It should be noted that although our LIR measurements are the combined fluxes from two galaxies, such blending is also frequently present in other LIRG and ULIRG samples (e.g. Howell et al. 2010). Nonetheless, it is of interest to attempt a decomposition of the LIR between the two galaxy companions. As argued above, the environmental matching should largely account for this; subtracting the estimated IR flux from the companion is a very conservative correction. We assume that the LIR scales as the SFR, a relationship that is well-established in the literature and present in our control sample. The LIR correction is therefore applied by dividing the total LIR between the two galaxies relative to their respective SFRs. Depending on the initial LIR in the H10 catalog, and the relative SFRs, this can either increase or decrease the number of LIRGs in each bin in Figure 4. For example, if a pair galaxy with log (LIR/L⊙) = 11.1 that was originally classified as a LIRG has a companion with an identical SFR, the two galaxies will both be classified as non-LIRGs after the LIR has been equally divided. On the other hand, a pair galaxy with log (LIR/L⊙) = 11.9 would have originally been classified as a LIRG, but since no IRAS detection is associated with its companion (due to the large IRAS beam), only 1 LIRG is counted for the pair. However, if the SFRs of the two galaxies are equal, the equal division of the LIR will yield two LIRGs. The overall result of the flux aportioning is shown by the grey shaded points in Figure 4. The SFR-corrected LIRG fractions generally decrease, but there is still a trend with and an enhancement at all separations over the control by a factor of 2–10.
3.2 Pairwise properties of LIRGs
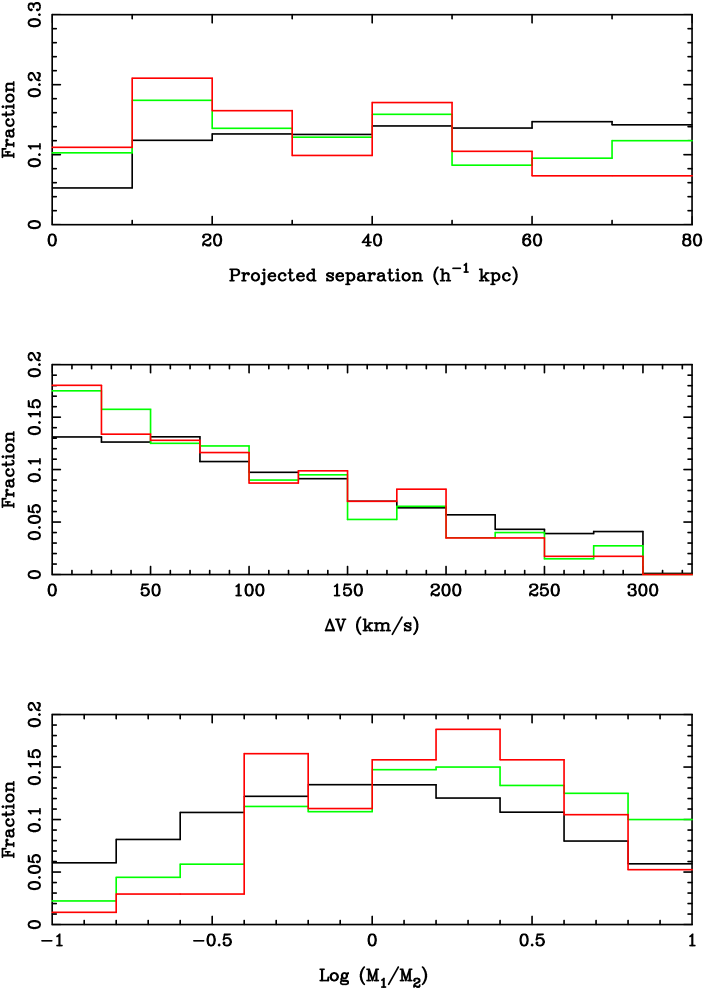
We next investigate whether there are certain pair configurations that are particularly conducive to producing LIRGs. Figure 5 compares the properties of the pairs that are LIRGS, relative to the full pairs sample that fulfill the criteria listed in Section 2. The full pairs sample includes both actively star-forming and quiescent galaxies. Since we expect the distribution of fundamental properties of these two categories to differ, we also compare the LIRG pairs with the pairs with IRAS detections, but with log (LIR/L⊙) 11, which are therefore star-forming, but presumably at lower rates than the LIRGs, or with a lower dust content.
3.2.1 Projected separation
The top panel of Figure 5 shows that the LIRG pairs (red histogram) tend to have smaller projected separations than the full pairs sample, as expected from Figure 4. A Kolmogorov-Smirnov (KS) test yields a probability of 1.6 that the full pairs sample (black histogram) is drawn from the same distribution as the LIRGs (red histogram). This is also consistent with the finding by Hwang et al. (2010) that higher LIR galaxies tend to have closer nearest neighbours. The bias towards low is also seen in all the IRAS detected pairs (green histogram), where the LIRG and IRAS detected distributions are indistinguishable in a KS test. This indicates that SFR enhancements contribute over a range of IR luminosities. There is also a hint of a deficit of LIRG pairs relative to the full pairs sample at wide separations, 50 kpc. Recall that the LIRG fraction relative to the control is still enhanced out to at least = 80 kpc (Figure 4). The relative paucity of LIRG pairs relative to non-LIRG pairs simply indicates that the SFR enhancements are likely to be more modest at these wide separations, as demonstrated explicitly in Scudder et al. (2012).
3.2.2 Relative velocity
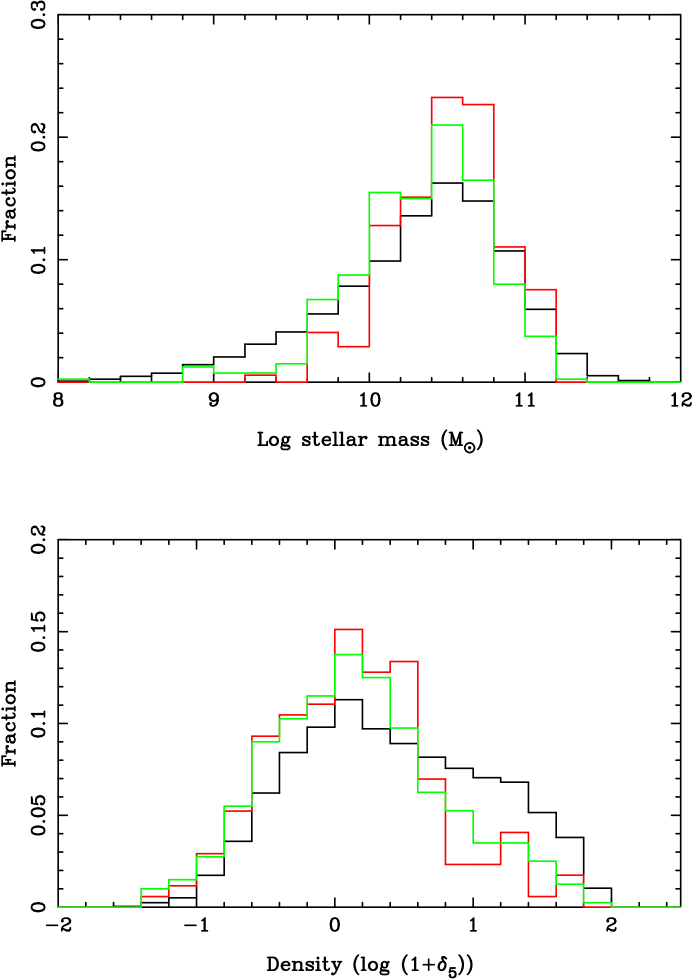
The middle panel of Figure 5 shows that the LIRG pairs may be slightly skewed towards lower V values than the full pairs sample, although a KS test does not yield any significant difference between the V distributions of any of the samples. Nonetheless, a bias towards smaller V would be consistent with previous observational results that have found that the SFR of close galaxy pairs increases with decreasing V (e.g. Lambas et al. 2003; Nikolic et al. 2004; Alonso et al. 2004, 2006). However, the measurement of SFR dependence on V is complicated by an underlying correlation between V and local galaxy density (Ellison et al. 2010), which means that V is itself a coarse metric of environment. In turn, there is also a well established SFR-density relation in the local universe (e.g. Gomez et al. 2003), so that a bias towards small V values in LIRGs could be associated with higher intrinsic SFRs in lower density environments. In the bottom panel of Figure 6 we show that the LIRG pairs are certainly biased towards lower density environments than the full pairs sample. However, the density distribution of LIRGs is similar to that of other IRAS detected star-forming pairs (green histogram in Figure 6) (see also Hwang et al. 2010). The environments of the full pairs sample approximates a double log-normal density distribution, where the high density population is apparently dominated by quiescent galaxies (Baldry et al. 2006).
3.2.3 Mass ratio
Our complete pairs sample is, by design, symmetric in mass ratio (black histogram in Figure 5). However, the pairs that are identified as LIRGs are biased towards high mass ratios (red histogram in Figure 5), i.e. the LIRG galaxies in pairs tend to be more massive than their companions. A KS test yields a 2.3 probability that the LIRGs are drawn from the same distribution of mass ratios as the full pairs sample. There are very few LIRG galaxies that have masses less than a factor of 3 below that of their companion. The magnitude limited nature of the SDSS survey means that high mass ratio galaxies are amongst the most massive in the sample. The tendency for LIRG pairs to have high mass ratios is therefore likely to be a selection effect. Galaxies with higher masses (and intrinsically higher SFRs) require a smaller SFR boost to achieve LIRG status (a topic which is discussed in more detail in Section 4.3). Indeed, relatively few of the LIRGs in either our pair or control samples have stellar masses log (M⋆/M⊙) (Figure 6). However, the lower panel of Figure 5 hints that the LIRG pairs have a narrower distribution of mass ratio than the IRAS detected pairs (although a KS test is inconclusive), a result which could not be explained by mass bias. Simulations have previously predicted that the most effective SFR boost occurs within almost equal mass mergers (Cox et al. 2008). Observational works that have measured direct enhancements in the SFRs of close pairs support the dominant role of major mergers in producing the strongest starbursts (Woods et al. 2006; Ellison et al. 2008; Scudder et al. 2012; Lambas et al. 2012). The largest IR luminosities may therefore be associated with galaxies that are both massive (and therefore have relatively high SFRs to start with) and are engaged in major mergers (Hwang et al. 2010). Indeed, massive galaxies engaged in major mergers seem to dominate the local ULIRG population (Dasyra et al. 2006).
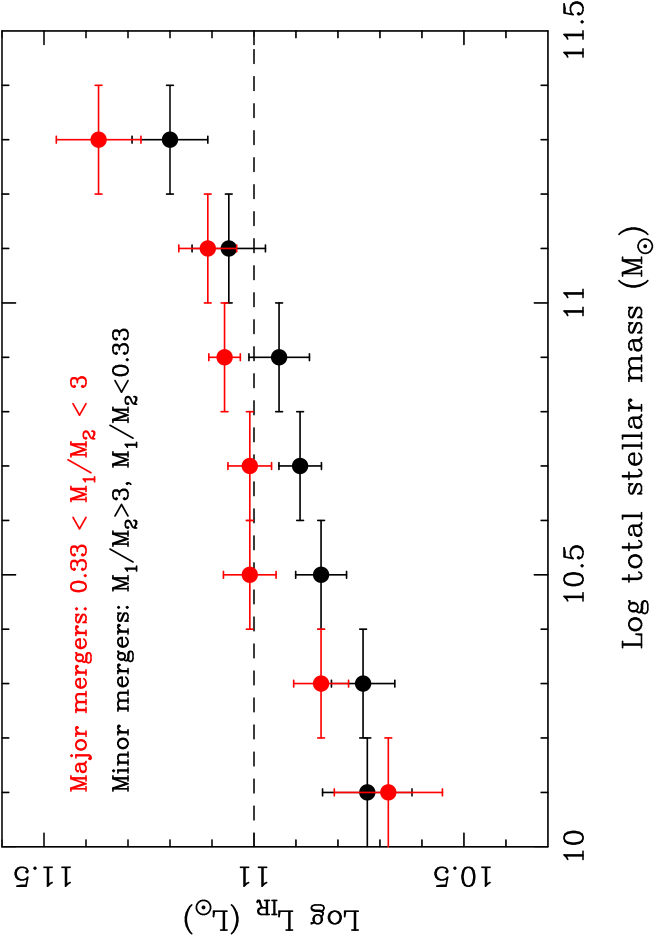
To further investigate the dependence of LIRG classification on mass and mass ratio, in Figure 7 we plot the median LIR as a function of the total stellar mass of the pair. We distinguish the galaxy pairs by their relative masses, in order to test whether, at fixed total mass, the mass ratio has any impact on the total LIR (i.e. SFR). Galaxies with masses within a factor of three of each other are considered to be equivalent to major mergers (shown in red in Figure 7); all others (up to a maximum mass contrast of a factor of 10) are designated as minor mergers (black points). Figure 7 shows that LIR increases with the total stellar mass of the pair, as expected from the correlations of mass with SFR and LIR. However, it can also be seen that at fixed total stellar mass, the median LIR is systematically higher for major mergers. The systematic offset to higher LIR at fixed total stellar mass in major mergers supports higher rates of dusty star formation in approximately equal mass encounters.
3.3 The role of AGN
In the previous sections, we have tacitly assumed that the main driver of the LIRG phase in our pairs sample is the enhancement in the SFRs that is a well-established result of galaxy interactions. In moderate luminosity LIRGs, the LIR indeed appears to be dominated by star formation (e.g. Alonso-Herrero et al. 2010). However, AGN can also contribute to the IR luminosity. Petric et al. (2011) confirm the modest contribution from AGN in the majority of LIRGs from a study of high ionization lines in the mid-IR spectra of 248 nearby LIRGs. They find that 20% of LIRGs contain an AGN, and that the AGN is the dominant contributor of IR flux in only 10% of LIRGs. The relative importance of AGN to the IR flux increases with LIR, so that the ULIRGs exhibit both high AGN fractions, and higher contribution from AGN within a given galaxy (e.g. Yuan et al. 2010 and references therein). In isolated star-forming galaxies, there is a well-known increase in the AGN (as classified from optical emission line ratios) fraction with stellar mass. Since the SFR also increases with stellar mass, the connection between AGN incidence and LIR is not too surprising. However, there seems to be an additional connection between the AGN incidence in IR luminous galaxies and mergers. The AGN-dominated LIRGs (Petric et al. 2011) and ULIRGs (Yuan et al. 2010) seem to preferentially occur at late merger stages. Combined with the observation that our pairs show an enhanced AGN fraction towards small separations (Ellison et al. 2011b), it is germane to consider whether the increase in LIRG fraction seen in Figure 4 is due to an increasingly dominant contribution from AGN.
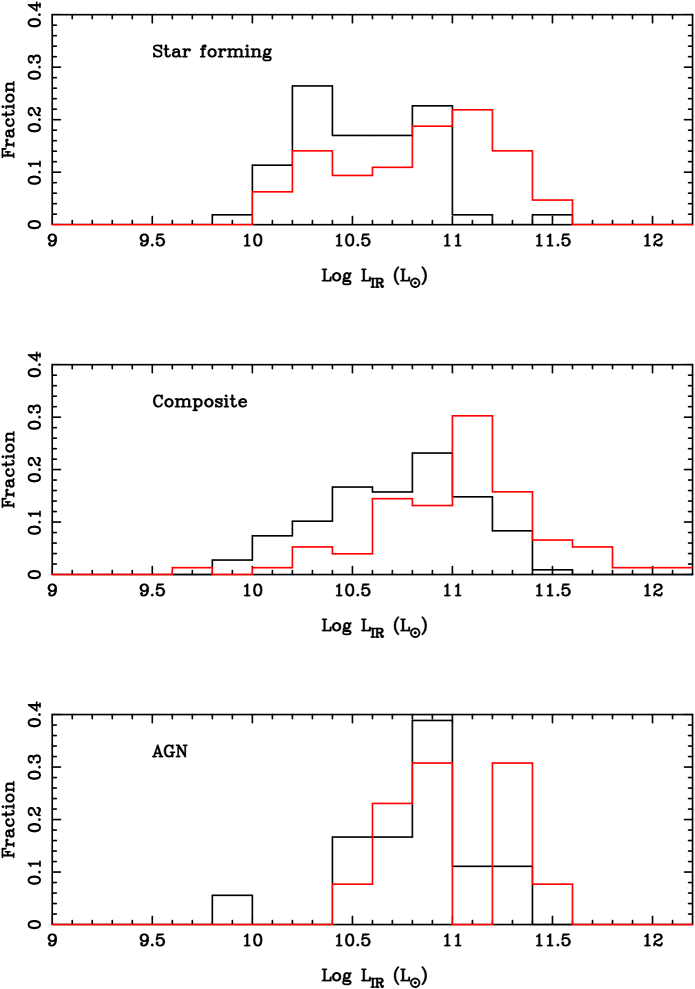
Figure 8 shows the LIR distributions for pairs and control (red and black histograms, respectively) in star-forming, composite and AGN galaxies. The three categories are defined by combining the classifications of Kewley et al. (2001) and Stasinska et al (2006), and are made for galaxies with emission line signal-to-noise ratios S/N3. For this figure, we consider only pairs (and their controls) with kpc, where differences in SFR, AGN and LIRG fraction (relative to the control sample) are most significant. Recall that we are only complete for log (LIR/L⊙) 11, but this incompleteness applies equally to all our galaxy classes. It is also important to keep in mind that amongst the emission line galaxies in our sample, there is a higher AGN fraction at higher stellar masses, where the SFRs (and hence LIR) are, on average, higher. Figure 8 shows a shift to higher LIR for AGN versus star forming galaxies, e.g. by comparing the control samples for the two categories (black histograms in lower and upper panels respectively). Such a shift is expected based on the mass distributions of the AGN and star-forming galaxies, as described above. Figure 8 also shows that the pairs (red) have systematically higher LIR than the mass-matched controls, for both star-forming and composite classifications. The mass-matching means that the LIR differences between the pair and control galaxies is driven by the interaction, rather than a mass bias. However, there is no statistically significant difference between the LIR distributions of the pair and control AGN samples (Figure 8, lower panel). A KS test yields a 50% probability (i.e. inconclusive) that the two samples are drawn from different populations. We conclude that the increase in LIRG fraction seen in Figure 4 is not due to an increasing contribution to the LIR from AGN, but rather is driven by star formation.
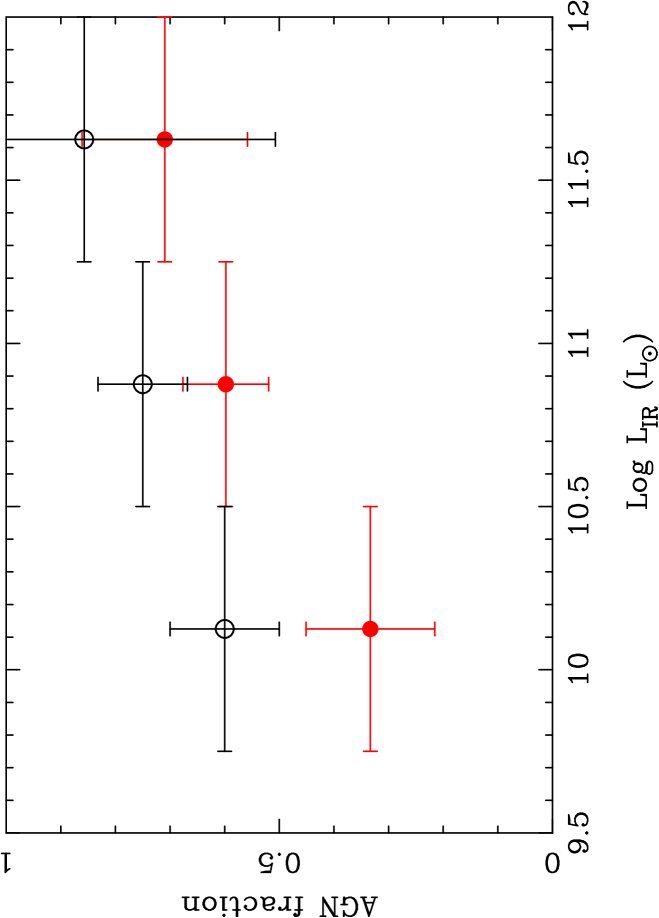
Having argued that the LIRG pairs are dominated by star formation, we can now turn to the question of whether the merger contributes to the LIR (or mass) dependence of AGN incidence. Figure 9 shows the fraction of AGN as a function of LIR for both our close ( 30 kpc) pairs and control sample. Again, we recall that although our sample is only complete to log (LIR/L⊙) 11, the pairs and control can be compared differentially. In agreement with previous studies (e.g. Goto 2005; Hwang et al. 2010; Kartaltepe et al. 2010; Yuan et al. 2010; Iwasawa et al. 2011) the AGN fraction increases steadily in the control with increasing LIR. As described above, this is likely due to the co-dependence of stellar mass on both SFR (which correlates with LIR) and AGN fraction, such that higher stellar mass galaxies have higher SFRs (and hence higher LIR) and higher AGN fractions. Note that the exact AGN fraction at fixed LIR is highly dependent on the classification process (e.g. different line ratio cuts in the optical, colour classifications in the mid-IR and X-ray classification), making a direct comparison with other works non-trivial. Even for a given technique, such as optical line ratio diagnostics, precise classification is sensitive to choices such as S/N, as lower S/N cuts will increasingly include low ionization nuclear emission line regions (LINERs, e.g. Cid-Fernandes et al. 2010). The AGN classification of Stasinska et al. (2006) includes composites in which even a minor contribution of AGN is inferred from the line ratios. Using a ‘stricter’ AGN classification, such as that of Kauffmann et al. (2003) reduces the AGN fractions by a factor of about 2, but still leaves the trend with LIR intact, yielding an AGN fraction of 20% for log (LIR/L⊙) and about 50% for the LIRGs.
Beyond the general increase of AGN fraction with LIR, Figure 9 hints that the AGN fraction in pairs may be slightly lower than the control at fixed IR luminosity. Such behaviour might be expected if pairs increased their LIR without increasing their AGN fraction. This is in apparent disagreement with several recent studies that have linked mergers with AGN triggering in the local universe (Ellison et al. 2011b; Liu et al. 2012; Koss et al. 2012). One solution to this tension may be that the dust that is producing the high IR luminosities in our sample is hindering the classification of optical AGN. A forth-coming paper which uses multi-wavelength mid-IR diagnostics will investigate dust-obscured AGN in close pairs.
4 Discussion
4.1 Merger fractions
It is widely accepted that the fraction of mergers increases as a function of LIR, with mergers representing the bulk of the ULIRG population (e.g. Kartaltepe et al. 2010). At LIRG luminosities, 15-50 % of galaxies are usually classified as mergers (e.g. Zheng et al. 2004; Melbourne et al. 2005; Wang et al. 2006; Kaviraj 2009; Kartaltepe et al. 2010). However, these studies all start with an IR selected sample and classify mergers based on visual morphologies. Our study of spectroscopically selected close pairs can offer an alternative measure of the merger fraction as a function of LIR.
In order to determine the fraction of mergers as a function of LIR, we must first define the term ‘merger’. As for the AGN statistics in the previous section, we set an upper limit of 30 kpc as the separation within which the strongest interaction-induced effects are seen. The parent pairs sample has a mass ratio range from 1:10 to 10:1. However, at higher redshifts the magnitude limited nature of the SDSS means that minor mergers become increasingly scarce and we are dominated by pairs with approximately equal masses (and magnitudes), see Section 3.2.3. It is additionally necessary to consider the mass completeness of our sample. For galaxies near the (mass) detection threshold of the SDSS, we will be unable to detect lower mass companions.
In order to tackle the above issues of completeness, the measurement of a merger fraction requires a careful definition of ‘close companion’. The first component of this definition is in terms of companion proximity, both in projected and radial space. We adopt the criteria of a close companion to be a galaxy within 30 kpc and 300 km s-1. We also restrict our definition to major mergers, i.e. galaxies whose companion has a mass within a factor of three of its own. The mass completeness of the SDSS is strongly colour dependent . At fixed redshift, blue galaxies can be detected to considerably lower masses than red galaxies (e.g. van den Bosch et al. 2008; Mendel et al. 2013), due to the flux limit in the SDSS. At a redshift of , the SDSS is complete for both red and blue galaxies above log (M⋆/M⊙) 10.7 (Mendel et al. 2013). A complete census of all 0.33 M1/M2 companions would therefore require a mass limit at of log (M⋆/M⊙) 11.2, and hence severely limit the sample for which we could determine merger fractions. We therefore adopt a mass limit that only includes blue cloud galaxies (Mendel et al. 2013), and caution that our close pair fractions are only applicable in this mass range (at , the mass limit corresponds to (M⋆/M⊙) 10.37; for lower redshifts, the limit will be lower).
The process for the quantification of merger fraction as a function of LIR is as follows. For each galaxy in the SDSS spectroscopic sample that appears in the Hwang et al. (2010) IRAS catalog, we determine whether its stellar mass is at least 0.5 dex (a factor of three) above the redshift dependent completeness for blue galaxies described in Mendel et al. (2013). Every IRAS-detected SDSS galaxy that passes this mass criterion is then compared with the subset of our catalog of close pairs that have 30 kpc, V 300 km s-1, and 0.33 M1/M2 to identify whether the galaxy has a companion. During the compilation of the pairs sample, pairs with angular separations arcseconds are randomly culled to produce an even fibre (in)completeness as a function of separation. Patton & Atfield (2008) showed that the level of spectroscopic completeness at these small separations is 26%, relative to the photometric galaxy catalog. This completeness rate includes both the effects of fibre collisions and the overall spectroscopic completeness of the SDSS. We therefore multiply our pair fractions by a factor of 3.85.
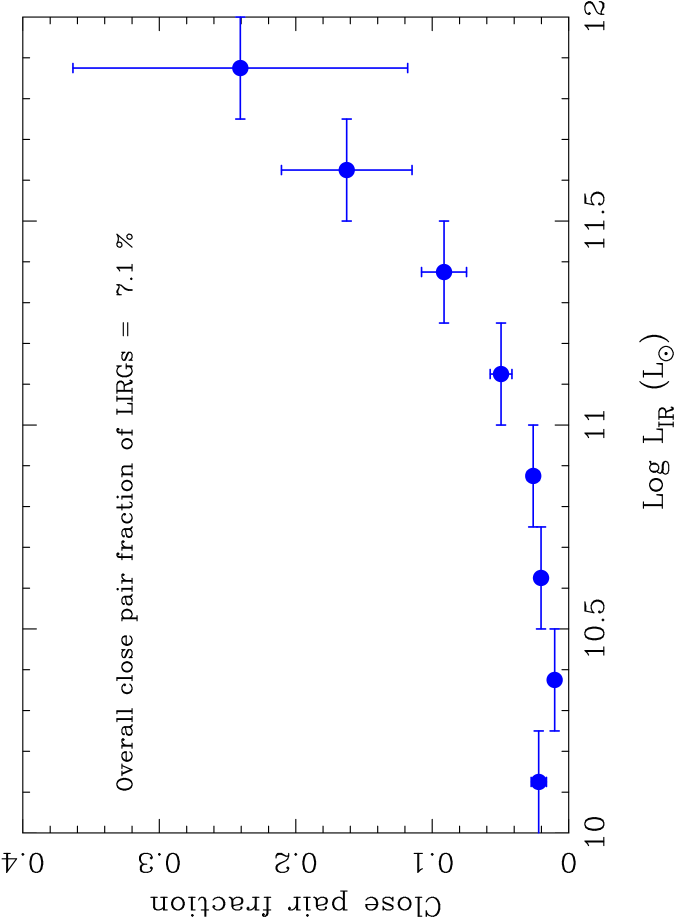
Figure 10 shows the fraction of galaxies in each LIR bin that have a close companion within the criteria for proximity and mass completeness described above. We find that below log (LIR/L⊙) 11 the fraction of galaxies that have a close, approximately equal mass companion is approximately constant at 2%. Above LIRG luminosities there is a rise in the fraction of galaxies that have a close companion, with an overall pair fraction amongst the LIRGs of 7%. It is not clear why the pair fraction increases only above log (LIR/L⊙) 11, but a similar dependence has been previously seen (e.g. Kartaltepe et al. 2010). Tekola, Vaisanen & Berlind (2012) have shown that for galaxies with log (LIR/L⊙) 11 there is no correlation between IR luminosity and local galactic density. However, they also showed that for LIRGs, there is a strong correlation between LIR and density, and suggested that the LIRG luminosity (at low redshifts) represents a real transition in galaxy properties.
Although the close pair fraction at LIRG luminosities that we find is of a similar magnitude to what has been found in previous studies (e.g. Zheng et al. 2004; Melbourne et al. 2005; Wang et al. 2006; Kaviraj 2009; Kartaltepe et al., 2010), a rigourous quantitative comparison (i.e. on the basis of absolute merger fractions) with other works is non-trivial. For example, we have defined our mergers in a specific projected separation, V and mass ratio range. The fraction of LIRGs (and SFRs of pairs in general) remain elevated beyond our nominal cut-off of 30 kpc. The mass ratio cut is dictated by completeness considerations, but minor mergers can experience significant SFR enhancements (e.g. Scudder et al. 2012) that can result in LIRGs (Figure 5). Indeed, Hwang et al. (2010) find that 34% of the LIRGs in their low redshift sample (also a result of a cross-matching between IRAS and SDSS) are in minor mergers. Our close pair fraction of 7% might therefore be considered to be a lower limit to the actual fraction of LIRGs with a companion. Conversely, our close pairs sample will also include galaxies that have not yet interacted (i.e. have not yet experienced a pericentric passage), as well as some projected pairs that are not actually destined to interact. Both of these categories will dilute the fraction of LIRGs associated with merger-triggered star formation. Scudder et al. (2012) visually classified a subset of our star-forming pairs and found only 55% to show visible signs of disturbance. Finally, we do not include a merger timescale, or an observability timescale. These various caveats serve to caution about an absolute comparison with other works, but the general trend of a rising close pair fraction at high LIR should be robust, and the results in Figure 10 demonstrate a connection between mergers and high IR luminosities.
4.2 Star formation rates and extinction
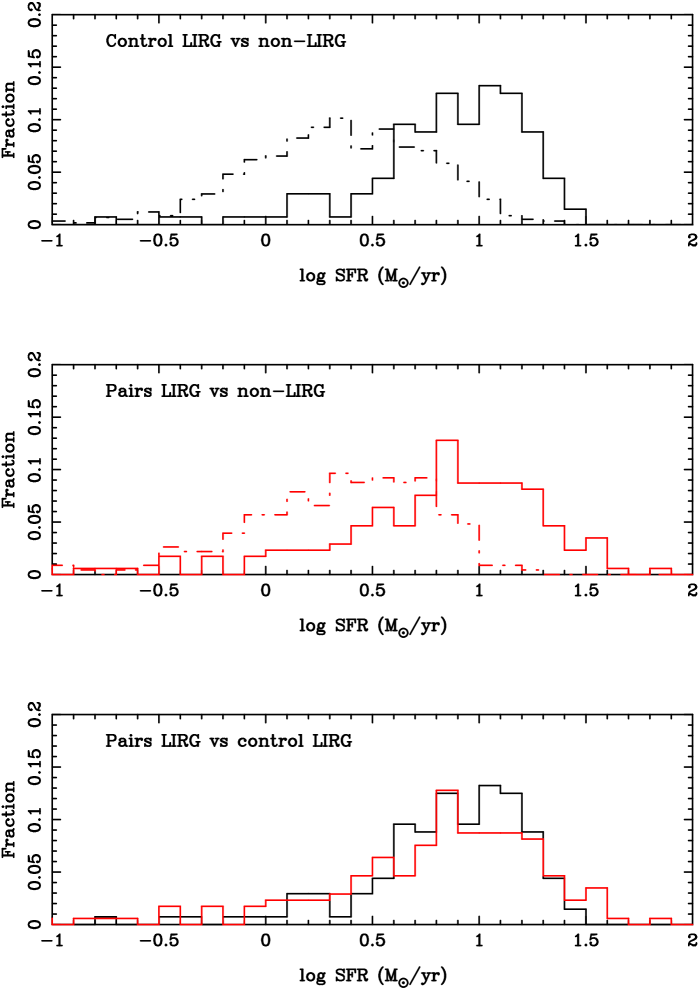
In Section 3.3 we argued that the increase in LIRG fraction was not dominated by the increasing AGN fraction in our close pairs sample (Ellison et al. 2011b). The enhancement in the SFR in pairs is therefore the obvious culprit responsible for the increasing LIRG fraction at small separations. In Figure 11 we show the distribution of SFRs for the pair and control samples, distinguishing between those that are classified as LIRGs and those with lower LIR. In the top and middle panels we compare the LIRG (solid lines) and non-LIRG (dot-dashed lines) SFRs for control (top) and pairs (middle). It can be seen that the SFRs of the LIRGs are shifted to higher values, in both the pairs and control, relative to the SFRs in the non-LIRGs. In the lower panel, we compare the SFRs of the pair LIRGs (red) with the control LIRGs (black). The SFRs are indistinguishable; the controls that are LIRGs have similarly high SFRs to those pairs that are LIRGs. Figure 11 indicates that whilst the interaction serves to increase the SFR, and hence the LIR, similarly high values of SFR (and LIR) can be found amongst the control sample. This result is in contrast with the ULIRGs, where the high SFRs are almost exclusively associated with mergers.
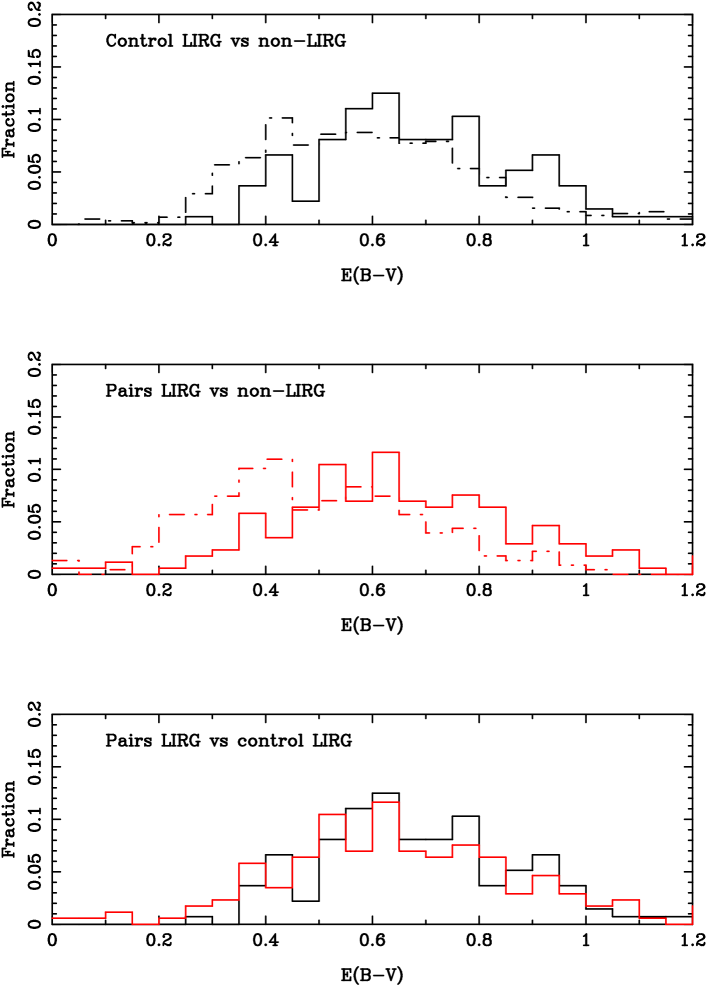
Star formation alone does not produce high IR fluxes; it is the presence of dust to re-process the shorter wavelengths that is the second key ingredient in the production of a LIRG. In Figure 12 we present distributions of E for the LIRG/non-LIRG pairs and control in the same fashion as for SFRs in Figure 11. The E values are determined from the Balmer decrement using an SMC extinction curve (see Scudder, Ellison & Mendel 2012 for full details of our emission line processing). As was the case for SFRs, we find that the LIRGs in both the pair and control samples have higher E than the non-LIRGs. Moreover, the pair LIRGs and control LIRGs (lower panel) have similar E distributions. A high extinction may be due to an intrinsically higher dust content, or it can be an inclination effect. We investigated the disk inclinations derived for our sample from the public SDSS photometric catalogue of Simard et al. (2011), but found no difference between the LIRG and non-LIRG distributions. The high LIR in LIRGs is therefore apparently not an inclination effect, but relies on intrinisically high SFRs in the presence of dust.
4.3 How to make a LIRG
It is clear from the results presented in this paper, and elsewhere (e.g. Robaina et al. 2009; Kartaltepe et al. 2010; Hwang et al. 2010, 2011), that mergers contribute to the LIRG population. In this paper, we have demonstrated the LIRG-merger connection in two main ways. First, we have shown that the LIRG fraction increases in our sample of close pairs as the galaxies’ projected separation decreases (Figure 4). Second, we have shown in Figure 10 that the contribution from mergers increases at IR luminosities above the LIRG cut-off. We have also demonstrated that equal mass pairings of massive, star-forming galaxies are particularly conducive to producing LIRGs. However, as demonstrated in Figure 10, mergers are clearly not necessary for the production of LIRGs; any process which enables the galaxy to reach a high enough SFR (in the presence of dust) may lead to a LIRG. This logic implies that there is some SFR threshold required for a galaxy to appear as a LIRG. Indeed, as shown in Figure 11 there are very few LIRGs with SFR 1 M⊙/yr. This is not surprising, given the strong correlation between LIR and SFR (e.g. Kennicutt 1998; Kennicutt & Evans 2012). Forming a LIRG could therefore be as simple as achieving sufficient SFR (in the presence of dust).
We can approximately444The finer details of a galaxy’s LIR will depend on factors other than just a SFR. Dust must obviously be present, and the spatial distribution of stars and dust may also play a role. determine the SFR threshold required to produce log (LIR/L⊙) 11 empirically from our data by performing a linear least squares fit between the LIR values from the H10 catalog and the SFRs from the matched SDSS spectroscopic sample. We find that log (LIR/L⊙) = 11 corresponds to a SFR 9 M⊙/yr. Alternatively, from the LIR-mass relation (that results from correlations between SFR-LIR and SFR-mass) we find that a log (LIR/L⊙) = 11 corresponds to a typical mass log (M⋆/M⊙) 10.9, at . ‘Normal’ star-forming galaxies above log (M⋆/M⊙) = 10.9 may therefore readily manifest themselves as LIRGs, modulo the observed scatter in the stellar mass-SFR relation for individual galaxies. Lower mass galaxies require a SFR enhancement above the average for their stellar mass. This enhancement is simply the difference between a SFR of 9 M⊙/yr and the value predicted from the stellar mass-SFR relation and is determined to be
| (2) |
The quantity SFR is identical to the SFR offsets that we have previously calculated for the galaxy pairs in Scudder et al. (2012). That is, for a given galaxy in a pair, the difference between its SFR and the median of its mass-matched controls. For the present work, we have expanded the calculation of SFRs beyond just the pairs sample, to include all galaxies with measured masses in the DR7 spectroscopic sample (i.e. the sample presented in Mendel et al. 2013). The SFR of a given galaxy is calculated relative to all galaxies on the star-forming ‘main sequence’ (i.e. the SFR-stellar mass relation) within a redshift tolerance =0.005 and mass tolerance log M⋆=0.1 dex. At least 5 matches are required in order to calculate a SFR offset, a limit which is achieved in 93% of cases (the typical number of mass and redshift matches is usually of the order several hundred). If less than 5 matches are found, the tolerance is grown by a further =0.005 in redshift and log M⋆=0.1 dex in stellar mass until the required number of matches is achieved.
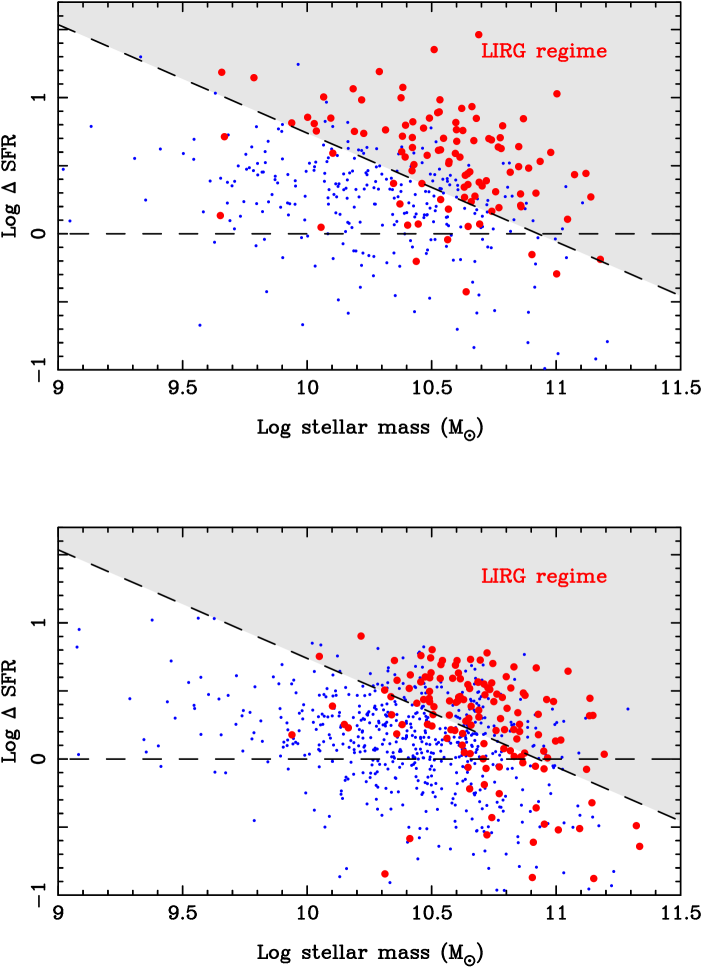
With SFR offsets in hand, it is possible to directly compare the SFR of the LIRG pairs with the relation in equation 2. In the top panel of Figure 13 we plot the SFRs of the pairs vs their stellar mass; large circles indicate galaxies identified as LIRGs (after the flux is aportioned relative to SFR) and small points show non-LIRG galaxies. The diagonal dashed line shows the minimum SFR required in order to produce a LIRG (from equation 2). The lower panel also depicts the SFR versus mass, but for the control galaxies. Despite its simplicity (and the significant scatter in the LIR-SFR relation, and smaller scatter in the stellar mass-SFR relation) equation 2 is a fairly good representation of the data, with most of the LIRGs lying above the diagonal dashed line in both panels of Fig. 13, and most non-LIRGs lying at smaller values of SFR for their stellar mass. Nonetheless, there are some non-LIRG galaxies whose SFR appears, at face value, to be sufficient to produce a LIRG. The non-LIRGs in the shaded regions of Figure 13 do have E values that are lower, on average, than the LIRGs, but there is significant overlap. Presumably, the location of the dust relative to the starburst is important for the production of large IR fluxes.
It can be seen that, in both the pairs and control samples, LIRGs are present across the full mass range, but larger SFRs are required at lower masses, by a factor of 10 or more, as predicted from equation 2. SFR offsets of a factor of 10 are very rare; Scudder et al. (2012) find only 5% of pairs have log SFR 1. Figure 13 shows that SFR offsets of a factor of 10 are completely absent from the control sample. The fact that LIRGs are more common at higher mass (e.g. Melbourne et al. 2008; Hwang et al. 2010), is presumably due, at least in part, to the lower SFR that is required to put them above the LIRG threshold (diagonal dashed line in Figure 13). Put another way, it is not that mergers between massive galaxies necessarily produce the largest SFR enhancements (in fact, Figure 13 shows a spread of SFR at fixed mass), but rather they require relatively small boosts (or no boost at all!) in order to achieve a LIRG-sufficient SFR. Indeed, the fraction of LIRGs with peculiar morphologies (presumably associated with an interaction) increases towards lower redshifts (Melbourne et al. 2005). Secular processes, such as bars, which can enhance SFRs by similar amounts to mergers (e.g. Ellison et al. 2011a and references therein) may play a significant role in producing low redshift LIRGs (e.g. Wang et al. 2006).
4.4 ULIRGs
In this paper, we have focused on LIRGs, largely because they are the highest LIR galaxies we can study with reasonable statistics in our sample. The one ULIRG in our sample is IRAS F08572+3915 (SDSS objID=588013382191349914). This is a well known ULIRG and is the only galaxy pair in our sample that is present in the IRAS Revised Bright Galaxy Sample (Sanders et al. 2003). This galaxy pair is also present in the Great Observatory All-sky LIRG Survey (GOALS, Armus et al. 2009). The IR luminosity for this ULIRG (from Hwang et al. 2010) is log (LIR/L⊙) = 12.01, slightly lower than reported in the catalog of Wang & Rowan-Robinson (2009) log (LIR/L⊙) = 12.16. If we aportion the IR flux according to the SFRs in each of the two galaxies, as we have done for the LIRGs, the lower LIR in the Hwang et al. (2010) catalog yields two LIRGs. However, the slightly higher LIR in the Wang & Rowan-Robinson (2009) is sufficient to preserve the ULIRG classification of the more highly star-forming component in the pair.
Despite the lack of ULIRGs in our sample, it is worth considering how the discussion in the previous section applies to ULIRGs, with log (LIR/L⊙) 12. To become a ULIRG, the SFR has to be higher by a further order of magnitude than the diagonal dashed line in Figure 13, which readily explains why ULIRGs are so rare in the local universe; unlike LIRGs, they are not ‘naturally occurring’ at any stellar mass. Even in mergers, the SFR boosts are rarely sufficient to produce a log (LIR/L⊙) 12 in our SDSS sample. However, at high redshifts, the relationship between mass and SFR evolves, such that SFRs are higher at fixed stellar mass by a factor of 30 at 2 relative to (e.g. Daddi et al. 2007; Noeske et al. 2007; Wuyts et al. 2011). This evolution means that a SFR sufficient to produce a LIRG at (as in our SDSS sample) is sufficient to produce a ULIRG at . Indeed, we have (at most) 2 ULIRGs after SFRs are aportioned, 0.5% of the sample, compared to 7% of pairs at (Lin et al. (2007).
There has recently been a shift in our understanding of the role of IR luminous galaxies and the implications of a classification scheme that has redshift independent LIR definitions. It has been noted in several works that high IR luminosities are the norm at such that ULIRGs at low and high redshift are very different beasts (e.g. Daddi et al. 2007, 2010; Elbaz et al. 2007, 2011; Sargent et al. 2012). Whilst a ‘normal’ M M⊙ star-forming galaxy is a LIRG at , a similar mass galaxy will be a ULIRG at , and most galaxies with masses above 1010 M⊙ will be LIRGs. Indeed, most ULIRGs are regular main sequence galaxies by (Sargent et al. 2012). It is therefore not surprising that LIRGs dominate the cosmic star formation budget by 1 (Le Floc’h et al 2007; Magnelli et al 2009). Rather than using fixed limits in LIR, identifying the galaxies with the most enhanced SFRs at a given redshift may be best achieved by, as we have done here, quantifying offsets from the star-forming ‘main sequence’ of galaxies at the same epoch (see also, e.g., Rodighiero et al. 2011; Nordon et al. 2012; Sargent et al. 2012; Rovilos et al. 2012). Nonetheless, Kartaltepe et al. (2012) have argued that most ULIRGS are still associated with mergers, despite apparently being in a steady, ‘maintenance’ mode of star formation, rather than undergoing the intense starbursts asscoiated with the low redshift ULIRGs (Elbaz et al. 2011). This could be explained if high redshift mergers tend to trigger much lower (if any) amounts of star formation than their low redshift counterparts. Such a scenario has recently been suggested by Xu et al. (2012) who do not find an enhancement in the SFR of mergers at from Spitzer data. Determining the distribution of SFRs amongst mergers relative to a well matched control sample is the natural next step in understanding the contribution of interactions to SFRs at high redshifts.
5 Summary
From the SDSS DR7 we have compiled a sample of 9397 galaxies in close pairs with mass ratios 0.1 M1/M2 10, projected separations kpc and velocity differences V 300 km s-1. The pairs sample has been matched to the SDSS-IRAS catalog of Hwang et al. (2010) in order to investigate the connection between mergers and high IR luminosities. Total IR luminosities are measured for 400 of the pair galaxies, of which 172 are LIRGs and 1 is a ULIRG. For comparison, a mass-, redshift- and environment-matched control sample of 4 galaxies per pair galaxy is also compiled. Our main conclusions are as follows.
-
1.
The LIRG fraction of galaxy pairs increases with decreasing projected separation relative to the control sample (Figure 4). Such an increase is consistent with expectations that interactions are triggering star formation which, in turn, increase the IR luminosity. Interestingly, we find an increased LIRG fraction out to at least 80 kpc (the limit of our sample), whereas many previous LIRG studies have focused on morphological classifications and late stage mergers close to coalescence.
-
2.
Most of the LIRG pairs in our sample are biased to high mass ratios (Figure 5), due to the higher SFRs that are intrinsically found at higher masses. The highest IR luminosities are therefore not necessarily found in galaxies with the highest SFR enhancements.
-
3.
The pairs with the highest LIR are generally those with the highest total mass, where the LIR reflects the total SFR in the IRAS beam. However, we do find that at fixed total stellar mass (), major mergers (0.33 3) have, on average, slightly higher LIR than minor mergers (Figure 7). The most likely candidates for (merger-induced) LIRGs are therefore close pairs where both galaxies are star-forming and have approximately equal, high stellar masses.
-
4.
LIRG pairs are found in relative low density environments compared with the full pairs sample. However, the environments of LIRGs are consistent with those of other star-forming (IRAS-detected) pairs.
-
5.
The enhanced LIR in the close pairs relative to the control is seen in both the star forming and composite (star forming+AGN) galaxies (Figure 8). However, there is no statistical difference between the LIR distributions of the pair AGN and control AGN. The enhanced LIR in close pairs is therefore likely to be driven by star formation rather than a higher incidence of AGN at close separations.
-
6.
The AGN fraction increases with LIR in both pairs and control galaxies, although there is marginal evidence that the pair AGN fraction is lower than the control at fixed LIR (Figure 9).
-
7.
The fraction of galaxies classified as close pairs increases with LIR above log (LIR/L⊙) 11 (Figure 10). Close pairs ( 30 kpc, 0.33 3) represent 7% of the LIRG population.
- 8.
-
9.
We define a SFR offset, SFR, as the difference between a galaxy’s SFR and the median of other star-forming galaxies at equivalent mass and redshift. The SFR required to become a LIRG decreases as mass increases. A regular star-forming galaxy with mass above log (M⋆/M⊙) 11 (at ) is likely to have sufficient rates of star formation to be classified as a LIRG without any additional SFR enhancement. Lower mass galaxies require higher boosts; mergers can clearly contribute such boosts.
The results presented here demonstrate the link between galaxy mergers and the high IR luminosities that define the LIRG population. However, we have also argued that interactions are just one (and, possibly, not the dominant) route to producing LIRGs.
Acknowledgments
SLE and DRP acknowledge the receipt of NSERC Discovery grants which funded this research. Ho Seong Hwang generously shared his IRAS-SDSS matched catalog with us. We are grateful to Andreea Petric for wavelength-related wisdom and suggestions that motivated this work, and to the anonymous referee for several useful suggestions.
Funding for the SDSS and SDSS-II has been provided by the Alfred P. Sloan Foundation, the Participating Institutions, the National Science Foundation, the U.S. Department of Energy, the National Aeronautics and Space Administration, the Japanese Monbukagakusho, the Max Planck Society, and the Higher Education Funding Council for England. The SDSS Web Site is http://www.sdss.org/.
The SDSS is managed by the Astrophysical Research Consortium for the Participating Institutions. The Participating Institutions are the American Museum of Natural History, Astrophysical Institute Potsdam, University of Basel, University of Cambridge, Case Western Reserve University, University of Chicago, Drexel University, Fermilab, the Institute for Advanced Study, the Japan Participation Group, Johns Hopkins University, the Joint Institute for Nuclear Astrophysics, the Kavli Institute for Particle Astrophysics and Cosmology, the Korean Scientist Group, the Chinese Academy of Sciences (LAMOST), Los Alamos National Laboratory, the Max-Planck-Institute for Astronomy (MPIA), the Max-Planck-Institute for Astrophysics (MPA), New Mexico State University, Ohio State University, University of Pittsburgh, University of Portsmouth, Princeton University, the United States Naval Observatory, and the University of Washington.
References
- [Alonso et al. (2004)] Alonso, M. S., Tissera, P. B., Coldwell, G., Lambas, D. G., 2004, MNRAS, 352, 1081
- [Alonso et al. (2006)] Alonso, M. S., Lambas, D. G., Tissera, P. B., Coldwell, G., 2006, MNRAS, 367, 1029
- [Alonso-Herrero et al. (2010)] Alonso-Herrero, A., Garcia-Marin, M., Rodriguez Zaurin, J., Monreal-Ibero, A., Colina, L., Arribas, S., 2010, A&A, 522, 7
- [Armus et al. (2009)] Armus, L., et al., 2009, PASP, 121, 559
- [Baldry et al. (2006)] Baldry, I. K., Balogh, M. L., Bower, R. G., Glazebrook, K., Nichol, R. C., Bamford, S. P., Budavari, T., 2006, MNRAS, 373, 469
- [Barton et al. (2007)] Barton, E. J., Arnold, J. A., Zentner, A. R., Bullock, J. S., Wechsler, R. H., 2007, ApJ, 671, 1538
- [Barton, Geller & Kenyon (2000)] Barton, E. J., Geller, M. J., & Kenyon, S. J., 2000, ApJ, 530, 660
- [Bergvall et al. (2003)] Bergvall, N., Laurikainen, E., Aalto, S., 2003, A&A, 405, 31
- [Bridge et al. (2007)] Bridge, C. R., et al., 2007, ApJ, 659, 931
- [Brinchmann et al. 2004] Brinchmann, J., Charlot, S., White, S. D. M., Tremonti, C., Kauffmann, G., Heckman, T., Brinkmann, J.,2004, MNRAS, 351, 1151
- [Canalizo & Stockton (2001)] Canalizo, G., & Stockton, A., 2001, ApJ, 555, 719
- [Chary & Elbaz (2001)] Chary, R., & Elbaz, D., 2001, ApJ, 556, 562
- [Chou et al. (2011)] Chou, R. C. Y., Bridge, C. R., Abraham, R. G., 2011, AJ, 141, 87
- [Cid-Fernandes et al. (2010)] Cid Fernandes, R., Stasinska, G., Schlickmann, M. S., Mateus, A., Vale Asari, N., Schoenell, W., Sodre, L., 2010, MNRAS, 403, 1036
- [Daddi et al. (2007)] Daddi, E., et al., 2007, ApJ, 670, 156
- [Daddi et al. (2010)] Daddi, E., et al., 2010, ApJ, 713, 686
- [Darg et al. (2010a)] Darg, D. W., et al., 2010a, MNRAS, 401, 1552
- [Darg et al. (2010b)] Darg, D. W., et al., 2010b, MNRAS, 401, 1043
- [Dasyra et al. (2008)] Dasyra, K. M., Yan, L., Helou, G., Surace, J., Sajina, A., Colbert, J., 2008, ApJ, 680, 232
- [Elbaz et al. (2007)] Elbaz, D., et al., 2007, A&A, 468, 33
- [Elbaz et al. (2011)] Elbaz, D., et al., 2011, A&A, 533, 119
- [Ellison et al. (2011)] Ellison, S. L., Nair, P., Patton, D. R., Scudder, J. M., Mendel, J. T., Simard, L., 2011a, MNRAS, 416, 2182
- [Ellison et al. (2011)] Ellison, S. L., Patton, D. R., Mendel, J. T., Scudder, J. M., 2011b, MNRAS, 418, 2043
- [Ellison et al. (2008)] Ellison, S. L., Patton, D. R., Simard, L., McConnachie, A. W., 2008 AJ, 135, 1877
- [Ellison et al. (2010)] Ellison, S. L., Patton, D. R., Simard, L., McConnachie, A. W., Baldry, I. K., Mendel, J. T., 2010, MNRAS 407, 1514.
- [Gomez et al. (2003)] Gomez, P., et al., 2003, ApJ, 584, 210
- [Goto (2005)] Goto, T., 2005, MNRAS, 360, 322
- [Hernandez Toledo, Dultzin-Hacyan & Sulentic (2001)] Hernandez Toledo, H. M., Dultzin-Hacyan, D., & Sulentic, J. W., 2001, AJ, 121, 1319
- [Howell et al. (2010)] Howell, J. H., et al., 2010, ApJ, 715, 572
- [Hwang et al. (2010)] Hwang, H. S., Elbaz, D., Lee, J. C., Jeong, W.-S., Park, C., Lee, M. G., Lee, H. M., 2010, A&A, 522, 33
- [Hwang et al. (2011)] Hwang, H. S., et al. 2011, A&A, 535, 60
- [Iwasawa et al. (2011)] Iwasawa, K., et al., 2011, A&A, 529, 106
- [Kauffmann et al. (2003)] Kauffmann, G., et al., 2003, MNRAS, 346, 1055
- [Kartaltepe et al. (2010)] Kartaltepe J. S., et al., 2010, ApJ, 721, 98
- [Kartaltepe et al. (2012)] Kartaltepe J. S., et al., 2012, ApJ, 757, 23
- [Kaviraj (2009)] Kaviraj, S., 2009, MNRAS, 394, 1167
- [] Kennicutt, R.C. 1998, ARA&A, 36, 189
- [Kennicutt & Evans (2012)] Kennicutt, R.C., Evans, N. J., 2012, ARA&A, in press
- [Kennicutt et al. (1987)] Kennicutt, R. C., Jr., Roettiger, K. A., Keel, W. C., van der Hulst, J. M., Hummel, E., 1987, AJ, 93, 1011
- [Kim & Sanders (1998)] Kim, D.-C., & Sanders, D. B., 1998, ApJS, 119, 41
- [Koss et al. (2012)] Koss, M., Mushotzky, R., Treister, E., Veilleux, S., Vasudevan, R., Trippe, M., 2012, ApJ, 746, L22
- [Lambas et al. (2012)] Lambas, D. G., Alonso, S., Mesa, V., O’Mill, A. L., 2012, A&A, 539, 45
- [Lambas et al. (2003)] Lambas, D. G., Tissera, P. B., Alonso, M. S., Coldwell, G., 2003, MNRAS, 346, 1189
- [Le Floch et al. (2007)] Le Floc’h, E., et al., 2007, ApJ, 660, L65
- [Lee et al. (2012)] Lee, J. C., Hwang, H. Se., Lee, M. G., Kim, M., Lee, J. H., 2012, ApJ, in press
- [Li et al. (2008)] Li, C., Kauffmann, G., Heckman, T. M., Jing, Y. P., White, S. D. M., 2008, MNRAS, 385, 1903
- [Lin et al. 2007)] Lin, L., et al. 2007, ApJ, 660, L51
- [Lintott et al. (2008)] Lintott, C. J., et al., 2008, MNRAS, 389, 1179
- [Liu et al. 2012] Liu, X., Shen, Y., Strauss, M. A., 2012, ApJ, 745, 94
- [Lonsdale et al. (1984)] Lonsdale, C. J., Persson, S. E., Matthews, K., 1984, ApJ, 287, 95
- [Magnelli et al. (2009)] Magnelli, B., Elbaz, D., Chary, R. R., Dickinson, M., Le Borgne, D., Frayer, D. T., Willmer, C. N. A., 2009, A&A, 496, 57
- [Melbourne et al. (2008)] Melbourne, J., Ammons, M., Wright, S. A., Metevier, A., Steinbring, E., Max, C., Koo, D. C., Larkin, J. E., Barczys, M., 2008, AJ, 135, 1207
- [Melbourne, Koo & Le Floc’h (2005)] Melbourne, J., Koo, D. C., & Le Floc’h, E., 2005, ApJ, 632, L65
- [Mendel et al. (2013)] Mendel, J. T., Palmer, M. J. D., Simard, L., Ellison, S. L., Patton, D. R., ApJS, submitted
- [Nardini et al. (2010)] Nardini, E., Risaliti, G., Watabe, Y., Salvati, M., Sani, E., 2010, MNRAS, 405, 2505
- [Nikolic, Cullen & Alexander (2004)] Nikolic, B., Cullen, H., Alexander, P., 2004, MNRAS, 355, 874
- [Noeske et al. (2007)] Noeske, K. G., et al., 2007, ApJ, 660, L43
- [Nordon et al. (2012)] Nordon, R., et al., 2012, ApJ, 745, 182
- [Patton & Atfield (2008)] Patton, D. R., & Atfield, J. E., 2008, ApJ, 685, 235
- [Patton et al. (2011)] Patton, D. R., Ellison, S. L., Simard, L., McConnachie, A. W., Mendel, J. T., 2011, MNRAS, 412, 591
- [Perez et al. (2009)] Perez, M. J., Tissera, P. B., Blaizot, J., 2009, MNRAS, 397, 748
- [Petric et al. (2011)] Petric, A. O., et al., 2011, ApJ, 730, 28
- [Ramos Almeida et al. (2011)] Ramos Almeida, C., Tadhunter, C. N., Inskip, K. J., Morganti, R., Holt, J.; Dicken, D., 2011, MNRAS, 410, 1550
- [Ramos Almeida et al. (2012)] Ramos Almeida, C., Bessiere, P. S., Tadhunter, C. N., Perez-Gaonzalez, P. G., Barro, G., Inskip, K. J., Morganti, R., Holt, J.; Dicken, D., 2012, MNRAS, 419, 687
- [Robaina et al. (2009)] Robaina, A., et al., 2009, ApJ, 704, 324
- [Rodighiero et al. (2011)] Rodighiero, G., et al. 2011, 2011, ApJ, 739, L40
- [Rovilos et al. (2012)] Rovilos, E., et al. 2012, A&A in press
- [Salim et al. (2007)] Salim, S., et al, 2007, ApJS, 173, 267
- [Sanders et al. (2003)] Sanders, D. B., Mazzarella, J. M., Kim, D.-C., Surace, J. A., Soifer, B. T., 2003, AJ, 126, 1607
- [Sanders & Mirabel (1996)] Sanders, D. B., & Mirabel, I. F., 1996, ARA&A, 34, 749
- [Sargent et al. (2012)] Sargent, M. T., Bethermin, M., Daddi, E., Elbaz, D., 2012, ApJ, 747, L31
- [Scudder et al. (2012)] Scudder, J. M., Ellison, S. L., & Mendel, J. T., 2012, MNRAS, 423, 2690
- [Scudder et al. (2012)] Scudder, J. M., Ellison, S. L., Torrey, P., Patton, D. R., Mendel, J. T., 2012, MNRAS, 426, 549
- [Silverman et al. (2011)] Silverman, J. D., et al. 2011, ApJ, 743, 2
- [Simard et al. (2011)] Simard, L., Mendel, J. T., Patton, D. R., Ellison S. L., McConnachie, A. W., 2011, ApJS, 196, 11
- [Smith et al. (2007)] Smith, B. J., Struck, C., Hancock, M., Appleton, P. N., Charmandaris, V., Reach, W. T., 2007, AJ, 133, 791
- [Stasinska et al. (2006)] Stasinska, G., Cid Fernandes, R., Mateus, A., Sodre, L., Asari, N. V., 2006, MNRAS, 371, 972
- [Tekola et al. (2012)] Tekola, A. G., Vaisanen, P., Berlind, A., 2012, MNRAS, 419, 1176
- [Telesco et al. (1988)] Telesco, C. M., Wolstencroft, R. D., Done, C., 1988, ApJ, 329, 174
- [van den Bosch et al. (2008)] van den Bosch, F. C., Aquino, D., Yang, X., Mo, H. J., Pasquali, A., McIntosh, D. H., Weinmann, S. M., Kang, X., 2008, MNRAS, 387, 79
- [Veilleux, Kim & Sanders (2002)] Veilleux, S., Kim, D.-C., Sanders, D. B., 2002, ApJS, 143, 315
- [Wang & Rowan-Robinson (2009)] Wang, L., Rowan-Robinson, M., 2009, MNRAS, 398, 109
- [Wang et al. (2006)] Wang, J. L., Xia, X. Y., Mao, S., Cao, C., Wu, Hong, Deng, Z. G., 2006, ApJ, 649, 722
- [Wong et al. (2011)] Wong, K. C., et al., 2011, ApJ, 728, 119
- [Woods et al. (2006)] Woods, D. F., Geller, M. J., Barton, E. J., 2006, AJ, 132, 197
- [Woods et al. (2010)] Woods, D. F., Geller, M. J., Kurtz, M. J., Westra, E., Fabricant, D. G., Dell’Antonio, I., 2010, AJ, 139, 1857
- [Wuyts et al. (2011)] Wuyts, S., et al., 2011, ApJ, 738, 106
- [Xu et al. (2012)] Xu, C. K., et al., 2012, ApJ, accepted
- [Xu & Sulentic (1991)] Xu, C. K., Sulentic, J. W., 1991, ApJ, 374, 407
- [Xu et al. (2000)] Xu, C. K., Gao, Y., Mazzarella, J., Lu, N., Sulentic, J. W., Domingue, D. L., 2000, ApJ, 541, 644
- [Yuan et al. (2010)] Yuan, T.-T., Kewley, L. J., Sanders, D. B., 2010, ApJ, 709, 884
- [Zheng et al. (2004)] Zheng, X. Z., Hammer, F., Flores, H., Assemat, F., Pelat, D., 2004, A&A, 421, 847
- [Zhu et al. (2008)] Zhu, Y.-N., Wu, H., Cao, C., Li, H.-N., 2008, ApJ, 686, 155