A Two-Phase Low-velocity Outflow in the Seyfert 1 Galaxy Ark 564
Abstract
The Seyfert 1 galaxy Ark 564 (catalog ) was observed with Chandra high energy transmission gratings for 250 ks. We present the high resolution X-ray spectrum that shows several associated absorption lines. The photoionization model requires two warm absorbers with two different ionization states ( and ), both with moderate outflow velocities (100 km s-1) and relatively low line of sight column densities ( and cm-2). The high ionization phase produces absorption lines of O vii, O viii, Ne ix, Ne x, Mg xi, Fe xvii and Fe xviii while the low ionization phase produces lines at lower energies (O vi & O vii). The pressure–temperature equilibrium curve for the Ark 564 (catalog ) absorber does not have the typical “S” shape, even if the metallicity is super-solar; as a result the two warm-absorber phases do not appear to be in pressure balance. This suggests that the continuum incident on the absorbing gas is perhaps different from the observed continuum. We also estimated the mass outflow rate and the associated kinetic energy and find it to be at most of the bolometric luminosity of Ark 564 (catalog ). Thus it is highly unlikely that these outflows provide significant feedback required by the galaxy formation models.
1 Introduction
Outflows are ubiquitous in AGNs, manifested by high-ionization absorption lines in X-rays and UV (Reynolds 1997, Crenshaw et al. 2003, and references therein) and are perhaps related to the accretion process (e.g., Proga 2007). Understanding outflows is therefore as important as understanding accretion itself. The X-ray absorbers, commonly known as warm absorbers (WAs), have typical ionization parameter 111The ionization parameter , where is the ionizing luminosity between 1 Ryd and 1000 Ryd (1 Ryd=13.6 eV), n is the number density of the material and r is the distance of the gas from the central source. of erg s-1, a column density of cm-2 and an outflow velocity of km s-1, produced by warm ionized gas ( K; Krongold et al. 2003). The WAs are usually detected in the keV soft X-ray band by absorption lines of Oxygen (O viii, O vii, O vi), Iron (Fe vii-xii and Fe xvii-xxii), and other highly ionized elements. Transitions by C iv, N v, and O vi are observed in both the X-ray and UV spectra of these sources with similar outflow velocities, suggesting a connection between the narrow absorption line systems in the UV and the X-rays WA (Mathur et al. 1994; 1995, Kaspi et al. 2002, Krongold et al. 2003).
Several phenomenological models have tried to explain AGN warm absorber spectra showing multiple velocity components of multiple lines, and after years of effort a consensus is growing. In majority of the cases, if not all, physical properties and kinematics of the absorber are well determined and it can be described by at least two discrete ionization components (Detmers et al. 2011, Holczer & Behar 2012). These components are consistent with the same outflow velocity and appear to be in pressure equilibrium, and so likely emerge from a multiphase wind (e.g., Krongold et al. 2003; 2005; 2007, Netzer et al. 2003, Cardaci et al. 2009, Andrade-Velazquez et al. 2010). The low-ionization phase (LIP) of the wind produces UV and X-ray absorption lines, but the high-ionization phase (HIP) is seen only in X-rays.
Despite ubiquitous detection and successful modeling of WA spectra by multiple absorbing components, very little is still known about their geometry and dynamical strength. Where do these outflows originate? Proposed locations span a wide range, of a factor of in radial distance from the central ionizing source: the accretion disk (as suggested by the accretion disk wind models; Proga & Kallman 2004), the broad line region (Kraemer et al. 2005), the obscuring torus (Dorodnitsyn et al. 2008, Krolik & Kriss 2001, Blustin et al. 2005) and to the narrow line region (Behar et al. 2003, Crenshaw et al. 2009). In principle, these outflows could potentially provide a common form of AGN feedback required by theoretical models of AGN-galaxy formation (Silk & Rees 1998, Wyithe & Loeb 2003, Fabian 2012, and references therein), although estimating their mass outflow rate and the kinetic energy outflow rate depends critically on the location of WAs. Some recent studies of WAs found that the typical outflow velocity is a small fraction of the escape velocity and that WAs do not carry sufficient mass/energy/momentum to be efficient agents of feedback (Mathur et al. 2009, Krongold et al. 2007; 2010).
With the goal of self consistent analysis and modeling of grating spectra of WAs, we present here the results of our analysis of Chandra archival data of Ark 564 (catalog ). The analysis of one Chandra observation of this source done in 2000 (50 ks) has been published by Matsumoto et al. (2004); here we present new data of the three 2008 Chandra observations (250 ks total).
2 Ark 564
Ark 564 (catalog ) is a bright, nearby, narrow-line Seyfert 1 (NLS1) galaxy, with , mag (de Vaucouleurs et al. 1991), and ergs s-1 (Turner et al. 2001, Matsumoto et al. 2004, and present work). It has been studied across all wavebands (e.g., Turner et al. 2001, Collier et al. 2001, Shemmer et al. 2001, Romano et al. 2004) and shows large amplitude flux variations on short time scales and a peculiar emission line-like feature near keV (Leighly et al. 1999, Turner et al. 2001, Comastri et al. 2001). Matsumoto et al. analyzed the Chandra HETGS observation of Ark 564 (catalog ) (that carried out in 2000) with an exposure time of ks. They modeled the hard X-ray spectrum with a power law of photo-index of and fit the soft excess below keV with a blackbody, of temperature keV. They find some evidence for a two phase WA with ionization parameters and and column density of cm-2. They find that the keV emission feature is not due to blends of several narrow emission lines and suggest that it could be an artifact of the warm absorber. Brinkmann et al. (2007) studied the spectral variability of the X-ray emission of the Ark 564 (catalog ) using the ks XMM-Newton observation and find that the “power law plus bremsstrahlung” model describes the spectrum well at all times, with flux variations of both components.
Papadakis et al. (2007) analyzed the XMM-Newton EPIC data from Ark 564 (catalog ) 2005 observations. They found evidence for two phases of photoionized X-ray absorbing gas with ionization parameter and and column densities of and cm-2, similar to the results of Matsumoto et al. (2004). They also detect an absorption line at keV in the low resolution CCD spectra and assuming that this line corresponds to Fe xxvi , they suggest the presence of highly ionized, absorbing material of cm-2 outflowing with relativistic velocity of .
Analyzing both the EPIC and RGS data from the same XMM-Newton 2005 observations, Dewangan et al. (2007) find two warm absorber phases with ionization parameters and and column densities of and cm-2 and outflow velocities of and km s-1 respectively.
Smith et al. (2008) analyzed the combined XMM-Newton RGS spectrum of Ark 564 (catalog ) obtained from 2000 to 2005. They found three separate phases of photoionized X-ray absorbing gas, with ionization parameters and column densities of cm-2 respectively, all with very low velocity (km s-1). From the emission line analysis they found a flow velocity of km s-1 and claimed that the X-ray absorption and emission originate in different regions.
3 Observations and Data Reduction
Ark 564 (catalog ) was observed with the Chandra High Energy Transmission Grating Spectrometer (HETGS) on 2000 June for ks and between 2008 August 26 to 2008 September 6 for total duration of ks. It was also observed with Low Energy Transmission Grating Spectrometer (LETGS) on 2008 April 21 for 100 ks. Table 1 lists the observation log. Matsumoto et al. analyzed and presented the results of the ks Chandra HETG observation done in 2000 June. Here we report on the Chandra archival 2008 observations of Ark 564 (catalog ) made with both HETGS and LETGS.
The HETGS consists of two grating assemblies, a high-energy grating (HEG) and a medium-energy grating (MEG). The HEG bandpass is keV and the MEG bandpass is keV but the effective area of both instruments falls off rapidly at either end of the bandpass. We performed the spectral analysis over Årange. The LETG is combined with the Advanced CCD Imaging Spectrometer-Spectroscopic (ACIS-S) array or with the High Resolution Camera-Spectroscopic (HRC-S) array. The Ark 564 (catalog ) LETG observation was done with HRC-S array. The LETG/HRC-S has a band pass of keV or Å, but due to the low S/N of data on either ends, we restricted our spectral fitting to .
We reduced the data using the standard Chandra Interactive Analysis of Observations (CIAO) software (v4.3) and Chandra Calibration Database (CALDB, v4.4.2) and followed the standard Chandra data reduction threads222http://cxc.harvard.edu/ciao/threads/index.html. For the Chandra ACIS/HETG observations, we co-added the negative and positive first-order spectra and built the effective area files (ARFs) for each observation using the fullgarf CIAO script. Unlike ACIS, the HRC does not have the energy resolution to sort individual orders, and each spectrum contains contributions from all the diffraction orders. For the HRC/LETG observation we used the standard ARF files of orders 1 through 6 and convolved them with the relevant standard redistribution matrix files (RMF).
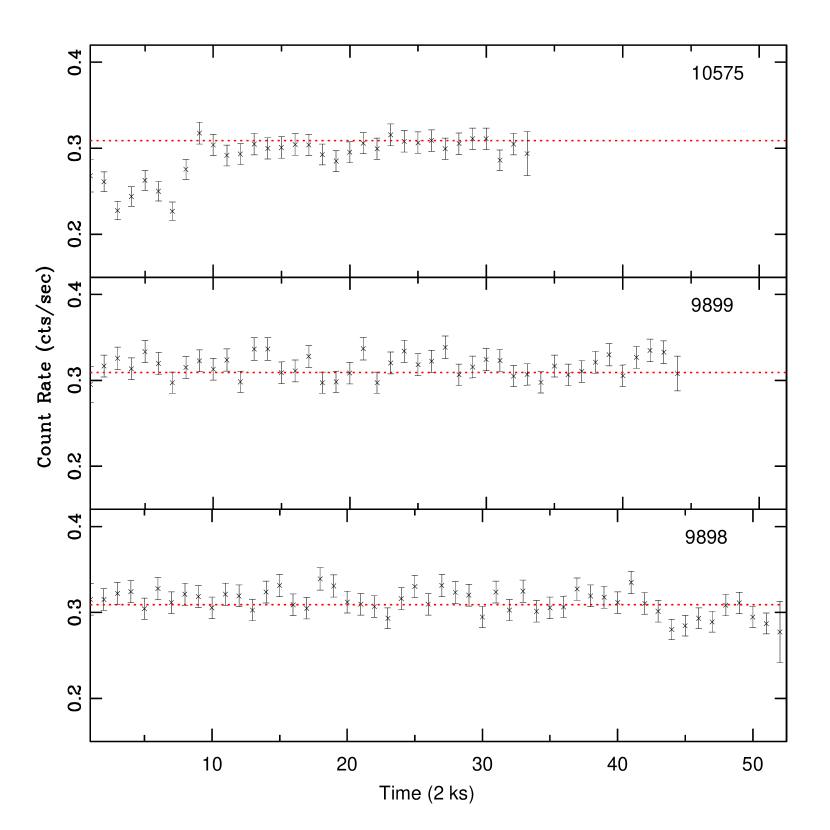
For HETG observations, we generated the light curves in ks bins for the energy band (keV), as shown in figure 1. The time-average count rate varies from cts s-1 to cts s-1 among observations. However, except for the initial ks of obsID 10575, the count rate of all observations are consistent with each other, with average value of cts s-1.
We analyzed the spectra using the CIAO fitting package Sherpa. As noticed above, the HETG observations do not show large variations, so to increase the signal to noise (S/N) of the spectrum we co-added the spectra obtained with each observation and averaged the associated ARFs using the ciao script add_grating_spectra. This gave a total net exposure time of ks for the MEG and HEG. We fit the MEG and HEG data simultaneously, and discuss the LETG spectral analysis separately in section 5. Throughout the paper we applied the minimization technique in the spectral analysis and the reported errors are of significance for one interesting parameter.
4 HETG Spectral Analysis
4.1 Continuum Modeling
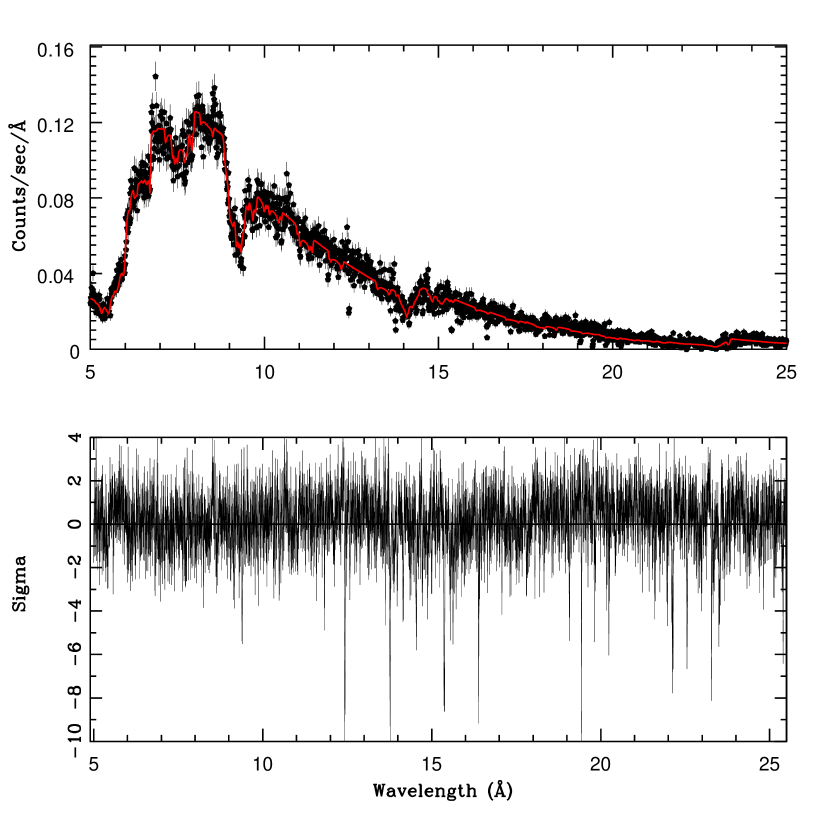
To model the intrinsic continuum of the source, we first fitted a simple absorbed (Galactic cm-2; Dickey et al. (1990)) power law with varying photon index and amplitude. A single absorbed power law could not fit the data over the entire range. We found an excess of flux in the spectrum at energies below keV. Ark 564 (catalog ) is known to have a strong soft continuum (Leighly et al. 1999, Turner et al. 1999), so to fit this soft excess we added a black-body component to the above mentioned simple power-law. The fit improved significantly (, ) and figure 2 shows the continuum model fit to the MEG spectrum. We also plot the data:fit residuals, which show strong absorption features consistent with the known WA of this source.
4.2 Local Absorption
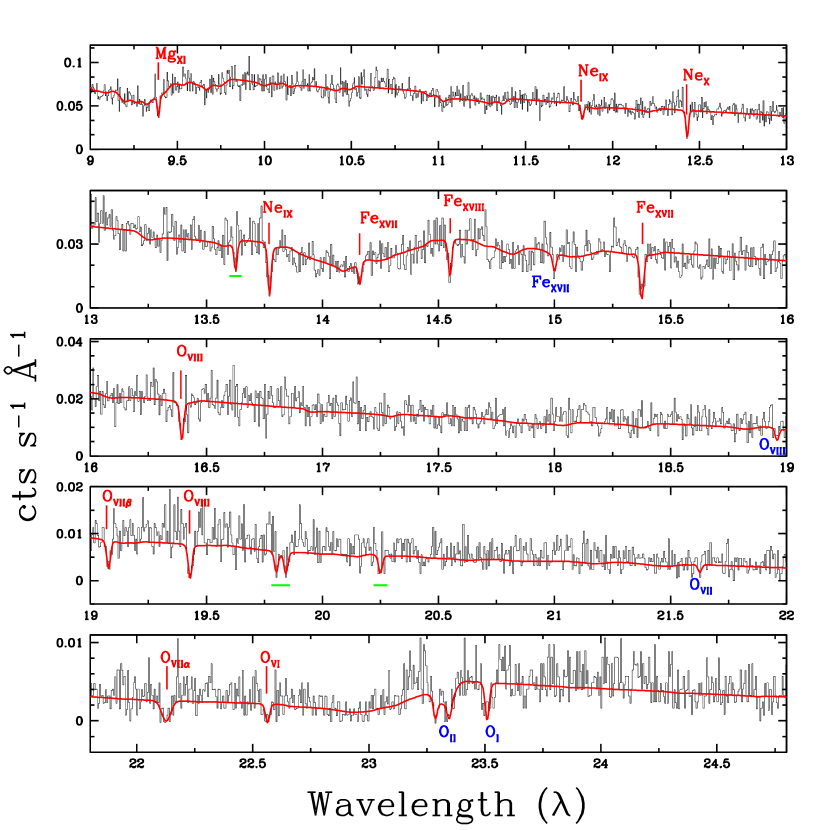
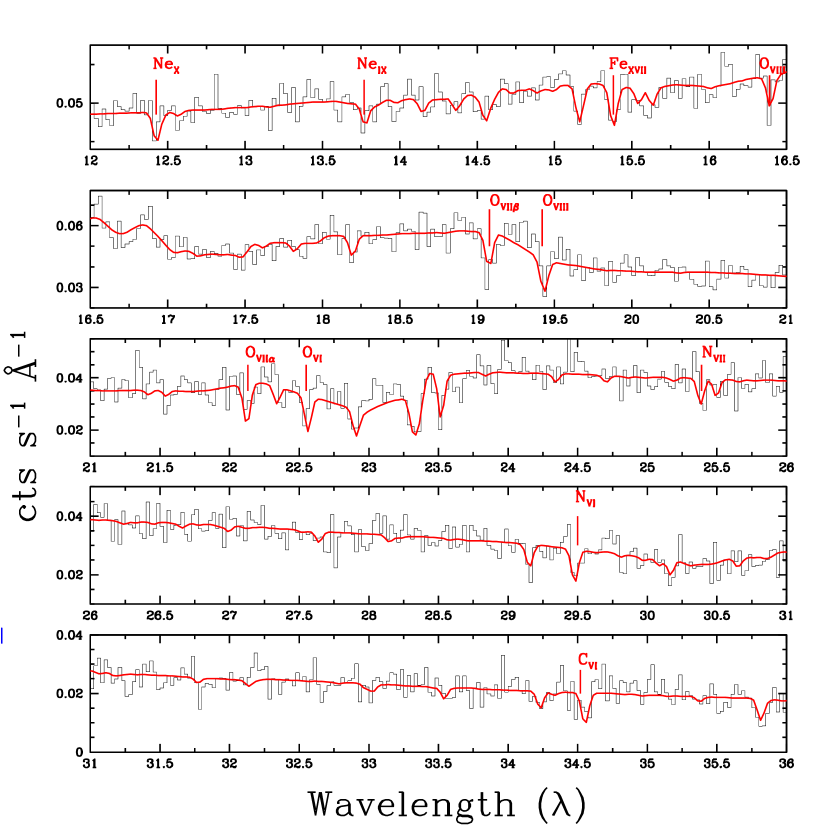
The spectra of Ark 564 (catalog ) show narrow absorption lines at zero redshift. The O i and O ii absorptions are attributed to the ISM (Wilms et al. 2000) and O vii, O viii and Fe xvii absorption lines arise in the circumgalactic medium (CGM) of our Galaxy or in the Local Group (Gupta et al. 2012, and references therein). We modeled all the statistically significant local absorption features with Gaussian components of fixed width of 1 mÅ; the line response function of the grating is folded in the RMF file in each case. The model of continuum plus local absorption features (“Model A”) improves the fit by for 10 fewer degrees of freedom. The measured equivalent width (EW) and statistical significance of each line are reported in Table 2 and labeled in figure 3.
4.3 Intrinsic Absorption
As reported above, the Ark 564 (catalog ) spectrum shows many strong intrinsic absorption features. We measured the position, EW and statistical significance of all intrinsic absorption lines by fitting negative Gaussians of fixed width of mÅ(Fig. 3, Table 2). All the Ark 564 (catalog ) absorption features are blueshifted with respect to the source, implying moderate outflow velocities of km s-1. We find a few lines with no identification at , and in the observer frame. We marked these features with green underlines in figure 3.
4.4 Photoionization model fitting: PHASE
We used the Photoionization model fitting code PHotoionized Absorption Spectral Engine (PHASE; Krongold et al. 2003), to model the warm absorber features. The PHASE code self consistently models all the absorption features observed in the X-ray spectra of AGNs. At its simplest, an absorption-line spectrum can be fit with PHASE using only four input parameters: 1) the ionization parameter of the absorber ; 2) the equivalent hydrogen column density ; 3) the outflow velocity of the absorbing material ; and 4) the micro-turbulent velocity of the material. The abundances have been set at the Solar values (Grevesse et al. 1993). We used the Ark 564 (catalog ) spectral energy distribution (SED) from Romano et al. (2004) to calculate the ionization balance of the absorbing gas in PHASE. The SED constructed by Romano et al. is based on a quasi-simultaneous multiwavelength campaign, and thus is the most accurate overall SED for this source obtained to date. In the X-rays, however, we use our own fits, as this radiation is the one responsible for the ionization of the charge states producing absorption in the X-ray band during our observations. We further connect the UV and the X-ray data with a simple power law (a straight line in log-log space connecting the last UV point and the first X-ray point).
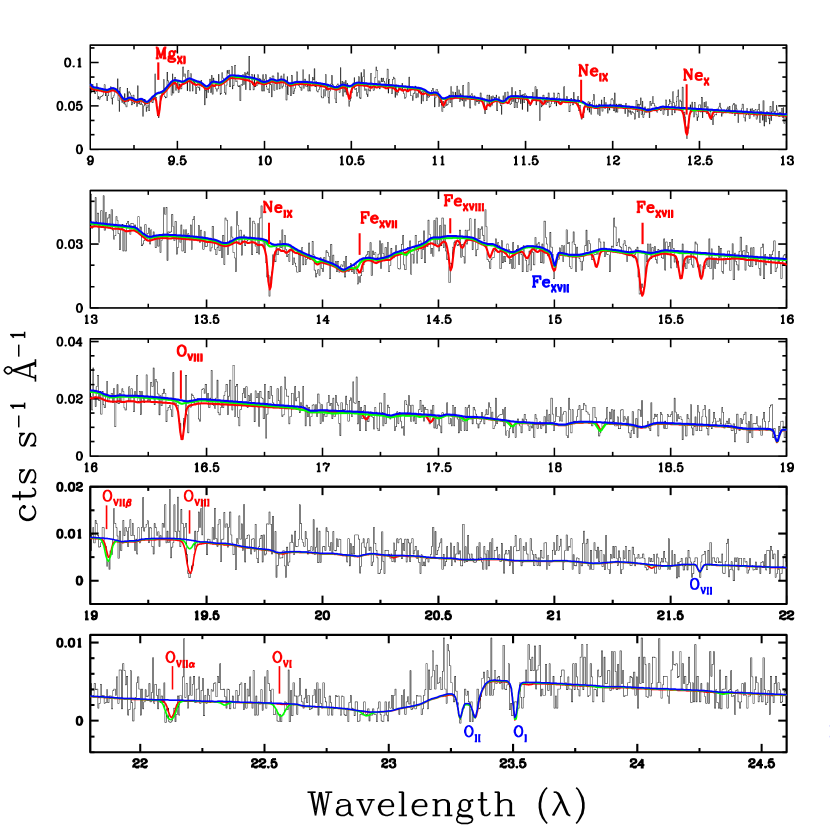
The most prominent absorption lines in the HETGS Ark 564 (catalog ) spectrum are those of Mg xi, Ne x, Ne ix, Fe xvii, Fe xviii, O viii, O vii and O vi at an outflow velocity of km s-1. We add a single ionized absorbing component to Model A described above (we call it Model B) to characterize this WA component. This absorber has best fit parameters of , cm-2, and an outflow velocity relative to systemic of km s-1. The fit gives a significant improvement over model A (Fig. 4; , ). This absorber fits the high ionization lines so we will refer to this absorber as the “high-ionization phase (HIP)” component. The HIP component fits the absorption features produced by ions such as Mg xi, Ne x, Ne ix, Fe xviii, Fe xvii, O viii, and O vii . Matsumoto et al. (2004) also report an absorber of similar characteristics: ionization parameter and absorption column cm-2, derived using the column densities of O viii, Ne ix, Ne x and Mg xi.
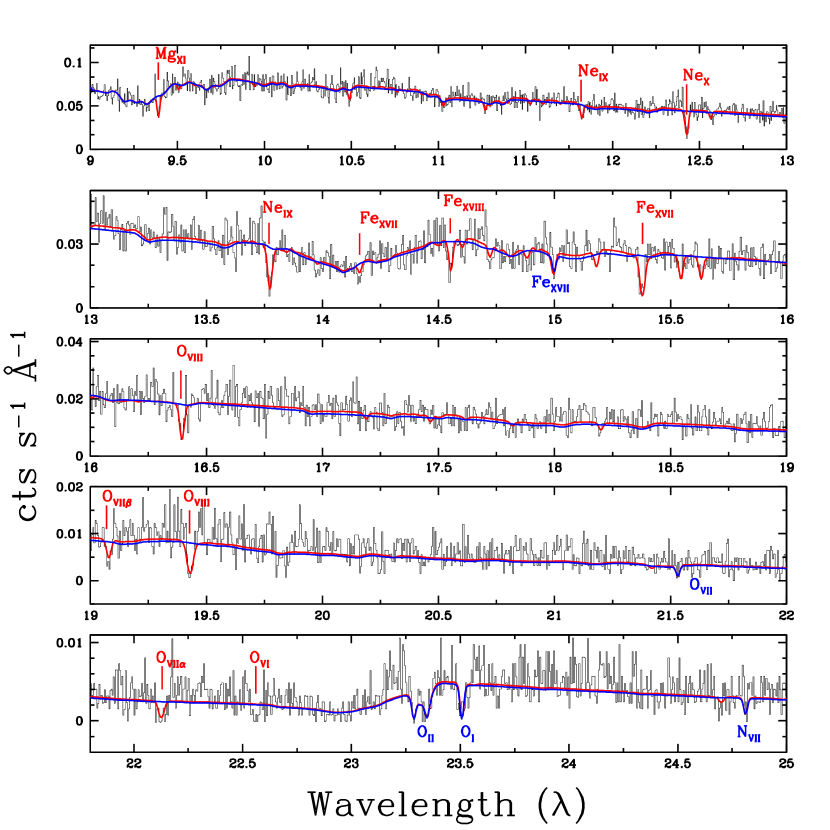
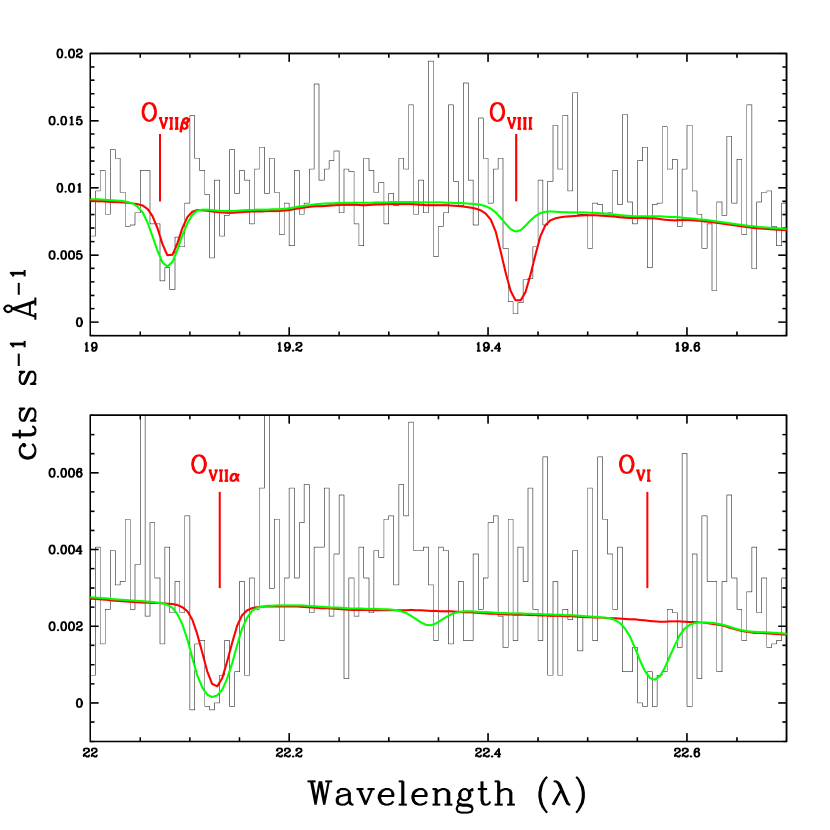
The single-absorber model does not fit the O vi absorption line and it also under-predicts the O vii absorption (Fig. 5, red curve). This suggests the presence of another absorber with lower ionization state. To fit the residual features we added another absorber to our previous model defining Model C. An absorber with ionization parameter , cm-2, and an outflow velocity of km s-1 successfully fits the low ionization lines, including O vi and O vii (Fig. 5 & Fig. 6). We call this component “lower-ionization phase (LIP)” absorber. This model gives a ; , significantly improving over the single-absorber model B. An F-test gives a higher than % confidence for the presence of this absorber. The ionic column densities predicted by our best fit two-ionized absorber model (Model C) are listed in Table 4. As can be inferred from Table 4, except for O vii, the LIP and HIP components predict absorption from different ions but at similar velocities. This suggest that the Ark 564 (catalog ) absorbers may be present in the same outflowing multi-phase medium. We come back to this in section 6.3.
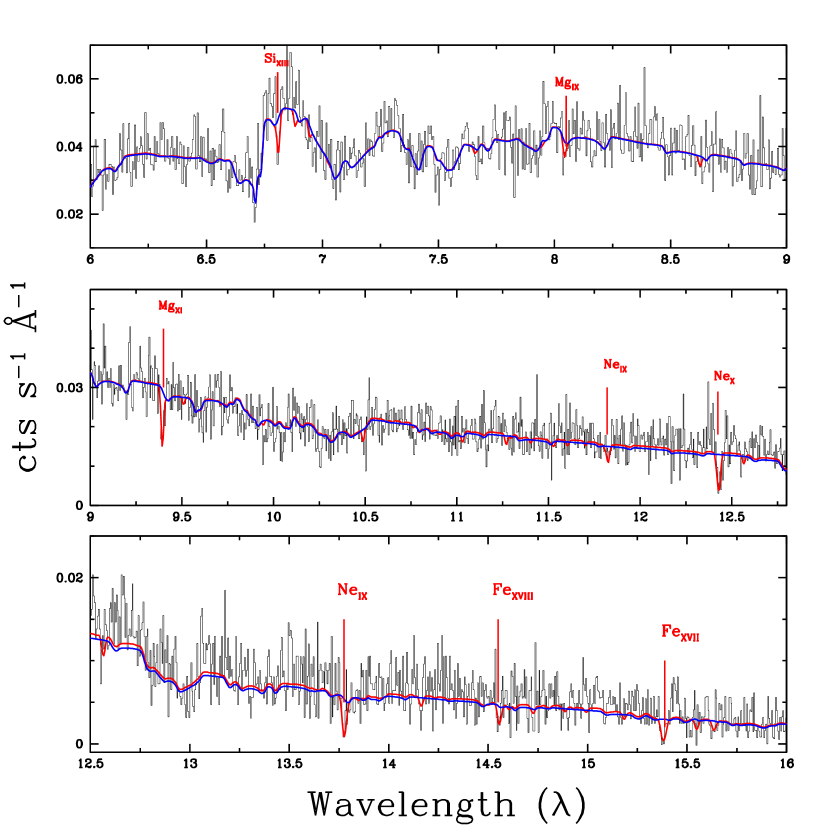
To extrapolate the two component ionized absorber model of the MEG spectrum of Ark 564 (catalog ) to lower wavelengths, we simultaneously fit the HEG and MEG spectra (Table 3, Fig. 7). The HEG intrinsic absorption features are well fitted with HIP absorber, including Si xiii and Mg ix lines which were not detected in the MEG spectrum due to low signal to noise. The best-fit model parameters of the MEGHEG fit are consistent with the MEG-only fit.
Though most of the Ark 564 (catalog ) intrinsic absorption features are well fitted with two warm absorbers, the model does not fit the unidentified absorption lines mentioned in section 4.3. The identification, evaluation and interpretation of these features is be discussed in detail in a companion paper (Gupta et al. 2013b).
5 LETGS Spectral Analysis
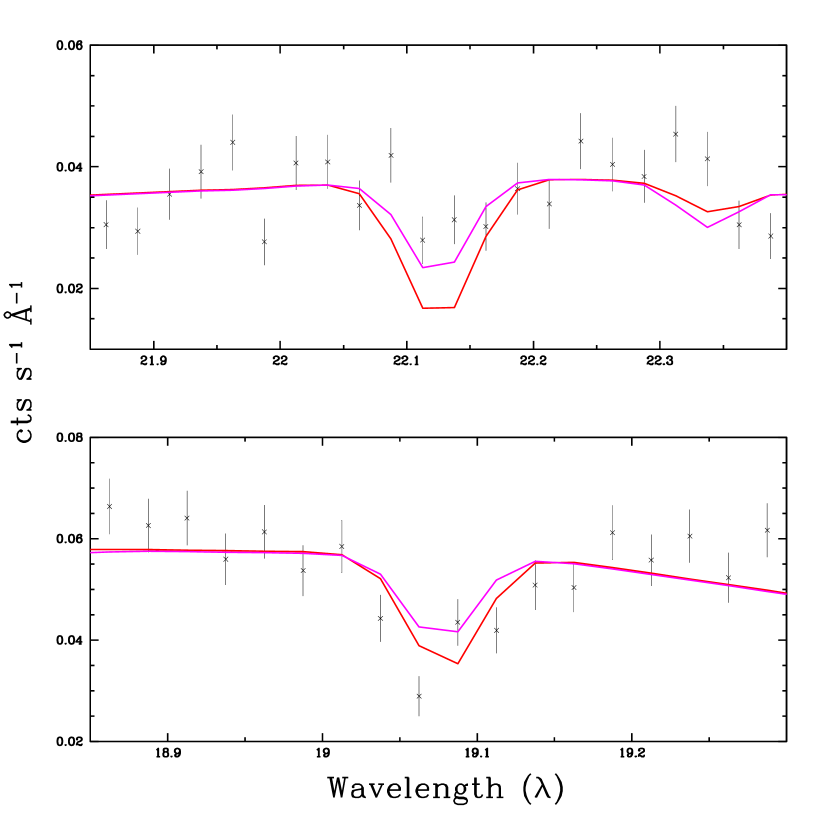
Ark 564 (catalog ) was also observed with LETGS in April 2008. Ramirez (2013) analyzed that observation and found a very weak absorption line of O vii K but a strong feature at (at the wavelength of O vii K). For this reason they identified the absorption feature at as blueshifted O viii K with velocity km s-1. They further modeled the spectral region with two high ionization absorbing components with , one at km s-1 and one at km s-1. Since we found no evidence of an outflow with velocity km s-1 in the HETGS spectra, we reanalyzed the LETGS observation to check for the consistency with our model derived from the HETG data.
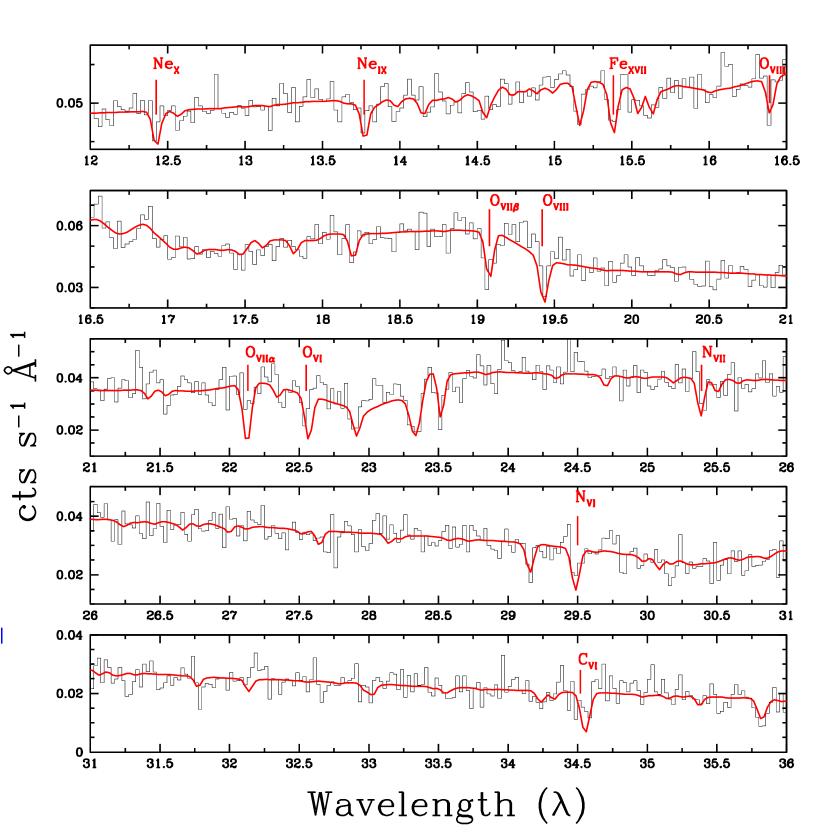
To fit the Ark 564 (catalog ) LETGS spectrum continuum, we used the same model as for HETG data (a power law plus black-body). The best fit power law photon-index and temperature of black-body are reported in Table 3. We observed that the flux (keV) of the source varied from erg scm-2 to erg scm-2 between the HETG and LETG observations. To fit the intrinsic absorption features, we start with the two component ionized absorber model obtained for HETG spectra. This model fits the absorption features of Fe xviii, Fe xvii, Ne x, Ne ix reasonably well, but overestimates the O vii k line strength (; Fig. 8 & Fig. 9). Allowing the PHASE parameters to vary freely, the fit improved considerably (; Fig. 10). The best fit parameters of LETGS WA model are reported in Table 3. This model fits the narrow absorption due to O vii , but leaves the residuals at , corresponding to O vii (Fig. 9). We also tried to fit the LETG spectrum with models suggested by Ramirez2010, but the fit was not good (). Though this model well fits the line at 19.1 Å(observed frame), it also predicts other absorption lines which are inconsistent with the data. As noted by Ramirez2010, the absorption line at is too strong to be by O vii and could be, in part, due to a transient high velocity outflow component (Gupta et al. 2013b, companion paper).
Between the LETG and HETG warm absorber models, the HIP component parameters are consistent within errors. However, the LETG LIP has lower ionization parameter and higher column in comparison to HETG LIP. We also note that the column densities of highly ionized ions (O viii, Fe xvii, Fe xviii, Ne ix, Ne x, Mg xi, Mg xii and Si xii) are higher while for those of less ionized ions (O vii and O vi) are smaller in the HETG observation than in LETG (Table 4). Both the instruments have good response in the spectral region where these lines are detected, so the observed differences cannot be due to instrumental artifacts; what is observed is the real variability in the WA properties between the two observations from 2008 April (LETG) to August/September (HETG).
6 Discussion
6.1 The Connection between UV and X-ray Absorbers
Ark 564 (catalog ) was observed with HST (STIS) and FUSE during May-July 2000 and June 2001 respectively. Crenshaw et al. (2002) and Romano et al. (2002) detected intrinsic absorption lines blueshifted by km s-1 and km s-1 respectively, similar to that of the X-ray WAs. Crenshaw et al. modeled the UV data with a single absorber of ionization parameters of and column density of cm-2. The UV absorption model also predicted the column densities of O vii and O viii of cm-2 and cm-2 respectively (Romano et al. 2002). The O vii column density measured from the X-ray WA models cm-2 is consistent with UV upper limits. The total HIPLIP O viii column density of cm-2 is an order of magnitude higher than the UV estimates. However, the LIP O viii column density cm-2 is in agreement with UV models. The consistency between the X-ray LIP absorber outflow velocity, hydrogen column density, and ionic column densities with the UV absorber model suggests that both are the same absorber. The HIP absorber, on the other hand, is different from the UV absorber, as expected.
Romano et al. from FUSE observations of Ark 564 (catalog ) measured the intrinsic O vi column density of cm-2. The upper limit on O vi column density measured from UV data is much smaller than our lower limit on O vi column of cm-2 in X-rays. This could be due to the variability of the WA between the two observations. We note, however, that X-ray and UV O vi column densities have been found to be discrepant in other AGN absorption systems (e.g., Krongold et al. 2003) and in redshift zero absorption (Williams et al. 2006).
6.2 Estimates on mass and energy outflows rates
Using the values of warm-absorber parameters such as column density, ionization parameter and outflowing velocities, we can give a rough estimate of the mass outflow rate () and the kinetic energy carried away by the warm absorbing winds (i.e. kinetic luminosity, ). But before we can measure the mass and energy outflow rates, we must know the location of the absorber. However, in the equation for the photoionization parameter (), the radius of the absorbing region (R) is degenerate with the density (). In principle we can put constraints on the distance by measuring the density of the WA with variability analysis (e.g., Krongold et al. 2007). Using this technique, Krongold et al. managed to determine the absorber density in NGC4051 and so the distance. For Ark 564 (catalog ), no such study is available in literature and in the present work the source does not show any significant variability either. Therefore, we will only set limits on the mass and energy outflow rates using the expression derived in Krongold et al., .
The estimate of maximum distance from the central source can be derived assuming that the depth of the absorber is much smaller than the radial distance of the absorber () and using the definition of ionization parameter (), i.e. . In several papers lower limit on the absorber distance was determined assuming that the observed outflow velocity is larger than the escape velocity at : i.e. . However, as shown in Mathur et al. (2009) WA outflow velocities are usually lower than the escape velocities, so cannot really be used to derive a lower limit on . Using the best fit values of ionization parameter and column density, we estimated the upper limits on HIP and LIP absorber locations of pc and kpc respectively, which are not very interesting limits. Using the above equation and outflow velocities of 94 km s-1 and 137 km s-1, we obtain the mass outflow rates of g s-1 and g s-1 for HIP and LIP absorbers respectively. Similarly we obtained the constraints on kinetic luminosity of the outflows of erg s-1 and erg s-1 for the HIP and LIP absorbers respectively.
In comparison to the Ark 564 (catalog ) bolometric luminosity of erg s-1 (Romano et al. 2002), the total kinetic luminosity of these outflows is % for the HIP and for the LIP. Thus it is very unlikely that these outflows significantly affect the local environment of the host galaxy. The AGN feedback models typically required % of the bolometric luminosity of an AGN to be converted into kinetic luminosity to have a significant impact on the surrounding environment (Hopkins & Elvis 2010, Silk & Rees 1998, Scannapieco & Oh 2004).
6.3 Pressure Balance between LIP and HIP
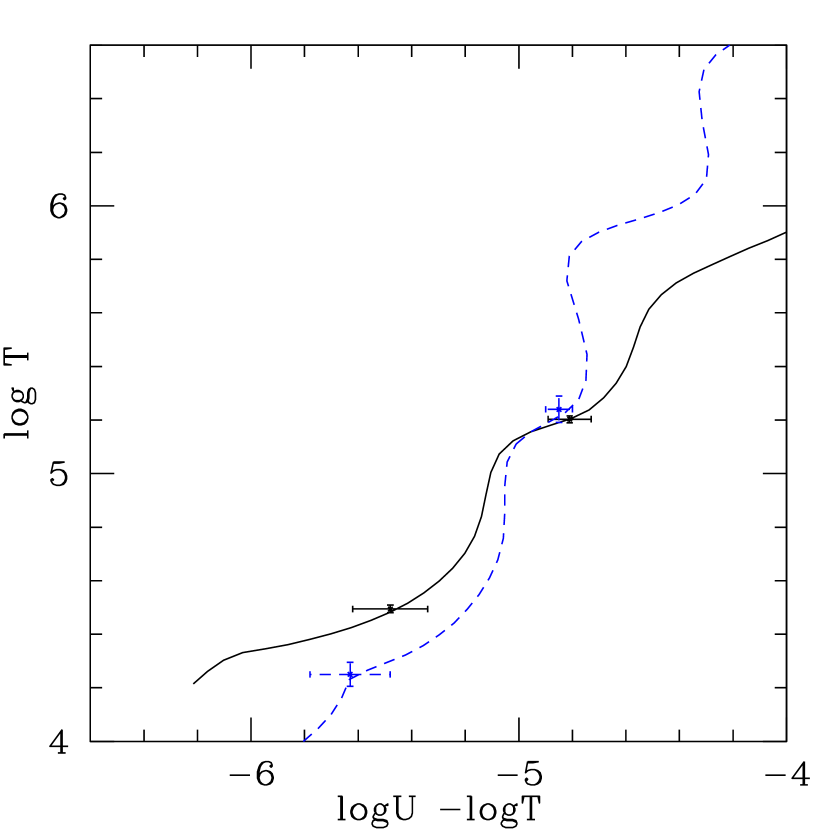
The presence of two different absorbing components with different temperatures but similar outflow velocity suggests that the absorber could arise from two phases of the same medium (e.g., Elvis et al. 2000, Krongold et al. 2003). This is further supported by the fact that multiple components of the ionized absorber are found in pressure balance (e.g., Krongold et al. 2003; 2005; 2007, Cardaci et al. 2009, Andrade-Velazquez et al. 2010, Zhang et al. 2010). This result has proven valid against different methodologies and codes used in the analysis (Krongold et al. 2013). To investigate whether or not the absorbing components of Ark 564 are in pressure balance, we generated the pressure-temperature equilibrium curve (also known as the “S-curve” (Krolik et al. 1981), for the SED used in our analysis: Fig. 11). Interestingly, we find that the equilibrium curve of Ark 564 (catalog ) does not have the typical “S” shape where multiple phases can exist in pressure equilibrium, because there are no regions of instability (for all points in the plane the derivative of the curve is positive).
Accepted at face value, this result implies that the absorber in Ark 564 (catalog ) is not in pressure balance and thus is not forming a multiphase medium, a result at odds with previous evidence on warm absorbers. While we cannot rule out this possibility, there are several arguments pointing towards a multiphase medium. We note that the two different absorbing components in Ark 564 (catalog ) have the same kinematics, which suggests that they are related. If they share the location (the most reasonable assumption), there must be a gradient of pressure between them, given that the LIP pressure is over 5 times larger than that of the HIP. Therefore, these two components should move on the S-curve to form a single component in a time comparable to the free expansion time, given by (where is the thickness of the absorber and the speed of sound in the medium). The flow time of the components (i.e. the time in which the components cross our line of sight to the source) is given to first order as (where is the distance from the illuminated face of the absorbing material to the ionizing source and its outflow velocity). For the warm absorber in Ark 564 (catalog ) (specially for the HIP that is hotter). It follows that . Then, the free expansion time is smaller than the flow time, and the two phase should dissolve into a single component before moving out from our line of sight, which is clearly not consistent with the data. Thus, if the two phases are not in pressure balance they should not be connected, and the similar kinematics in this, and in many other sources, would have to be considered a coincidence.
Alternatively, the sources might be in pressure balance forming a multiphase medium, but there might be additional heating and/or cooling processes acting on the gas, changing the shape of the S-curve, but not the ionization balance. The most obvious parameter for this is the gas metallicity. Komossa & Mathur (2001) showed that the shape of the equilibrium curve not only depends upon the SED of the source, but also on the metallicity of the absorber, which affects the cooling of the gas. They further show that super-solar abundances restore the equilibrium zone in steep spectrum sources and increase the pressure range where a multiphase equilibrium is possible. Fields et al. (2007) showed that this is indeed the case for the ionized absorber in Mkn 279.
Since Ark 564 (catalog ) also has a steep spectrum and a monotonically rising “S” curve, we generated a new pressure-temperature curve with super-solar metallicity of 10 solar, shown as a dashed curve in figure 11. This is a good assumption as supersolar metallicity has been suggested for this source (Romano et al. 2004). Even with super-solar metallicity, the “S-curve” is very steep, without regions where multiple components can coexist in pressure equilibrium. Thus, even having high metallicity does not solve the problem of finding the warm absorber components out of pressure balance and below we speculate on possible reasons.
The continuum X-ray spectrum of Ark 564 (catalog ) is not only steep (), it also has an additional prominent soft excess, similar to the behavior seen in sources with steep soft X-ray spectra (e.g., NGC 4051, Komossa & Mathur 2001; Mrk279, Fields et al. 2007). In fact, additional modeling shows that the main reason for a steep “S-curve” is the extra heating produced by the soft excess (particularly in the LIP). If the soft excess continuum is not impinging directly on the absorbing gas, perhaps because it is the result of reflection toward our line of sight, then the two components would be in pressure balance. Other possibilities to produce a multi-valued S-curve, and LIP/HIP components in pressure balance include a weaker IR radiation field illuminating the material than the one observed (Krolik and Kriss 2001) or additional (more exotic) sources of heating at high temperatures, such as those discussed in Krolik et al. (1981). Therefore, if warm absorbers are indeed a multiphase medium in pressure equilibrium, it is likely that the overall radiation field impinging on the gas is different than the one observed. This effect might be stronger in sources with steep soft X-ray spectra. We note, however, that this suggestion is speculative; we cannot prove it or rule it out. We also note that photoionization models of the Broad Line Region demand that the ionizing continuum is different than the one observed (Binette & Krongold 2008, and references therein). If warm absorbers are indeed in pressure balance, their S-curves can be used for a better understanding of the physical properties and the processes acting on the material (Komossa & Mathur 2001, Chakravorty et al. 2012, Krongold et al. 2013).
7 Summary
Our best fit model of intrinsic absorption of NLS1 galaxy Ark 564 (catalog ) requires a two-phase warm absorber with two different ionization states (HIP and LIP). Both the absorbers are outflowing at low velocities of order of km s-1. The HIP absorber reproduces most of the spectral features observed in the HETG spectra (O viii, Ne ix, Ne x, Mg xi, Fe xvii and Fe xviii) except for a few at lower energies (O vii and O vi), which are modeled by the LIP component. The pressure–temperature equilibrium curve for the Ark 564 (catalog ) warm absorber does not have the typical “S” shape, even if the metallicity is super-solar; as a result the two WA phases do not appear to be in pressure balance. We speculate that the continuum incident on the absorbing gas is perhaps different from the observed continuum. We observe clear variability in the WA properties between the 2008 HETG observations and previous observations which could be in response to the change in continuum or the absorbing clouds passing our sight-line; the large time gap between observations does not allow us to distinguish between the two possibilities.
We also estimated the mass outflow rate and associated kinetic energy assuming a biconical wind model (Krongold et al. 2007) and find that it represents a tiny fraction of the bolometric luminosity of Ark 564 (catalog ). Thus it is highly unlikely that these outflows provide significant feedback required by the galaxy formation models.
Acknowledgement: Support for this work was provided by the National Aeronautics and Space Administration through Chandra Award Number TM9-0010X issued by the Chandra X-ray Observatory Center, which is operated by the Smithsonian Astrophysical Observatory for and on behalf of the National Aeronautics Space Administration under contract NAS8-03060. YK acknowledges support from CONACyT 168519 grant and UNAM-DGAPA PAPIIT IN103712 grant.
References and Notes
- Andrade-Velazquez et al. (2010) Andrade-Velázquez, M. et al. 2010, ApJ, 711, 888
- Behar et al. (2003) Behar, E. et al. 2003, ApJ, 598, 232
- Blustin et al. (2005) Blustin, A. J., Page, M. J., Fuerst, S. V., Branduardi-Raymont, G., & Ashton, C. E. 2005, A&A, 431, 111
- Binette & Krongold (2008) Binette, L. & Krongold, Y. 2008, A&A, 477, 413
- Brinkmann et al. (2007) Brinkmann, W., Papadakis, I. E., & Raeth, C. 2007, A&A, 465, 107B
- Cardaci et al. (2009) Cardaci, M. V. et al. 2009, A&A, 505, 541
- Chakravorty et al. (2012) Chakravorty, S., Misra, R., Elvis, M., Kembhavi, A.K. & Ferland, G. et al. 2010, MNRAS, 422, 637
- Collier et al. (2001) Collier, S. et al. 2001, ApJ, 561, 146
- Comastri et al. (2001) Comastri, A. et al. 2001, A&A, 365, 400
- Costantini et al. (2007) Costantini, E., Gallo, L. C., Brandt, W. N., Fabian, A. C., & Boller, T. 2007, MNRAS, 378, 873
- Crenshaw et al. (1999) Crenshaw, D. M., Kraemer, S. B., Boggess, A., Maran, S. P., Mushotzky, R. F., & Wu, C.-C. 1999, ApJ, 516, 750
- Crenshaw et al. (2002) Crenshaw, D. M., Kraemer, S. B., Turner, T. J., et al. 2002, ApJ, 566, 187
- Crenshaw et al. (2003) Crenshaw, D. M., Kraemer, S. B., & George, I. M. 2003, A&A Rev., 41, 117
- Crenshaw et al. (2009) Crenshaw, D. M. et al. 2009, ApJ, 698, 281
- Detmers et al. (2008) Detmers, R. G. et al. 2008, A&A, 488, 67
- Detmers et al. (2011) Detmers, R.G. et al. 2011, A&A, 534, 38
- Dewangan et al. (2007) Dewangan, G. C., Griffiths, R. E., Dasgupta, S., & Rao, A. R. 2007, ApJ, 671, 1284
- Dickey et al. (1990) Dickey, J.M. 1990, ASSL, 161,473
- Dorodnitsyn et al. (2008) Dorodnitsyn, A., Kallman, T., & Proga, D. 2008, ApJ, 687, 97
- Elvis et al. (2000) Elvis, M. 2000, ApJ, 545, 63
- Fabian (2012) Fabian, A.C., arXiv:1204.4114v1
- Fields et al. (2007) Fields, D.L., Mathur, S., Krongold, Y., Williams, R. & Nicastro, F. 2007, ApJ, 666, 828
- Garcia et al. (2005) Garcia, J. et al. 2005, ApJS, 158, 68
- Grevesse et al. (1993) Grevesse, N., Noels, A., & Sauval, A. J. 1993, A&A, 271, 587
- Gupta et al. (2012) Gupta, A., Mathur, S., Krongold, Y., Nicastro, F., & Galeazzi, M. 2012, ApJ, 756, L8
- Holczer & Behar (2012) Holczer,T. & Behar, E. 2012, ApJ, 747, 71
- Hopkins & Elvis (2010) Hopkins, P. & Elvis, M. MNRAS, 401, 7
- Kaspi et al. (2002) Kaspi, S., et al. 2002, ApJ, 574, 643
- Komossa & Mathur (2001) Komossa, S & Mathur, S. 2001, A&A, 374, 914
- Kraemer et al. (2002) Kraemer, S. B. et al. 2002, ApJ, 577, 98
- Kraemer et al. (2005) Kraemer, S. B., et al. 2005, ApJ, 633, 693
- Krolik et al. (1981) Krolik, J. H., McKee, C. F., Tarter, C. B. 1981, ApJ, 249, 422
- Krolik & Kriss (2001) Krolik, J. H., & Kriss, G. A. 2001, ApJ, 561, 684
- Krongold et al. (2003) Krongold, Y., Nicastro, F., Brickhouse, N.S., Elvis, M., Liedahl D.A. & Mathur, S. 2003, ApJ, 597, 832
- Krongold et al. (2005) Krongold, Y., Nicastro, F., Elvis, M., Brickhouse, N. S., Mathur, S., & Zezas, A. 2005, ApJ, 620, 165
- Krongold et al. (2007) Krongold, Y. et al. 2007, ApJ, 659, 1022
- Krongold et al. (2010) Krongold, Y., Binette, L., & HernNandez-Ibarra, F. 2010, ApJ, 724L, 203K
- Krongold et al. (2013) Krongold, y. et al. 2012, in preparation
- Leighly et al. (1999) Leighly, K.M. 1999, ApJS, 125, 317
- Mathur et al. (1994) Mathur, S., Wilkes, B., Elvis, M., & Fiore, F. 1994, ApJ, 434, 493
- Mathur et al. (1995) Mathur, S., Elvis, M., & Wilkes, B. 1995, ApJ, 452, 230
- Mathur et al. (2003) Mathur, S., Weinberg, D. H., & Chen, X. 2003, ApJ, 582, 82
- Mathur et al. (2009) Mathur, S., Stoll, R., Krongold, Y., Nicastro, F., Brickhouse, N., & Elvis, M. 2009, AIPC, 1201, 33
- Matsumoto et al. (2004) Matsumoto, C., Leighly, K. M., & Marshall, H. L. 2004, ApJ, 603, 456
- McKernan et al. (2007) McKernan, B., Yaqoob, T., & Reynolds, C. S. 2007, MNRAS, 379, 1359
- Netzer et al. (2003) Netzer, H. et al. 2003, ApJ, 599, 933
- Papadakis et al. (2007) Papadakis, I. E., Brinkmann, W., Page, M. J., McHardy, I., & Uttley, P. 2007, A&A, 461, 931
- Proga & Kallman (2004) Proga, D., & Kallman, T. R. 2004, ApJ, 616, 688
- Proga (2007) Proga, D. 2007, ASPC, 373, 267
- Ramirez (2013) Ramirez, J. 2013, A&A, 551, A95
- Reynolds (1997) Reynolds, C. S. 1997, MNRAS, 286, 513
- Romano et al. (2002) Romano, P., Mathur, S., Pogge, R. W., Peterson, B. M., & Kuraszkiewicz, J. 2002, ApJ, 578, 64
- Romano et al. (2004) Romano, P., Mathur, S., & Turner, T. J. 2004, ApJ, 602, 635
- Scannapieco & Oh (2004) Scannapieco, E. & Oh, S., 2004 ApJ, 608, 62
- Shemmer et al. (2001) Shemmer, O. et al. 2001, ApJ, 561, 162
- Silk & Rees (1998) Silk, J. & Rees, M.J. 1998, A&A, 331, 1
- Smith et al. (2008) Smith, R. A. N., Page, M. J., & Branduardi-Raymont, G. 2008, A&A, 490, 103
- Turner et al. (1999) Turner, T. J., George, I. M., Nandra, K., & Turcan, D. 1999, ApJ, 524, 667
- Turner et al. (2001) Turner, T. J., Romano, P., George, I. M., et al. 2001, ApJ, 561, 131
- Williams et al. (2006) Williams, R.J., Mathur, Smita, Nicastro, F., & Elvis, M. 2006, ApJ, 642, 95
- Wilms et al. (2000) Wilms, J., Allen, A., & McCray, R. 2000, ApJ, 542, 914
- Wyithe & Loeb (2003) Wyithe, J.S.B., & Loeb, A. 2003, ApJ, 595, 614
- Yao et al. (2009) Yao, Y. et al. 2009, ApJ, 696, 1418
- Zhang et al. (2010)
| ID | Start Time | Exposure |
|---|---|---|
| HETGS-ACIS-S | ||
| 9899 | 2008-08-28 12:51:50 | 84077 |
| 9898 | 2008-09-06 02:14:14 | 99528 |
| 10575 | 2008-09-07 22:05:20 | 62216 |
| LETGS-HRC-S | ||
| 9151 | 2008-04-24T06:04:06 | 99962 |
| EW | aaChange in after inclusion of Gaussian over continuum model | Ion Name bbThe “” marked the features with no identification | ccAtomic lines are from NIST database for all, except O i-O ii are from Garcia et al. (2005) and O vi is from Yao et al. (2009) | ||
|---|---|---|---|---|---|
| 44 | Mg xi | 9.169 | |||
| 25 | Ne ix | 11.547 | |||
| 180 | Ne x | 12.134 | |||
| 2 | |||||
| 168 | Ne ix | 13.447 | |||
| 22 | Fe xvii | 13.827 | |||
| 54 | Fe xviii | 14.203 | |||
| 10 | Fe xvii | 15.015 | local | ||
| 10 | Fe xvii | 15.015 | |||
| 3 | O viii | 18.969 | local | ||
| 70 | O viii | 16.006 | |||
| 31 | O vii | 18.627 | |||
| 122 | O viii | 18.969 | |||
| 27 | |||||
| 34 | |||||
| 9 | O vii | 21.602 | local | ||
| 49 | O vii | 21.602 | |||
| 24 | O vi | 22.026 | |||
| 20 | |||||
| 23 | O ii | 23.310 | local | ||
| 20 | |||||
| 40 | O i | 23.448 | local |
| Units | MEG | MEG+HEG | LETG | |
|---|---|---|---|---|
| Powerlaw | ||||
| Photon Index () | ||||
| Normalization | ||||
| Black Body | ||||
| kT | ||||
| Normalizationaawhere is the source luminosity in units of and is the distance to the source in units of 10 kpc. | ||||
| Warm Absorber: HIP | ||||
| bbDerived from the column density and ionization parameter, assuming photoionization equilibrium. | K | |||
| K | ||||
| Warm Absorber: LIP | ||||
| bbDerived from the column density and ionization parameter, assuming photoionization equilibrium. | K | |||
| Degrees of freedom |
| HETG | LETG | ||||||
|---|---|---|---|---|---|---|---|
| Ion | |||||||
| Ca xiv | 14.86 | – | 14.86 | 14.67 | – | 14.67 | |
| S xiv | 15.16 | – | 15.16 | 15.15 | – | 15.15 | |
| Ca xv | 14.69 | – | 14.69 | 14.61 | – | 14.61 | |
| N vii | 16.17 | 15.41 | 16.24 | 15.92 | 15.36 | 16.03 | |
| O iv | 10.34 | 15.05 | 15.05 | – | 16.26 | 16.26 | |
| O v | 12.46 | 15.97 | 15.97 | 11.96 | 16.80 | 16.80 | |
| O vi | 14.09 | 16.33 | 16.33 | 13.68 | 16.88 | 16.88 | |
| O vii | 16.44 | 16.75 | 16.92 | 16.12 | 16.88 | 16.95 | |
| O viii | 17.37 | 15.80 | 17.38 | 17.14 | 15.53 | 17.15 | |
| Fe xvii | 16.06 | – | 16.06 | 15.90 | – | 15.90 | |
| Fe xviii | 15.86 | – | 15.86 | 15.81 | – | 15.81 | |
| Ne ix | 16.61 | 14.96 | 16.62 | 16.36 | 14.37 | 16.36 | |
| Ne x | 16.68 | 13.18 | 16.68 | 16.54 | 12.19 | 16.54 | |
| Mg x | 15.59 | 13.63 | 15.49 | 15.21 | 12.87 | 15.21 | |
| Mg xi | 16.37 | 12.80 | 16.37 | 16.19 | 11.77 | 16.19 | |
| Mg xii | 15.74 | 10.34 | 15.74 | 15.67 | – | 15.67 | |
| Si xi | 15.75 | 12.92 | 15.75 | 15.47 | 10.80 | 15.47 | |
| Si xii | 15.79 | 11.76 | 15.79 | 15.60 | – | 15.60 | |
| Si xiii | 16.14 | – | 16.14 | 16.05 | – | 16.05 | |