The Infrared Absorption Band and Vibronic Structure of the Nitrogen-Vacancy Center in Diamond
Abstract
Negatively-charged nitrogen-vacancy (NV-) color centers in diamond have generated much interest for use in quantum technology. Despite the progress made in developing their applications, many questions about the basic properties of NV- centers remain unresolved. Understanding these properties can validate theoretical models of NV-, improve their use in applications, and support their development into competitive quantum devices. In particular, knowledge of the phonon modes of the electronic state is key for understanding the optical pumping process. Using pump-probe spectroscopy, we measured the phonon sideband of the electronic transition in the NV- center. From this we calculated the one-phonon absorption spectrum and found it to differ from that of the transition, a result which is not anticipated by previous group-theoretical models of the NV- electronic states. We identified a high-energy 169 meV localized phonon mode of the level.
pacs:
78.40.Ha, 63.20.kp, 63.20.Pw, 61.72.jnI Introduction
The nitrogen-vacancy (NV) center in diamond (Fig. 1a) is a color center consisting of a substitutional nitrogen atom in the diamond crystal lattice adjacent to a missing carbon atom (a vacancy). NV centers have point-group symmetry and have discrete electronic energy states between the diamond valence and conduction bands. The negatively-charged NV- center can be optically spin-polarized and read out, and it has a long ground-state transverse spin relaxation time at room temperature.Balasubramanian et al. (2009); Pham et al. (2012) These properties make NV- centers useful in a variety of applications including electric and magnetic field sensing,Taylor et al. (2008); Maze et al. (2008); Balasubramanian et al. (2008); Dolde et al. (2011) rotation sensing, Maclaurin et al. (2012); Ledbetter et al. (2012); Ajoy and Cappellaro (2012) quantum computing, Wrachtrup and Jelezko (2006); Maurer et al. (2012) quantum cryptography, Alléaume et al. (2004); Beveratos et al. (2002) and sub-diffraction-limited imaging. Rittweger et al. (2009); Hell et al. (2009); Maurer et al. (2011) Despite the progress made on developing these applications, the complete NV- energy level structure and vibronic structure are unknown.
Figure 1b shows a simplified NV- energy-level diagram as confirmed by experiment. The triplet-triplet () and singlet-singlet () energy differences are known to be 1.945 eV (637 nm) and 1.190 eV (1042 nm), respectively. Davies and Hamer (1976); Acosta et al. (2010a); Rogers et al. (2008); Manson et al. (2010) However, where these energy states lie with respect to the diamond valence and conduction bands is only known indirectly, as are the triplet-singlet ( and ) energy differences. Aslam et al. (2013); Toyli et al. (2012) Theoretical calculations predict the existence of additional energy states ( and ), but disagree on their energies (see Refs. [Lenef and Rand, 1996; Delaney et al., 2010; Doherty et al., 2011; Maze et al., 2011; Choi et al., 2012] and references therein). Prior experiments and ab initio calculations studied the phonon sidebands (PSBs) for the and transitions.Davies and Hamer (1976); Davies (1974); Gali et al. (2011); Zhang et al. (2011); Webber et al. (2012) The and PSBs have not been studied theoretically, and only the transition had been measured prior to this work. Acosta et al. (2010a); Rogers et al. (2008); Manson et al. (2010)
A more complete experimental picture of NV- properties can provide insight for applications and validate theoretical models of NV- attributes. The 1042 nm infrared zero-phonon line (ZPL) has been used in an absorption-based magnetometer,Acosta et al. (2010b) but using the PSB instead may be more sensitive depending on the PSB structure and cross section. In addition, most NV experiments take advantage of an optical pumping mechanism (which involves the excited vibrational states) that drives electrons to the state. Therefore, knowledge of the PSB could improve infrared magnetometry and optical pumping schemes. Moreover, as the NV- center develops into a mature quantum system, it is important to know the properties of the singlet states to inspire confidence that we understand this system.
We attempt to fill the gaps in the knowledge of NV- properties by measuring the PSB and searching for previously unobserved transitions. Finding the ZPL would resolve the disagreement on the predicted energy. The PSB yields information about the phonon modes, which are also of interest. The spin-orbit interaction mixes the and states, resulting in triplet-singlet intersystem crossing (ISC). This enables spin-dependent non-radiative decay from the nominally state to the nominally state. The ISC rate is comparable to the spontaneous decay rate Robledo et al. (2011); Tetienne et al. (2012) and is an important factor in the optical pumping process. Measuring the phonon modes could allow the optical pumping mechanism to be modeled more accurately and provide insight on NV- spin polarization and readout. Furthermore, the accepted group-theoretical model of NV- predicts and to have the same electronic configuration, meaning they should have the same phonon modes. A comparison between the and PSBs should be sensitive to differences between the and configurations.
| \begin{overpic}[width=86.72267pt]{fig1a.pdf} \put(5.0,100.0){a} \end{overpic} | \begin{overpic}[width=108.405pt]{fig1c.pdf} \put(5.0,100.0){c} \end{overpic} |
In this work, we present measurements of the ZPL and PSB. We describe the PSB absorption features, including a high-energy (169 meV) localized phonon mode that lies outside the diamond lattice phonon density of states. Comparing the and the phonon modes, we find that the phonon modes are shifted to higher energies, meaning that proper descriptions of the and states require corrections to their electronic configurations.
II Experiment and Results
In our experiment, we populated the metastable state using pump-laser light and measured transmission of probe-laser light through a diamond sample containing an ensemble of NV- centers (Fig. 1b and Fig. 2). We determined the probe transmission through the diamond with and without NV- centers in the state. A 532 nm frequency-doubled Nd:YVO4 pump laser beam and a 5 mW supercontinuum probe laser beam (wavelength range 450-1800 nm) were combined on a dichroic beamsplitter and focused with a 40 microscope objective (0.6 numerical aperture) onto a cryogenically cooled diamond sample. The transmitted light was collimated and detected with a spectrometer with 1 nm resolution. A chopper wheel modulated the pump light and a computer collected a transmission spectrum each time the pump light was blocked and unblocked. Absorption from appeared as a difference between the “pump blocked” and “pump unblocked” supercontinuum transmitted intensities. In another experiment, we used 912 nm and 1042 nm continuous-wave (cw) lasers as probe sources and replaced the spectrometer with a photodiode.sup
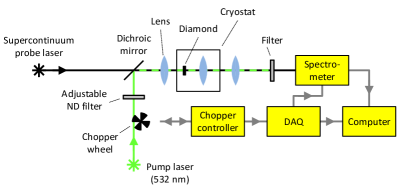
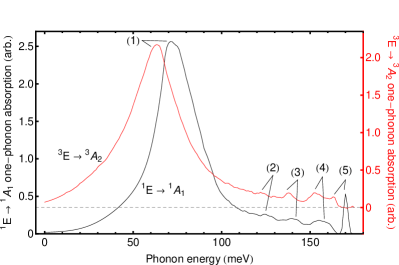
Figure 3a shows the ZPL and PSB supercontinuum absorption spectrum taken at 10 K with the sample “B8”, a synthetic type Ib high-pressure high-temperature (HPHT) diamond with 10 ppm NV- concentration. The PSB includes narrow absorption lines at 811 and 912 nm and broad absorption features at 872, 922, 931, and 983 nm. In the figure we observe that the 912 and 811 nm lines are 169 meV and 2169 meV away from the ZPL, respectively. Consequently, we believe the 811 and 912 nm lines are due to a 169.28(4) meV phonon mode and that the other lines are due to a distribution of phonon modes. Figure 3b shows the fluorescence spectrum taken at 4 K with a similar diamond (also 10 ppm NV- concentration). This PSB has a broader energy range, and has features at 686, 692, and 696 nm. Using these measured spectra and the techniques outlined in Refs. [Davies, 1974, sup, , Maradudin, 1966], we calculated the and Huang-Rhys parameters (0.9 and 3.49, respectively) as well as their one-phonon spectra (Fig. 4), which are the rates at which these transitions create one phonon of a given energy. We expect these one-phonon spectra to be comparable, since both come from transitions with similar final-state electronic configurations (Fig. 1c). The one-phonon spectra show resemblance, and the differences between them are because of electronic Coulomb repulsion corrections to the level. These corrections mix the level with the higher-energy level. As a result, the level contains an admixture of configurations, which results in the difference in the one-phonon spectra.sup
We observed the above PSB features in several diamond samples, and the absorption was greater in samples with higher NV- concentration. The absorption should increase with pump power and saturate when the pumping rate becomes comparable to the decay rate. The absorption at room temperature increased linearly with pump power (up to 60 mW focused to a minimum beam waist smaller than 5 m), indicating that the population was not saturated. However, the absorption at 10 K saturated at 15 mW. This saturation is likely due to the prolonged lifetime at cryogenic temperature.Acosta et al. (2010a) Introducing a static transverse magnetic field to the samples improved the absorption contrast by a few percent. This is because the Zeeman interaction mixes the triplet spin sublevels, which spoils the optical pumping to and increases the population.
We did not detect a ZPL in the 480-1100 nm range of the supercontinuum transmission spectrum, which means this transition lies outside of this range or was too weak to detect. This wavelength span was limited by the spectrometer.
Using a rate equation calculation based on the NV- excitation and decay rates at room temperature,Tetienne et al. (2012) we estimate the room temperature ZPL cross section to be roughly m2, which is consistent with previous work. sup ; Dumeige et al. (2013) The accuracy of this cross section estimate is primarily limited by uncertainty in the NV- concentration; varying the NV- concentration from 5 to 20 ppm in our model yields estimated cross sections ranging from 3.4 to m2 (compared to m2 with 10 ppm NV-).
We varied the temperature of sample B8 from 10 to 300 K and recorded the absorption-feature contrasts, linewidths, and integrated areas.sup The features become weaker and broader with increasing temperature, and their integrated areas decrease. This decrease in area is consistent with the lifetime decrease observed in Ref. [Acosta et al., 2010a].
| Peak # | state | state |
|---|---|---|
| (1) | 64 meV | 71 meV |
| (2) | 122 meV | 125 meV |
| (3) | 138 meV | 141 meV |
| (4) | 153 meV | 156 meV |
| (5) | 163 meV | 169 meV |
Using cw probe lasers and a similar diamond sample “S2” (16 ppm NV- concentration), we measured the center wavelengths of the 912 and 1042 nm absorption lines at 40 K to be 912.19(2) nm and 1041.96(2) nm. Our ZPL center wavelength is consistent with previous measurements.Acosta et al. (2010a); Rogers et al. (2008) At low temperatures, the 1042 and 912 nm features have narrow widths (currently limited by the spectrometer resolution). These narrow widths imply that the vibrational mode associated with the 912 nm feature is sharp. By measuring 912 nm absorption as a function of light polarization angle, we found that the 912 nm absorption has the same polarization selection rules as the ZPL.Acosta et al. (2010a); sup
A 532 nm pump laser may excite other defects besides NV- (such as NV0), meaning we must be cautious when associating the observed infrared absorption features with the NV- transition. Selective excitation of infrared fluorescence using 637 nm pump light was shown in Ref. [Manson et al., 2010], meaning that while the 1042 nm ZPL is surely related to NV-, we must convince ourselves that the other infrared absorption features are also part of this electronic transition. The one-phonon absorption spectrum (Fig. 4), the optically-detected magnetic resonance test of the 912 nm selection rules sup , and the fact that a transverse magnetic field enhances the infrared absorption all confirm that our absorption spectrum belongs to the NV- transition.
III Analysis and Discussion
Comparing the absorption PSB in Fig. 3a with previous observations of the fluorescence PSB,Rogers et al. (2008); Manson et al. (2010) it is evident that these PSBs differ significantly. This difference is due to the anharmonicity of the vibronic levels induced by the dynamic Jahn-Teller effect, which is not present in . Manson et al. (2010) In the low-temperature limit, the PSB features of electronic transitions exhibit anharmonicity, while the PSB features of transitions are harmonic.Longuet-Higgins et al. (1958) Consequently, it is appropriate to compare the absorption PSB with the fluorescence PSB. Furthermore, and have the same electronic configuration () when electronic Coulomb repulsion is ignored, meaning they should have similar nuclear equilibrium positions and phonon modes. Since their initial states are different, the and transitions may couple to a different number of phonon modes and have different Huang-Rhys parameters, but the and one-phonon spectra should be similar.
As mentioned above, we extracted the one-phonon spectra from the PSBs shown in Fig. 3. The n-phonon spectrum is the convolution of the (n-1)-phonon and one-phonon spectra, and the sum of all n-phonon spectra generates the transition PSB. The one-phonon spectra are also related to the and phonon density of states (DOS). As seen in Fig. 4, we found similarities between the one-phonon spectra; both spectra have one large feature and four small features. However, all of the features are displaced to higher energies (Tab. 1).
Introducing a point defect into a lattice alters the vibrational motion of the defect and its neighbors from what it would have been with ordinary atoms in the lattice. This is because the parameters that determine the frequencies of the vibrational motion for these atoms (the masses and effective spring constants) are modified. When the frequencies of the local oscillations of the defect lie within the spectrum of allowed vibrational modes of the remaining crystal, the local modes hybridize with the lattice modes and are called “quasilocal” (quasilocal because the nuclear oscillation amplitudes fall off slowly with increasing distance from the defect). Maradudin (1966); Zhang et al. (2011) The 71 meV phonon modes we observed appear to be from a quasilocal mode of NV- in the state. The diamond lattice phonon DOS is appreciable at 71 meV,Mounet and Marzari (2005); Bosak and Krisch (2005) and since the NV- 71 meV mode couples strongly to the diamond lattice modes, the peaks of the 71 meV mode are consequently broadened.
In contrast to the quasilocal mode case, a “localized” mode occurs when the frequency of the local oscillations of a defect lies outside the lattice phonon DOS. In this instance, the oscillations of the defect couple poorly to the oscillations of the rest of the crystal, the vibrational motion is confined to the region of the defect, and the local phonon mode energy is unbroadened. This is the case for the 169 meV mode. The diamond lattice phonon DOS has an upper limit of 168 meV.Mounet and Marzari (2005); Bosak and Krisch (2005); Zaitsev (2001) The NV- 169 meV mode falls outside the diamond lattice phonon spectrum and couples poorly to the lattice modes, consequently making the peaks of the 169 meV mode in Fig. 3a sharp.
The existence of a 169 meV local phonon mode and the differences between the and one-phonon spectra are surprising for several reasons. Ab initio calculations for the NV- triplet-state vibrations do not predict the existence of high-energy local phonon modes,Gali et al. (2011); Zhang et al. (2011) and the PSB is the only NV- PSB to contain such a feature. Due to the discrepancy in one-phonon spectra, we conclude that the level has electronic Coulomb repulsion corrections that modify its phonon modes from those of the level. Since the features in the one-phonon spectrum are shifted to higher energies, we can determine that the nearby atoms are more tightly bonded in the level than in the level.
IV Outlook
In summary, we measured the absorption spectrum of the NV- center using pump-probe spectroscopy. In the PSB and one-phonon absorption spectrum we found several phonon modes, one of which lies outside the diamond lattice phonon DOS. The and one-phonon spectra show general similarity, but the phonon modes are shifted to higher energies, which is from corrections to the orbital configuration due to electronic Coulomb repulsion (not included in other theories). Our measurement of the absorption spectrum shows that the ZPL is more absorptive than the PSB, and hence the ZPL offers greater sensitivity for infrared-absorption-based magnetometry than the PSB wavelengths. Furthermore, the NV- ISC and optical pumping process can be modeled more precisely using our measured vibronic structure.
We searched for the ZPL for energies up to 2.0 eV at cryogenic temperature and 2.6 eV at room temperature, but we did not detect it. The and should have similar cross sections because they are transitions from electronic configuration to (neglecting Coulomb coupling). Since the ZPL cross section is smaller than that of (see Ref. [Wee et al., 2007]), the transition should have a similar or larger cross section compared to the transition. This means the ZPL would likely have been detected in our absorption measurements if its energy is less than 2.0 eV. This suggests that the ZPL energy is greater than 2.0 eV. Follow-up experiments will extend the search for the ZPL to higher energies with improved sensitivity.
Acknowledgements.
We are grateful to the group of Prof. F. Wang (UC Berkeley) for help with the supercontinuum laser. We thank V. Acosta and C. Santori (Hewlett-Packard Laboratories), and V. Huxter and S. Choi (UC Berkeley) for useful discussions. This work was supported by the NSF, DOE SCGF, the AFOSR/DARPA QuASAR program, NATO SFP, IMOD, ARC (DP120102232), and the Danish Council for Independent Research in Natural Sciences.References
- Balasubramanian et al. (2009) G. Balasubramanian, P. Neumann, D. Twitchen, M. Markham, R. Kolesov, N. Mizuochi, J. Isoya, J. Achard, J. Beck, J. Tissler, V. Jacques, P. R. Hemmer, F. Jelezko, and J. Wrachtrup, Nature Materials 8, 383 (2009).
- Pham et al. (2012) L. M. Pham, N. Bar-Gill, C. Belthangady, D. Le Sage, P. Cappellaro, M. D. Lukin, A. Yacoby, and R. L. Walsworth, Phys. Rev. B 86, 045214 (2012).
- Taylor et al. (2008) J. M. Taylor, P. Cappellaro, L. Childress, L. Jiang, D. Budker, P. R. Hemmer, A. Yacoby, R. Walsworth, and M. D. Lukin, Nat Phys 4, 810 (2008).
- Maze et al. (2008) J. R. Maze, P. L. Stanwix, J. S. Hodges, S. Hong, J. M. Taylor, P. Cappellaro, L. Jiang, M. V. Gurudev Dutt, E. Togan, A. S. Zibrov, A. Yacoby, R. L. Walsworth, and M. D. Lukin, Nature 455, 644 (2008).
- Balasubramanian et al. (2008) G. Balasubramanian, I. Y. Chan, R. Kolesov, M. Al-Hmoud, J. Tisler, C. Shin, C. Kim, A. Wojcik, P. R. Hemmer, A. Krueger, T. Hanke, A. Leitenstorfer, R. Bratschitsch, F. Jelezko, and J. Wrachtrup, Nature 455, 648 (2008).
- Dolde et al. (2011) F. Dolde, H. Fedder, M. W. Doherty, T. Nöbauer, F. Rempp, G. Balasubramanian, T. Wolf, F. Reinhard, L. C. L. Hollenberg, F. Jelezko, and J. Wrachtrup, Nature Physics 7, 459 (2011).
- Maclaurin et al. (2012) D. Maclaurin, M. W. Doherty, L. C. L. Hollenberg, and A. M. Martin, Phys. Rev. Lett. 108, 240403 (2012).
- Ledbetter et al. (2012) M. P. Ledbetter, K. Jensen, R. Fischer, A. Jarmola, and D. Budker, Phys. Rev. A 86, 052116 (2012).
- Ajoy and Cappellaro (2012) A. Ajoy and P. Cappellaro, Phys. Rev. A 86, 062104 (2012).
- Wrachtrup and Jelezko (2006) J. Wrachtrup and F. Jelezko, Journal of Physics: Condensed Matter 18, S807 (2006).
- Maurer et al. (2012) P. C. Maurer, G. Kucsko, C. Latta, L. Jiang, N. Y. Yao, S. D. Bennett, F. Pastawski, D. Hunger, N. Chisholm, M. Markham, D. J. Twitchen, J. I. Cirac, and M. D. Lukin, Science 336, 1283 (2012).
- Alléaume et al. (2004) R. Alléaume, F. Treussart, G. Messin, Y. Dumeige, J.-F. Roch, A. Beveratos, R. Brouri-Tualle, J.-P. Poizat, and P. Grangier, New Journal of Physics 6, 92 (2004).
- Beveratos et al. (2002) A. Beveratos, R. Brouri, T. Gacoin, A. Villing, J.-P. Poizat, and P. Grangier, Phys. Rev. Lett. 89, 187901 (2002).
- Rittweger et al. (2009) E. Rittweger, K. Y. Han, S. E. Irvine, C. Eggeling, and S. W. Hell, Nat Photon 3, 144 (2009).
- Hell et al. (2009) S. W. Hell, R. Schmidt, and A. Egner, Nat Photon 3, 381 (2009).
- Maurer et al. (2011) P. C. Maurer, J. R. Maze, P. L. Stanwix, L. Jiang, A. V. Gorshkov, A. A. Zibrov, B. Harke, J. S. Hodges, A. S. Zibrov, A. Yacoby, D. Twitchen, S. W. Hell, R. L. Walsworth, and M. D. Lukin, Nat Physics 6, 912 (2011).
- Davies and Hamer (1976) G. Davies and M. F. Hamer, Proceedings of the Royal Society of London. Series A, Mathematical and Physical Sciences 348, pp. 285 (1976).
- Acosta et al. (2010a) V. M. Acosta, A. Jarmola, E. Bauch, and D. Budker, Phys. Rev. B 82, 201202 (2010a).
- Rogers et al. (2008) L. J. Rogers, S. Armstrong, M. J. Sellars, and N. B. Manson, New Journal of Physics 10, 103024 (2008).
- Manson et al. (2010) N. Manson, L. Rogers, M. Doherty, and L. Hollenberg, arXiv:1011.2840 (2010).
- Aslam et al. (2013) N. Aslam, G. Waldherr, P. Neumann, F. Jelezko, and J. Wrachtrup, New Journal of Physics 15, 013064 (2013).
- Toyli et al. (2012) D. M. Toyli, D. J. Christle, A. Alkauskas, B. B. Buckley, C. G. Van de Walle, and D. D. Awschalom, Phys. Rev. X 2, 031001 (2012).
- Lenef and Rand (1996) A. Lenef and S. C. Rand, Phys. Rev. B 53, 13441 (1996).
- Delaney et al. (2010) P. Delaney, J. C. Greer, and J. A. Larsson, Nano Letters 10, 610 (2010).
- Doherty et al. (2011) M. W. Doherty, N. B. Manson, P. Delaney, and L. C. L. Hollenberg, New Journal of Physics 13, 025019 (2011).
- Maze et al. (2011) J. R. Maze, A. Gali, E. Togan, Y. Chu, A. Trifonov, E. Kaxiras, and M. D. Lukin, New Journal of Physics 13, 025025 (2011).
- Choi et al. (2012) S. Choi, M. Jain, and S. G. Louie, Phys. Rev. B 86, 041202 (2012).
- Davies (1974) G. Davies, Journal of Physics C: Solid State Physics 7, 3797 (1974).
- Gali et al. (2011) A. Gali, T. Simon, and J. E. Lowther, New Journal of Physics 13, 025016 (2011).
- Zhang et al. (2011) J. Zhang, C.-Z. Wang, Z. Z. Zhu, and V. V. Dobrovitski, Phys. Rev. B 84, 035211 (2011).
- Webber et al. (2012) B. T. Webber, M. C. Per, D. W. Drumm, L. C. L. Hollenberg, and S. P. Russo, Phys. Rev. B 85, 014102 (2012).
- Acosta et al. (2010b) V. M. Acosta, E. Bauch, A. Jarmola, L. J. Zipp, M. P. Ledbetter, and D. Budker, Appl. Phys. Lett. 97, 174104 (2010b).
- Robledo et al. (2011) L. Robledo, H. Bernien, T. van der Sar, and R. Hanson, New Journal of Physics 13, 025013 (2011).
- Tetienne et al. (2012) J.-P. Tetienne, L. Rondin, P. Spinicelli, M. Chipaux, T. Debuisschert, J.-F. Roch, and V. Jacques, New Journal of Physics 14, 103033 (2012).
- (35) Further details are included in the supplementary material.
- Maradudin (1966) A. A. Maradudin, Solid State Physics, edited by F. Seitz and D. Turnbull, Vol. 18 (Academic Press, 1966) p. 273.
- Dumeige et al. (2013) Y. Dumeige, M. Chipaux, V. Jacques, F. Treussart, J.-F. Roch, T. Debuisschert, V. M. Acosta, A. Jarmola, K. Jensen, P. Kehayias, and D. Budker, Phys. Rev. B 87, 155202 (2013).
- Longuet-Higgins et al. (1958) H. C. Longuet-Higgins, U. Öpik, M. H. L. Pryce, and R. A. Sack, Proceedings of the Royal Society of London. Series A. Mathematical and Physical Sciences 244, 1 (1958).
- Mounet and Marzari (2005) N. Mounet and N. Marzari, Phys. Rev. B 71, 205214 (2005).
- Bosak and Krisch (2005) A. Bosak and M. Krisch, Phys. Rev. B 72, 224305 (2005).
- Zaitsev (2001) A. M. Zaitsev, Optical Properties of Diamond: A Data Handbook (Springer, 2001).
- Wee et al. (2007) T.-L. Wee, Y.-K. Tzeng, C.-C. Han, H.-C. Chang, W. Fann, J.-H. Hsu, K.-M. Chen, and Y.-C. Yu, The Journal of Physical Chemistry A 111, 9379 (2007).
See pages 1 of dr5d_suppl.pdf See pages 2 of dr5d_suppl.pdf See pages 3 of dr5d_suppl.pdf See pages 4 of dr5d_suppl.pdf See pages 5 of dr5d_suppl.pdf See pages 6 of dr5d_suppl.pdf See pages 7 of dr5d_suppl.pdf See pages 8 of dr5d_suppl.pdf See pages 9 of dr5d_suppl.pdf See pages 10 of dr5d_suppl.pdf See pages 11 of dr5d_suppl.pdf See pages 12 of dr5d_suppl.pdf See pages 13 of dr5d_suppl.pdf See pages 14 of dr5d_suppl.pdf See pages 15 of dr5d_suppl.pdf