Neutral-cluster implantation in polymers by computer experiments
Abstract
In this work we perform atomistic model potential molecular dynamics simulations by means of state-of-the art force-fields to study the implantation of a single Au nanocluster on a Polydimethylsiloxane substrate. All the simulations have ben performed on realistic substrate models containing up to 4.6 millions of atoms having depths up to 90 nm and lateral dimensions up to 25 nm. We consider both entangled-melt and cross-lin ed Polydimethylsiloxane amorphous structures.
We show that even a single cluster impact on the Polydimethylsiloxane substrate remarkably changes the polymer local temperature and pressure. Moreover we observe the presence of craters created on the polymer surface having lateral dimensions comparable to the cluster radius and depths strongly dependent on the implantation energy.
Present simulations suggest that the substrate morphology is largely affected by the cluster impact and that most-likely such modifications favor the the penetration of the next impinging clusters.
I Introduction
Electronic devices fabricated on bendable plastic substrates are widely believed to have great potential for applications in electronics. Much progress has been made in this area, in particular in the fabrication of devices and circuits, ranging from electronic paper-like display devices Lee et al. (2006); Rogers et al. (2001); Gelinck et al. (2004) to sensor skins Someya et al. (2005), circuits suitable for radio frequency identification tags Baude et al. (2003); Cantatore et al. (2007), non-volatile memories Ouyang et al. (2004), photovoltaics Ouyang et al. (2004); Mayer et al. (2007) , smart clothing Schubert and Werner (2006), and actuators Engel et al. (2006); Rosset et al. (2009).
Stretchable electronics represents a much more challenging class of systems Kim et al. (2008) with applications mainly in the biomedical area, where circuits must be integrated with biological tissues. Stretchability demands that the circuits have the capacity to absorb large strain without degradation in their electronic properties. Materials used in stretchable electronics range from entropy elastic elastomers to energy elastic solids. Stretchable circuits are made of diverse materials that span more than 12 orders of magnitude in Young elastic modulus.
In this work we focus, in particular, on stretchable electrodes, formed by metallic paths inserted into elastomeric substrate, mainly fabricated via the direct metallization of elastomersWhitesides (2006). Polydimethylsiloxane (PDMS) is the most used elastomer substrate because it combines biocompatibility with suitable mechanical propertiesWhitesides (2006). Moreover, PDMS can be easily synthesized by available laboratory techniques and it is not attacked by most process chemicalsMandlik et al. (2008). Amorphous PDMS can be synthesized in different microscopic structures, depending on the applications, including entangled-melt (EM) films (composed by a network of chains strongly wrapped around each other) as well as cross-linked (CL) structures in which individual chains are chemically bonded to each other through suitable cross-linker moleculesDollase et al. (2002) .
The metallization of PDMS to produce micrometric conductive pathways is typically obtained by metal vapor depositionGraz et al. (2009) or by metal ion implantationMaggioni et al. (2004). One of the main drawbacks of the metal vapor deposition technique is the delamination of the conducting layers even at very low deformations. This problem is solved by metal ion implantation, which provides improved adhesion between the conducting layers and the polymeric substrate. In this technique nobel metal ions are implanted with energies in the range of the KeV/atomMaggioni et al. (2004); Rosset et al. (2009), thus forming a conductive layer just below the substrate surface. However, it has been shown that upon the ion implantation the insulating polymeric substrate is likely degraded by carbonization and the presence of chargesRavagnan et al. (2009).
Recently a novel implantation technique named ”Supersonic cluster beam implantation” (SCBI) has been proposed Ravagnan et al. (2009); Corbelli et al. (2011). SCBI consists in pointing a collimated beam of neutral metallic clusters towards a polymeric substrate. The size distribution of the clusters ranges from nm to nm and the typical implantation kinetic energy is about eV/atom. Even if the kinetic energy comparatively lower than in the ion implantation technique, the neutral clusters are able to penetrate up to tens of nm into the polymeric target forming a buried conducting layer and avoiding charging and carbonization. The mechanism driving SCBI is the so-called ”clearing-the-way” effect Anders and Urbassek (2008); Carroll et al. (2000); Sanz-Navarro et al. (2002), namely the front atoms in the cluster collide with target atoms conveying them sufficient momentum to clear the way for the following cluster atoms. As a consequence, the low-energy cluster penetration depth is increased with respect to the high-energy single ion penetration. The ”clearing the way” effect has been confirmed and formalized by classical molecular dynamics in which Agn clusters (n = 20-200) impacted with total energies in the range of 0.5-6 keV into graphiteCarroll et al. (2000). The penetration depth was related to the implantation energy , the cluster number of atoms , and the substrate cohesive energy according to the following scaling lawAnders and Urbassek (2008):
| (1) |
The underlying assumption is that that is mainly spent in breaking bonds of the substrate while penetrating into it. Therefore, the penetration depth turns out to be inversely proportional to the cohesive energy U of the substrate.
The SCBI technique has been recently applied using Au-nanoclusters (Au-nc) implanted on a PDMS substrateCorbelli et al. (2011). The resulting nanocomposite can withstand many deformation cycles, decreasing their electrical resistance upon cyclical stretchingCorbelli et al. (2011). While the effectiveness of this novel technique has been demonstratedCorbelli et al. (2011), the physical and chemical phenomena underlying the SCBI process at the microscopic scale remains to be fully understood. As a matter of fact, the implantation process of neutral metal clusters in a polymer matrix is a problem rarely studied in literature Ravagnan et al. (2009); Corbelli et al. (2011); Marelli et al. (2011) and the mechanical and electrical properties of the resulting nanocomposites need to be fully characterized at the microscopic scale. In particular, it is important to investigate the polymer microstructure evolution in terms of temperature and pressure waves generated upon implantation and the resulting polymer surface damage. Another important property to characterize is the dependence of the cluster penetration depth on the implantation energy and cluster dimension. This information is relevant to better control the SCBI process since it allows to tune the penetration depth by changing the implantation energy and/or the cluster dimensions. Finally, it is important to assess the different polymer response upon the implantation depending on its microscopic structure, namely depending on the entangled-melt vs. cross-linked bond network.
In this perspective, computer simulations represent a key tool in order to fully describe at the atomistic scale both the SCBI process and the following microstructure evolution of the substrate. In this work we present molecular dynamics (MD) simulations of the implantation of a single Au cluster on a PDMS substrate. We understand that this single event (although it can hardly be compared to the full SCBI experiment) is the most fundamental process ruling SCBI and, therefore, we believe it deserves a careful investigation. To the best of out knowledge a direct simulation of such a cluster impact is still missing in Literature.
In order to keep the present simulations on the actual experimental length-scale we make use of very large-scale MD simulations by aging as many as 4.6 millions atomic trajectories. Furthermore, special care is played to carefully model the cluster-substrate interactions, as well as the possible presence of molecular linkers into the PDMS film. To this aim, we make use of a state of the art force-field which has been accurately benchmarked on well-known physical properties of pristine PDMS.
The goal of the present work is three-fold:(i) modeling at the atomic scale the impact (and following penetration) of the cluster into the substrate; (ii) linking the penetration depth to the implantation parameters (like e.g. the cluster implantation energy or size, and the structure of the substrate); (iii) characterize the surface damage upon impact.
The much more challenging full simulation of the SCBI process (i.e. the simulation of a multi-impact cluster deposition) will be investigated in a following work.
II Theoretical framework
II.1 The force field
All simulations are performed using the COMPASS (condensed-phase optimized molecular potentials for atomistic simulation studies) force-field Sun (1998), including off-diagonal cross-coupling terms and high-order (cubic and quartic) force constants. The parametrization of the COMPASS force-field allows to describe, using the same functional form, organic (single molecules and polymers) as well as inorganic materials Sun (1998); Heinz et al. (2008). The functional forms used in this force field are the same as those used in consistent force-fields (CFF)Jonsdottir and Rasmussen (2000):
| (2) |
where:
| (3) |
and
| (4) |
with the following combining rules
| (5) |
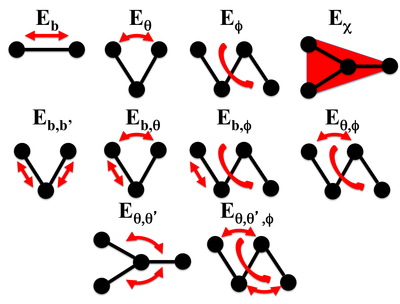
The functions can be divided into two types: valence terms including diagonal (, ) and off-diagonal cross-coupling terms (, , , ), and nonbond interaction terms. The valence terms represent internal coordinates of bond (), angle (), torsion angle (), and out-of-plane angle (), while the cross-coupling terms include combinations of two or three internal coordinates (see 1). The cross-coupling terms are important for predicting vibration frequencies and structural variations associated with conformational changes. In 3 the subscript denotes the reference values of the bond, angle, dihedral angle and out-of-plane angle, while , , , , are the force constants determined from the quantum mechanical energy surface. Terms involving explicit internuclear distances, , represent nonbond interactions which are composed by a Lennard Jones (LJ) 9-6 function for the van der Waals (vdW) term and a Coulombic function for an electrostatic interaction. The LJ-9-6 function is particularly suitable for the case of cluster impacts with respect to LJ-12-6 function, which is known to be too hard in the repulsion region.
.
II.2 Entangled-melt PDMS
.
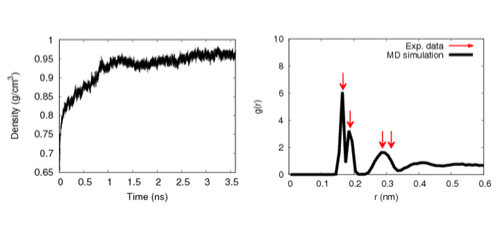
We generate amorphous (a) EM-PDMS by means of the Theodorou e Suter Theodorou and Suter (1985, 1986) algorithm implemented in the Materials Studio MAT package. The simulation cell is composed by chains with PDMS monomers each, having in total atoms and an initial simulation cell volume is set as to correspond to a density of 1 g/cm3. After the EM-PDMS structure is generated, we equilibrate the cell volume using the LAMMPS package by performing a constant-temperature constant pressure (NPT) simulation for 3.5 ns at a pressure of 1 Atm and a temperature of 300K. The final density of 0.96 g/cm3 (reported in 2 (left)) is in good agreement with the experimental data for PDMS at 300 K Makrodimitri et al. (2007); Sides et al. (2002); Fakhreddine and Zoller (1990); Shih and J.Flory (1972). We calculate the corresponding radial distribution function (see 2, right) finding a quite good agreement with available experimental dataMakrodimitri et al. (2007); Sides et al. (2002). Makrodimitri et al. (2007); Sides et al. (2002).
II.3 Crossed-linked PDMS
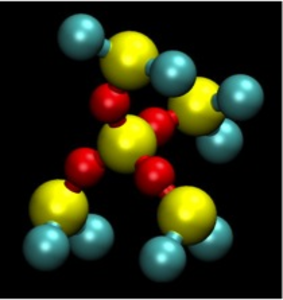
The cumputer generation of cross-linked polymers is computationally challenging due to the need of simulating the chemical reactions involving the creation of covalent bonds between the cross-linker molecule and PDMS. For this reason only few attempts have been made in order to describe the PDMS cross-links reactions via MD simulationsChenoweth et al. (2005); Shemella et al. (2011); Lacevic et al. (2008); Shernella et al. (2011); Heine et al. (2004) In this work the tetrakis(dimethylsiloxy) silane was used as cross linker (3) similarly to Ref. (Heine et al., 2004). Tetrakis(dimethylsiloxy) silane is composed by 1 central and 4 peripheral Silicon atoms, 4 Oxygen atoms, 8 Carbon atoms and 24 Hydrogen atoms.
.
In the presence of a catalyst, each tetrakis(dimethylsiloxy)silane cross-linker is able to bond to four terminal hydroxy groups on the PDMS chains via its 4 peripheral Si atoms. We simulate this mechanism by allowing the covalent bonds between pairs of atoms to dynamically create, during the MD simulation, according to specified criteria. In particular, the cross-linking reaction is mimicked by forming a bond between one of the 4 terminal peripheral Si on the cross-linker and the nearest terminal O on the PDMS chain. The bond forms with unit probability when the Si and O atoms are separated by a distance less than 0.1 nm. According to the experimental dataMIL , we use a 8 cross-linkers weight occurrence, corresponding to 7200 cross-linker molecules. In order to reduce the computational cost of the PDMS cross linking procedure, we initially work on the previously equilibrated EM-PDMS building-block (see previous section) by adding 10 cross-linker molecules (corresponding to a 8 occurrence). After this preparatory step, we replicate the so obtained building-block (see below) in order to generate the whole PDMS substrate. At this point we performed a NVT simulation at T=500 K for 0.1 ns in which the cross-linker molecules and PDMS were allowed to dynamically bond according to the criteria specified above. After 0.1 ns more than 90 of cross-linkers were bonded to PDMS.
All the simulations are performed by using the LAMMPS code PLIMPTON (1995). The velocity-Verlet algorithm with a time step of 1.0 fs is used to solve the equations of motion. A particle-mesh Ewald algorithm is used for the long-range electrostatic forces, and the Van der Waals interactions were cut off at 0.1 nm. The Nosé -Hoover thermostat/barostat with corresponding relaxation times equal to 100 and 500 fs are used to control the simulation temperature and pressure, respectively.
II.4 Metal cluster
As for the description of the Au-nc, we also use the COMPASS force-field, and in particular the Lennard-Jones potential. In fact face-centered cubic (fcc) elemental metals can be successfully described by means of suitable Lennard-Jones potentialsHeinz et al. (2008). The COMPASS Lennard-Jones and parameters for Au have been recently further optimized in order to describe: densities, surface tensions, interface properties with organic molecules. All these properties are found in good agreement with experiments performed under ambient conditionsHeinz et al. (2008).
II.5 Simulation procedure
Once the PDMS building-block (both EM and CL) is equilibrated we obtain the PDMS substrate for the SCBI simulation by the following procedure:
-
1.
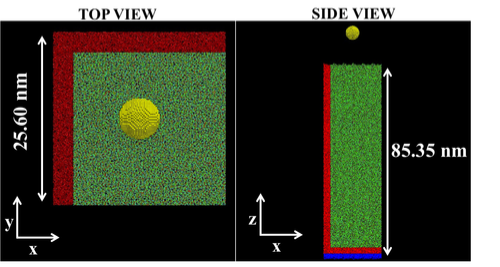
We replicate x x times (where N, L, and M are integers) the basic building-block along the , and directions respectively. We then equilibrate such a PDMS bulk sample for ns at a temperature T=500 K under orthorhombic periodic boundary conditions along the , and directions (see 4). This annealing step is crucially important in order to remove possible artifacts deriving from the previous fictitious periodicity imposed by the replica of the PDMS basic building-block.
-
2.
Once the bulk PDMS sample is equilibrated, we create the PDMS surface by removing the periodic boundary conditions along the direction and by further equilibrating the slab sample for 0.1 ns at T=300K . While the topmost surface is let to freely age under any following MD run, the bottom surface is kept fixed in order to emulate a macroscopically thick experimental sample.
II.6 Simulation cell architecture
One of the main issues related to implantation simulations is due to the presence of the (x,y) periodic boundary conditions that can eventually give rise to unphysical interactions (i.e. overlap between pressure and temperature waves generated upon the cluster impact) between neighbor cell replica. In order to avoid such artifacts, we create a frame region at the cell boundaries which are coupled to a Nosé -Hoover thermostat. The role of the frame region is to mimic a bulk absorbing the excess of heat generated upon the cluster impact.The rest of the simulation cell, where the cluster impact actually takes place, is simulated without any thermostat or barostat. In other words, atomic trajectories in this region are aged according to pure Newton dynamics. The simulation cell architecture is shown in 4 where the fixed bottom region is shown in blue, the frame region coupled to a thermostat (lateral and bottom region) in red, while the rest of the cell evolves by means of newtonian dynamics.
We then place the Au-nc with the center of mass at a distance of nm from the EM-PDMS surface. According to the SCBI experimental dataMIL the cluster vibrational temperature before the impact is 100 K while the PDMS temperature is 300 K. Therefore we equilibrate the Au-nc at T=100K and the PDMS at 300 K for 0.1 ns before the impact.
II.7 Choice of the substrate dimensions.
We select the optimal substrate dimensions by performing several implantation simulations on different EM-PDMS substrates of increasing thickness and section.
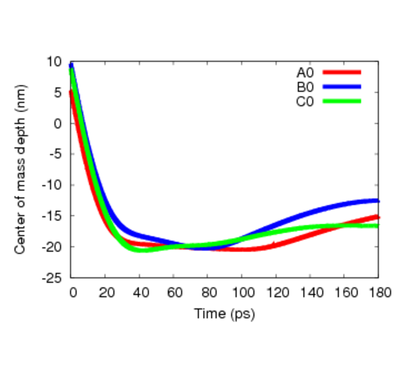
The implantation simulations are performed by considering Au-nc having a radius of nm implanted at an energy of eV/atom along the direction (see 4) . 5 shows the time evolution of the Au-nc penetration depth during the implantation. The cluster penetration depth at time is calculated as the difference between the maximum EM-PDMS surface height at = ps and the cluster center of mass height at time . We test three different substrate dimensions having different lateral dimensions and depths as shown in 1. We observed that while the absolute penetration depth is not largely affected by the substrate dimension, the long-time microstructure evolution sizably depends on them.
| Sample A0 | Sample B0 | Sample C0 | |
|---|---|---|---|
| x,y (nm) | 1 | 1 | |
| z (nm) | |||
| # atoms |
In particular, while in the case of and the cluster position on the PDMS polymer is not stabilized after ps, the substrate has an optimal lateral dimension and depth that allows to efficiently absorb the pressure wave generated upon the cluster impact stabilizing the cluster position inside the EM-PDMS after 180 ps. For this reason we choose the substrate for the implantation simulations. The time where all the transient post-implantation phenomena are terminated will be hereafter identified as .
III Results: Implantation of 3 nm Au clusters
III.1 Entangled melt vs. cross-linked PDMS
After the equilibration of the PDMS+Au-nc system, we perform three different SCBI simulation, respectively with implantation energy , and eV/atom. We chose Au-nc having a radius of nm, comparable to the experimental SCBI data ( nm)Corbelli et al. (2011). As far as concern the implantation energy, besides eV/atom, which is the actual experimental value, we choose also larger implantation energies ( and eV/atom) to verify the effect of this parameter on the cluster penetration and PDMS response.
6 shows the time-evolution of the cluster center of mass penetration depth (top) and the corresponding velocity (bottom) during the simulation, on the EM-(left) and CL-(right) PDMS.
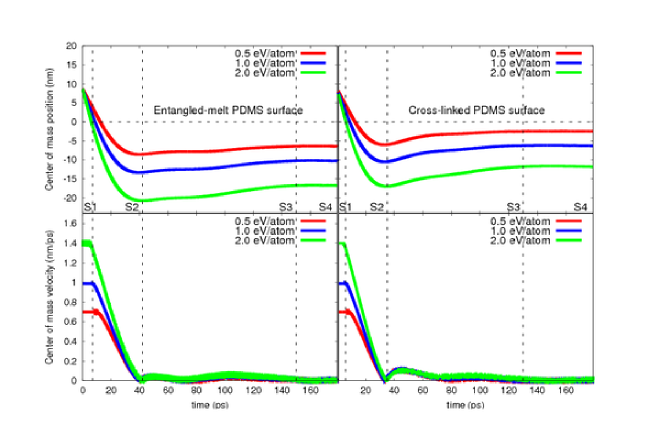
Based on 6 we can distinguish 4 different microstructure evolution regimes for both EM-and CL-PDMS (hereafter referred to as , , and respectively) depending on the polymer response to the cluster implantation. During step the cluster moves in vacuo by linear uniform motion having a constant velocity depending on the implantation kinetic energy. During step the cluster impacts on the PDMS surface, penetrates inside the substrate and is eventually stopped by friction. During step we observe the PDMS response to the cluster impact, at first (cluster penetration) the polymer film undergoes a sizable compression which is then released by its elastic response, able to drag the implanted cluster upward in the polymer. Finally, during step the polymer elastic response is damped and the cluster stabilizes inside the PDMS substrate at a given depth. These four steps are observed for both EM- and CL-PDMS, independently of the implantation energy, while the respective time duration every regime takes place depends on the initial implantation energy. In particular, we observe that steps and are longer by increasing the implantation energy, while the cluster stabilization period increases by decreasing the implantation energy.
From 6 (top panel) we highlight the differences between the post-implantation evolution in EM- and CL-PDMS. We notice that the cluster penetration depth in EM-PDMS is greater than in the CL-PDMS. This is due to the fact that in the previous system the polymer chains are bonded only via dispersion and electrostatic interactions, while in the latter one the chains are partially covalently linked via the cross-linker molecule. Since the cluster penetration inside the PDMS matrix involves the breaking of the inter-chains bonds, we conclude that during the penetration inside the EM-PDMS substrate, the cluster experiences a weaker friction with respect to CL-PDMS. This picture is confirmed by the analysis of the cluster velocity during the implantation (6, bottom panel). In the case of the CL-PDMS the cluster velocity takes a zero value earlier ( 35 ps) than in the case of EM-PDMS ( 40 ps).
We also observe that the polymer response upon the cluster implantation is more pronounced in the case of CL-PDMS. In fact, we observe a polymer swelling upon the cluster implantation which we quantified as the difference between the polymer maximum height after the implantation at t= and before the implantation at ps. In the case of the CL-PDMS we observe a polymer swelling of 3 nm, independently of the implantation energy. On the other hand the EM-PDMS swelling was always less than 1 nm. This difference can be explained by considering that in the case of CL-PDMS the number of internal bonds increases by 8 due to the presence of the cross linker. Therefore, we expect a comparatively larger elastic response upon the implantation.It is worth remarking that such a swelling phenomena have been indeed observed experimentallyMIL .This qualitative agreement between real and simulated SCBI process stands for the overall reliability of the present computational setup.
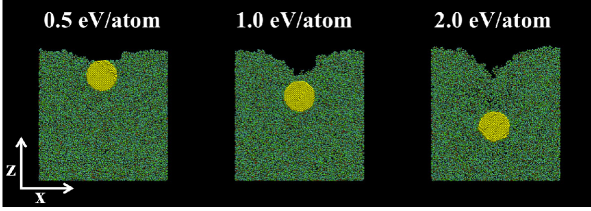
7 shows the final structures at of a (x,y) EM-PDMS section having depth of 2 nm and height of 30 nm (similar structures were observed for CL-PDMS). This cross-view confirms that the cluster penetration depth increases with the implantation energy, but also adds valuable new information, namely: the polymer surface is strongly damaged upon the cluster implantation (in particular for the implantation energy of 2 eV/atom). We observe the presence of a crater created on the PDMS surface upon the cluster implantation. The lateral dimensions of the crater are almost unchanged by increasing the implantation energy, while its depth strongly depends on the implantation energy as well as the surface roughness. This feature will be more extensively investigated in a following paperMelis et al. (2013).
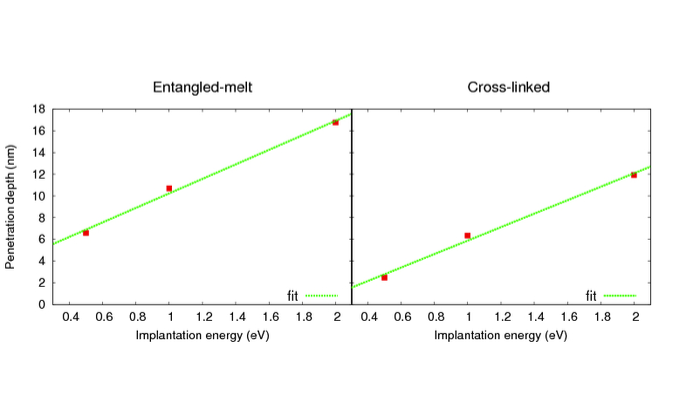
In 8 we plot the cluster penetration depth vs. the implantation energy in the case of EM-(left) and CL-(right) PDMS. As predicted by 1, a linear relationship is found which we easily fit finding that by increasing the implantation energy by eV/atom cluster penetration depth increases by nm and nm for EM-and CL-PDMS, respectively. This information is useful for the SCBI experiments since it allows to tune the cluster penetration depth by changing the cluster implantation energy. We further remark that the internal cohesive energy contribution in the case of CL-PDMS is 1.2 times larger than EM-PDMS. Therefore we expect a corresponding decrease in in the cluster penetration depth as indeed referred in 1.
Besides the cluster penetration depth it is important to characterize the temperature and pressure waves generated inside the PDMS substrate upon the cluster implantation. For this reason we calculate the substrate temperature during the implantation as a function of the PDMS depth.
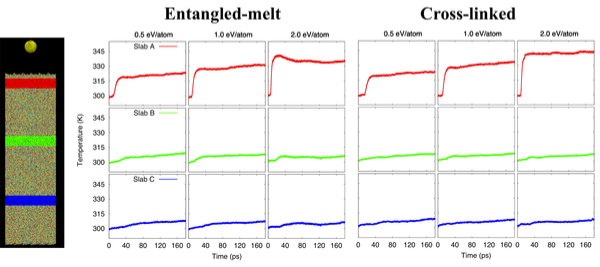
9 shows the temperature of three slabs (,,) for the EM- AND CL-PDMS samples during the 180 ps -long simulation. We choose slab close to the EM-PDMS surface(70-20 nm depth), slab corresponding the middle of the substrate (370-320 nm depth), and slab close to the PDMS bottom (670-620 nm depth). We observe a sudden temperature increase upon the implantation for both EM- and CL-PDMS samples. In particular the overall temperature increase corresponding to the slab close to the surface () goes from 20 K to 50 K by increasing the implantation energy. This temperature wave propagates inside the substrate being strongly dumped for deeper slabs ( 10 K and 5 K). At we observe two main temperature regions present in the polymer, namely: a ”hot” region () at temperature in the range 320-350 K close to the surface and another ”cold” region at temperature in the range of 300-310 K at larger depth. We observe that the overall temperature increase is always larger for the cross-linked substrate. We attribute this feature the different stiffness: the deformation upon the impact is larger in the case of the EM-PDMS substrate thus resulting in a comparatively reduced increase of temperature.
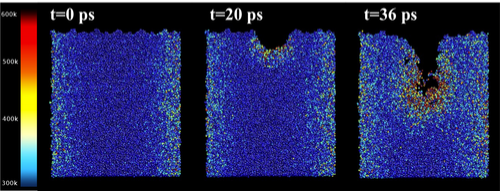
10 shows the time evolution of the temperature wave on CL-PDMS for implantation energy of 2.0 eV/atom. For sake of clarity we represent only a PDMS slice having thickness of 2 nm and height of 30 nm, without the cluster. Each atom is colored according to its local kinetic temperature: red color corresponds to a temperature of 600 K while blue color corresponds to 300 K. As due to the cluster impact (for t 20 ps) we observe that the local temperature of the atoms in contact with the implanted Au-nc increases up to 600 K. This temperature wave propagates inside the polymer being increasingly dumped with the polymer depth. Therefore, besides the temperature increase observed on the PDMS surface, we observe a dramatic temperature rising on the cluster impact area. We expect that the local properties of the polymer (such as density, number of covalent bonds, pressure) will be remarkably changed upon the cluster impact, favoring the penetration of the next clusters to be implanted.
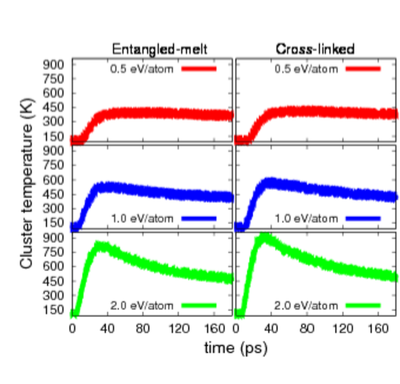
We also calculate the cluster temperature during implantation which suddenly increases after the impact as reported in 11. In 2 we summarize the temperature increase at which depends on the implantation energy. The most interesting observation is that the structure of the substrate affects the maximum temperature reached at the cluster.
| 0.5 eV/atom | 1.0 eV/atom | 2.0 eV/atom | |
|---|---|---|---|
| (K) | 257 | 293 | 369 |
| (K) | 264 | 307 | 376 |
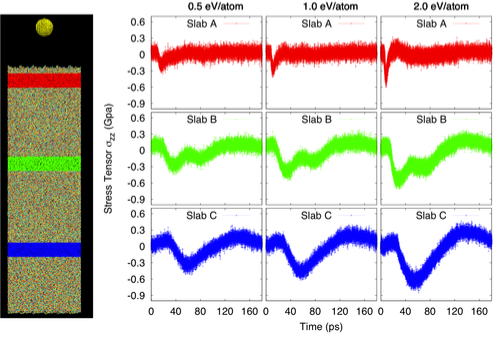
The cluster implantation gives rise as well to a pressure wave inside the PDMS. 12 shows the component of the stress tensor ( along the implantation direction of three slabs (,, ) during the 180 ps -long the simulation for the EM-PDMS sample. We choose slab close to the EM-PDMS surface(70-20 nm depth), slab corresponding the middle of the substrate (370-320 nm depth), and slab close to the PDMS bottom (670-620 nm depth). As found for the temperature we observe a pressure wave traveling inside the PDMS substrate upon the cluster implantation. From 12 we can also identify the same steps previously detected: in the first part of the simulation () before the cluster impact the pressure oscillates around a constant value. Then, upon the impact () we observe a pressure increase on the direction of the cluster initial velocity. Then, we observe the PDMS response () marked by a pressure increase on the opposite direction with respect to the cluster initial velocity. Finally we observe the regime when the the pressure stabilizes around the initial value. Similar results were found for CL-PDMS.
III.2 Conclusions
In the present investigation we study by means of atomistic model potential molecular dynamics the implantation of Au-nanoclusters on a PDMS polymer and the following polymer microstructure evolution. We compare the response of two different PDMS amorphous structures: i) entangled melt and ii) crossed-linked. We show that for both entangled-melt and cross-linked Polydimethylsiloxane the cluster penetration depth inside the polymer linearly depends on the implantation energy having an angular coefficient of nm/eV in the case of entangled-melt PDMS and of nm/eV for cross-linked PDMS. In particular we observe that in the case of entangled-melt Polydimethylsiloxane the penetration depth is larger than cross-linked. We show that even a single cluster impact on the Polydimethylsiloxane substrate remarkably changes the polymer local temperature and pressure. Moreover we observe the presence of craters created on the polymer surface having lateral dimensions comparable to the cluster radius and depths strongly dependent on the implantation energy. Finally, present simulations suggest that the substrate morphology is largely affected by the cluster impact and that most-likely such modifications favor the the penetration of the next impinging clusters.
III.3 Aknowledgments
This work has been funded by the Regione Autonoma della Sardegna and Regione Lombardia under Project ”ELDABI”. We acknowledge computational support by CINECA (Casalecchio di Reno, Italy). We are glad to acknowledge Paolo Milani (University of Milan), Luca Ravagnan (WISE S.r.l.), Sandro Ferrari (WISE S.r.l.) and Cristian Ghisleri (WISE S.r.l) for useful discussions.
References
- Lee et al. (2006) Lee, S.; Koo, B.; Park, J. G.; Moon, H.; Hahn, J.; Kim, J. M. Mrs Bulletin 2006, 31, 455–459
- Rogers et al. (2001) Rogers, J. A.; Bao, Z.; Baldwin, K.; Dodabalapur, A.; Crone, B.; Raju, V. R.; Kuck, V.; Katz, H.; Amundson, K.; Ewing, J.; Drzaic, P. Proceedings of the National Academy of Sciences of the United States of America 2001, 98, 4835–4840
- Gelinck et al. (2004) Gelinck, G. H. et al. Nature Materials 2004, 3, 106–110
- Someya et al. (2005) Someya, T.; Kato, Y.; Sekitani, T.; Iba, S.; Noguchi, Y.; Murase, Y.; Kawaguchi, H.; Sakurai, T. Proceedings of the National Academy of Sciences of the United States of America 2005, 102, 12321–12325
- Baude et al. (2003) Baude, P. F.; Ender, D. A.; Haase, M. A.; Kelley, T. W.; Muyres, D. V.; Theiss, S. D. Applied Physics Letters 2003, 82, 3964–3966
- Cantatore et al. (2007) Cantatore, E.; Geuns, T. C. T.; Gelinck, G. H.; van Veenendaal, E.; Gruijthuijsen, A. F. A.; Schrijnemakers, L.; Drews, S.; de Leeuw, D. M. Ieee Journal of Solid-state Circuits 2007, 42, IEEE
- Ouyang et al. (2004) Ouyang, J. Y.; Chu, C. W.; Szmanda, C. R.; Ma, L. P.; Yang, Y. Nature Materials 2004, 3, 918–922
- Mayer et al. (2007) Mayer, A. C.; Scully, S. R.; Hardin, B. E.; Rowell, M. W.; McGehee, M. D. Materials Today 2007, 10, 28–33
- Schubert and Werner (2006) Schubert, M. B.; Werner, J. H. Materials Today 2006, 9, 42–50
- Engel et al. (2006) Engel, J.; Chen, J.; Liu, C. Applied Physics Letters 2006, 89, 221907
- Rosset et al. (2009) Rosset, S.; Niklaus, M.; Dubois, P.; Shea, H. R. Journal of Microelectromechanical Systems 2009, 18, 1300–1308
- Kim et al. (2008) Kim, D.-H.; Ahn, J.-H.; Choi, W. M.; Kim, H.-S.; Kim, T.-H.; Song, J.; Huang, Y. Y.; Liu, Z.; Lu, C.; Rogers, J. A. Science 2008, 320, 507–511
- Whitesides (2006) Whitesides, G. M. Nature 2006, 442, 368–373
- Mandlik et al. (2008) Mandlik, P.; Gartside, J.; Han, L.; Cheng, I.-C.; Wagner, S.; Silvernail, J. A.; Ma, R.-Q.; Hack, M.; Brown, J. J. Applied Physics Letters 2008, 92, 103309
- Dollase et al. (2002) Dollase, T.; Spiess, H. W.; Gottlieb, M.; Yerushalmi-Rozen, R. Europhysics Letters 2002, 60, 390–396
- Graz et al. (2009) Graz, I. M.; Cotton, D. P. J.; Lacour, S. P. Applied Physics Letters 2009, 94, 071902
- Maggioni et al. (2004) Maggioni, G.; Vomiero, A.; Carturan, S.; Scian, C.; Mattei, G.; Bazzan, M.; Fernandez, G. D.; Mazzoldi, P.; Quaranta, A.; Della Mea, G. Applied Physics Letters 2004, 85, 5712–5714
- Ravagnan et al. (2009) Ravagnan, L.; Divitini, G.; Rebasti, S.; Marelli, M.; Piseri, P.; Milani, P. Journal of Physics D-applied Physics 2009, 42, 082002
- Corbelli et al. (2011) Corbelli, G.; Ghisleri, C.; Marelli, M.; Milani, P.; Ravagnan, L. Advanced Materials 2011, 23, 4504
- Anders and Urbassek (2008) Anders, C.; Urbassek, H. M. Nuclear Instruments & Methods In Physics Research Section B-beam Interactions With Materials and Atoms 2008, 266, 44–48
- Carroll et al. (2000) Carroll, S. J.; Nellist, P. D.; Palmer, R. E.; Hobday, S.; Smith, R. Physical Review Letters 2000, 84, 2654–2657
- Sanz-Navarro et al. (2002) Sanz-Navarro, C. F.; Smith, R.; Kenny, D. J.; Pratontep, S.; Palmer, R. E. Physical Review B 2002, 65, 165420
- Marelli et al. (2011) Marelli, M.; Divitini, G.; Collini, C.; Ravagnan, L.; Corbelli, G.; Ghisleri, C.; Gianfelice, A.; Lenardi, C.; Milani, P.; Lorenzelli, L. Journal of Micromechanics and Microengineering 2011, 21, 045013
- Sun (1998) Sun, H. Journal of Physical Chemistry B 1998, 102, 7338–7364
- Heinz et al. (2008) Heinz, H.; Vaia, R. A.; Farmer, B. L.; Naik, R. R. Journal of Physical Chemistry C 2008, 112, 17281–17290
- Jonsdottir and Rasmussen (2000) Jonsdottir, S. O.; Rasmussen, K. New Journal of Chemistry 2000, 24, 243–247
- Sun and Rigby (1997) Sun, H.; Rigby, D. Spectrochimica Acta Part A-molecular and Biomolecular Spectroscopy 1997, 53, 1301–1323
- SUN (1995) SUN, H. Macromolecules 1995, 28, 701–712
- Makrodimitri et al. (2007) Makrodimitri, Z. A.; Dohrn, R.; Economou, I. G. Macromolecules 2007, 40, 1720
- Sides et al. (2002) Sides, S. W.; Curro, J.; Grest, G. S.; Stevens, M. J.; Soddemann, T.; Habenschuss, A.; London, J. D. Macromolecules 2002, 35, 6455
- Theodorou and Suter (1985) Theodorou, D. N.; Suter, U. W. Macromolecules 1985, 18, 1485
- Theodorou and Suter (1986) Theodorou, D. N.; Suter, U. W. Macromolecules 1986, 19, 139
- (33) http://accelrys.com/products/materials-studio/
- Fakhreddine and Zoller (1990) Fakhreddine, Y. A.; Zoller, P. J. Appl. Polym. Sci. 1990, 41, 1087
- Shih and J.Flory (1972) Shih, H.; J.Flory, P. Macromolecules 1972, 5, 758
- Chenoweth et al. (2005) Chenoweth, K.; Cheung, S.; van Duin, A. C. T.; Goddard, W. A.; Kober, E. M. Journal of the American Chemical Society 2005, 127, 7192–7202
- Shemella et al. (2011) Shemella, P. T.; Laino, T.; Fritz, O.; Curioni, A. Journal of Physical Chemistry B 2011, 115, 2831–2835
- Lacevic et al. (2008) Lacevic, N.; Gee, R. H.; Saab, A.; Maxwell, R. Journal of Chemical Physics 2008, 129, 124903
- Shernella et al. (2011) Shernella, P. T.; Laino, T.; Fritz, O.; Curioni, A. Journal of Physical Chemistry B 2011, 115, 13508–13512
- Heine et al. (2004) Heine, D. R.; Grest, G. S.; Lorenz, C. D.; Tsige, M.; Stevens, M. J. Macromolecules 2004, 37, 3857–3864
- (41) Private communications from Paolo Milani
- PLIMPTON (1995) PLIMPTON, S. Journal of Computational Physics 1995, 117, 1–19
- Melis et al. (2013) Melis, C.; L.Colombo,; Ravagnan, L.; Milani, P. 2013,