I. M. Nugent[on behalf of the BABAR Collaboration]
III. Physikalisches Institut, Physikzentrum, RWTH Aachen,
52056 Aachen
Department of Physics and Astronomy, University of Victoria,
PO Box 3055, STN CSC, Victoria, BC, V8W 3P6 Canada
Abstract
Using of annihilation data collected with the BABAR detector at the SLAC PEP-II electron-positron asymmetric energy
collider operating at a
center-of-mass energies near 10.58, we present the preliminary
measurements of the invariant mass
distributions of
,
,
and
, where events with decays
are excluded.
keywords:
Tau, Invariant-Mass
1 Introduction
Hadronic decays provide an opportunity to measure the coupling
strength of the weak current to the first
and second generations of quarks [1]. They also
provide a
clean environment to probe low energy QCD and measure fundamental
properties of the Standard Model of Particle Physics. Hadronic
decays also
play a critical role as a probe to search for new physics at the
LHC. With
the recent data collected at the B-Factory detectors, significant
improvements in our knowledge of the hadronic decay structure can be
made, allowing for improved modeling of decays at the LHC
and at the next generation B-Factories.
2 Detector, Data Sample and Monte Carlo samples
This analysis employs data collected with the BABAR detector at the
PEP-II storage ring which
has a centre-of-mass (CM) energy near () near 10.58. At these
energies, the cross section is
nb [2]. A detailed description of the BABAR detector and MC Simulation
can be found in [3] and [4].
3 Invariant Mass Measurements
The analysis of the invariant mass spectra presented in this work is a
continuation of branching fraction measurements from [4].
Therefore, the work presented here uses the event
selection procedure from [4], but incorporates results
from additional studies. For the event selection, a sample of
decays from
events is selected by requiring the partner to decay
leptonically.
Within this sample,
each of the mesons is uniquely identified as a charged pion
or kaon, and the decay
categorized as , , or , where
events with
have been excluded.
An efficiency correction, initially
obtained from MC and corrected using data control samples, is used
to correct for efficiency losses from the event selection
for each interval in the invariant mass distribution.
A detailed description of the selection can be found in
[4].
After events are selected
the invariant mass distributions are analyzed. First, an arithmetic
subtraction of the backgrounds is applied to the
invariant mass distributions for
each channel. The backgrounds between the channels caused
by particle mis-identification (cross-feed) are normalized to the
measured branching fractions in BABAR [4].
Detector effects are then removed using Bayesian Unfolding
[5], which has been trained using the signal MC
for each decay mode. The invariant
mass distributions are then normalized to unity.
4 Results
The measured and unfolded invariant mass distributions for the
,
, and can be seen in Figures
1 to 4. Due to the good resolution of
the BABAR detector, the unfolding procedure has a minor impact on
the
invariant mass distributions. This is in contrast to the subtraction
of the backgrounds which have the most significant impact on these
distribtuions.
The main backgrounds come from the
cross-feed from the other decays in which
a pion or kaon has been mis-identified and from events with an extra
. The cross-feed backgrounds are estimated to be
(0.850.01) for the channel, (38.50.2) for the
channel,
(2.90.1) for the channel and
(27.73.0) for the channel, where the uncertainties are
from MC statistics.
The background fractions from events with an extra
in the candidate samples
are estimated to be (3.6 0.3)% from in , (2.3 0.4)%
from in
, (0.4 0.1)% from
in and less than 5.0% from in .
The non- backgrounds comprise less than 0.5% of the events for
each channel.
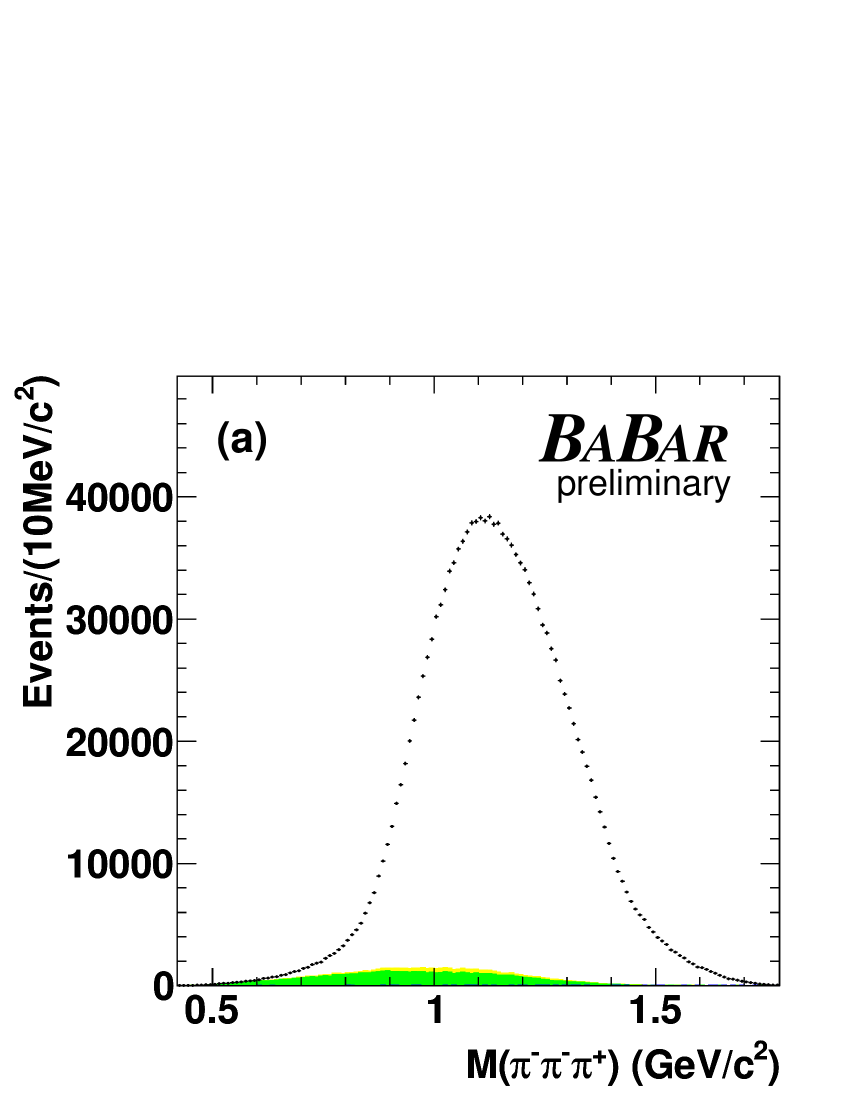
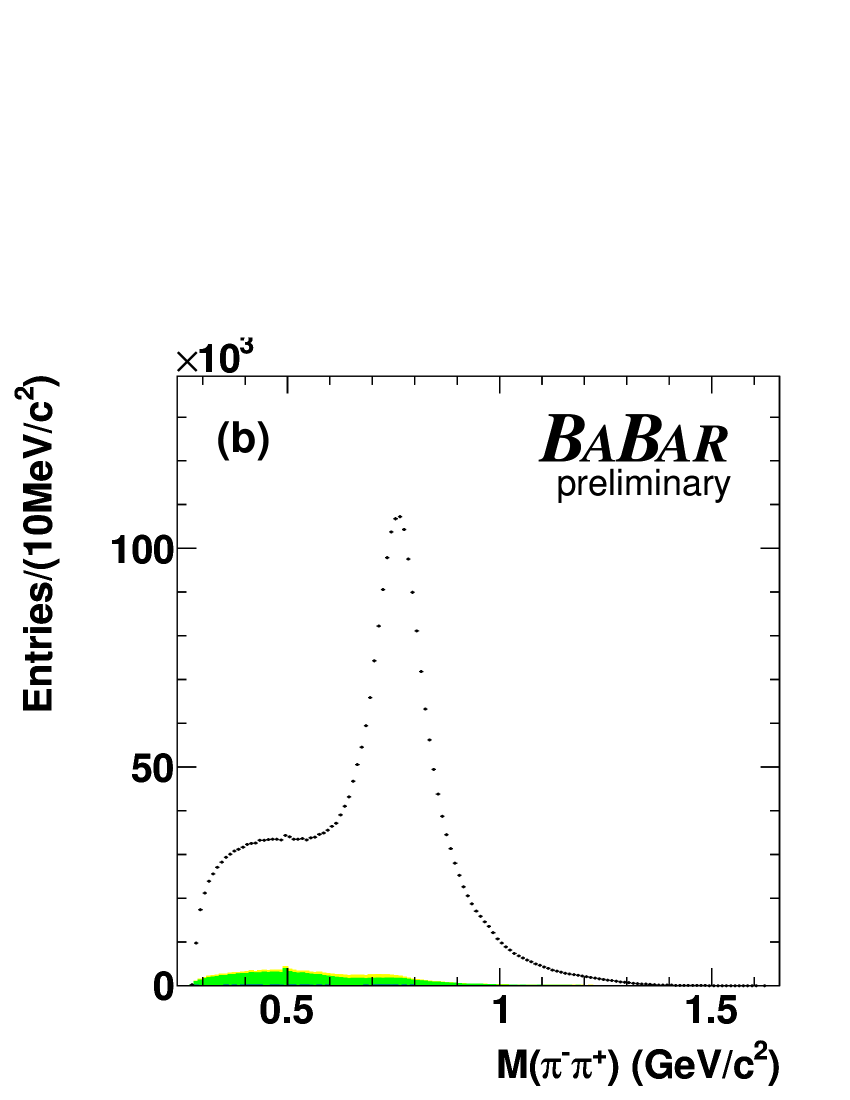
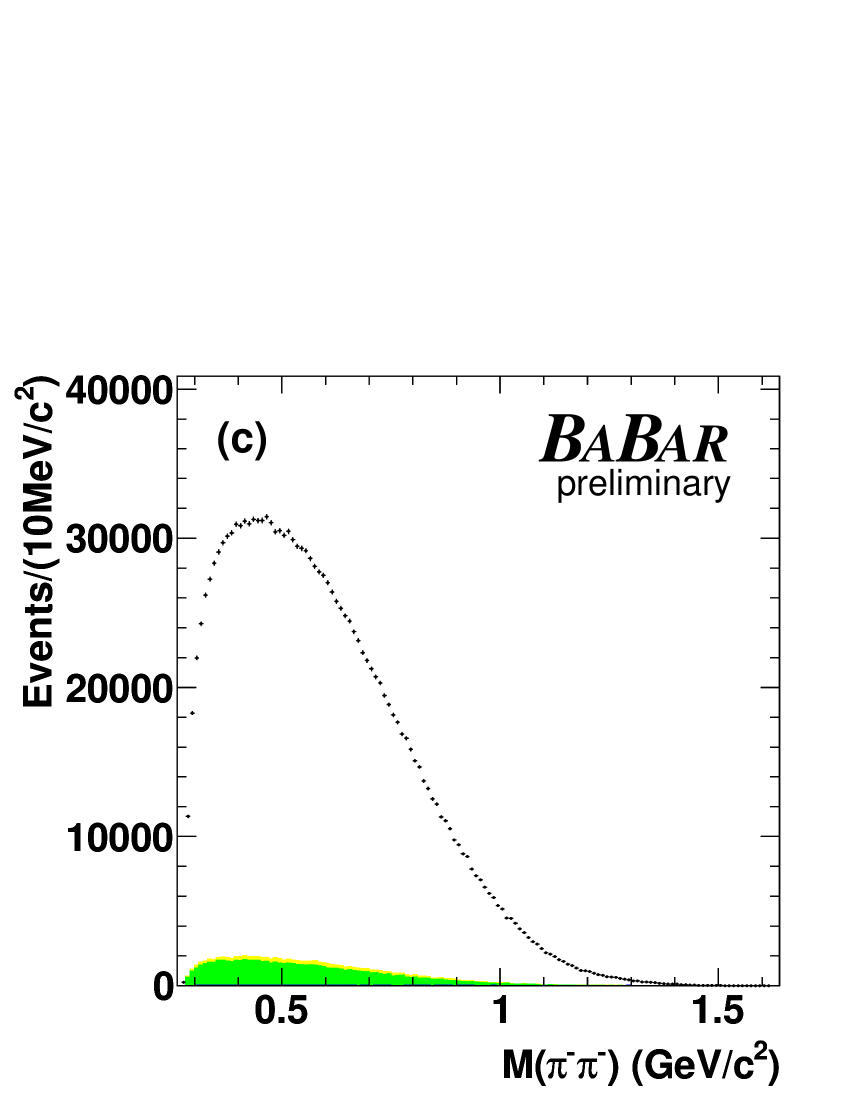
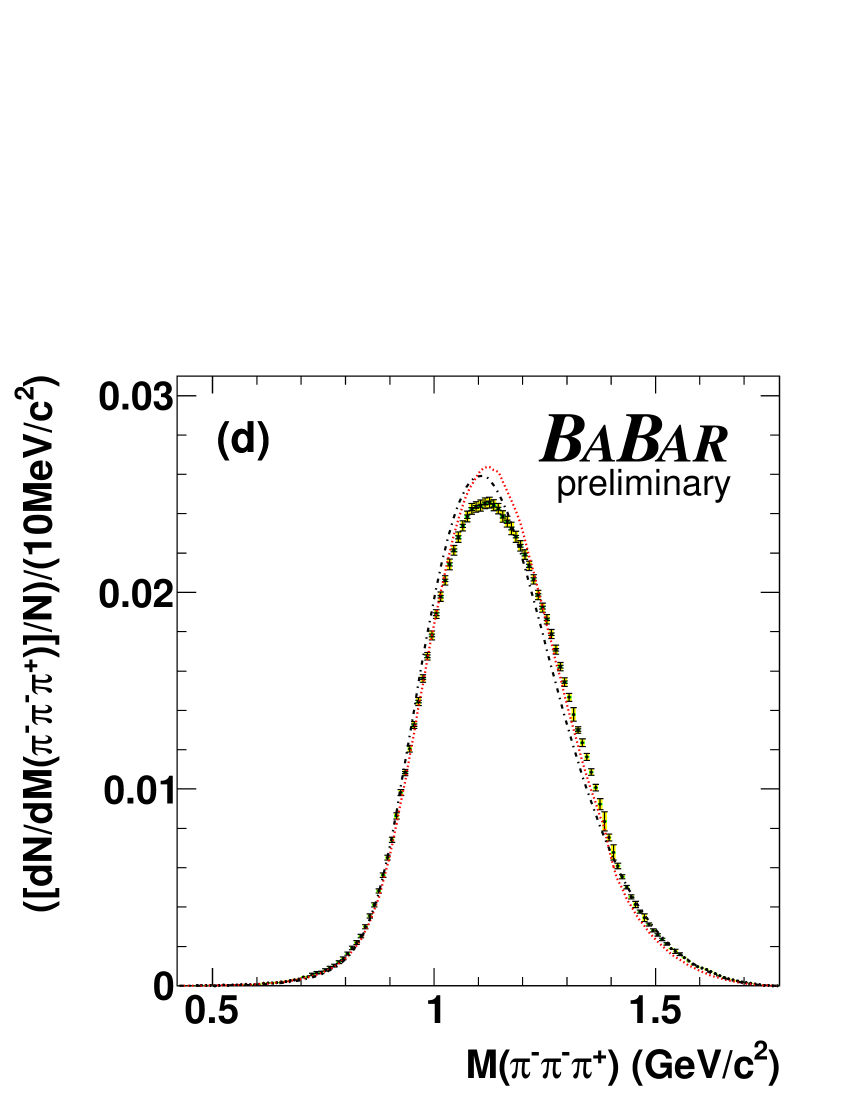
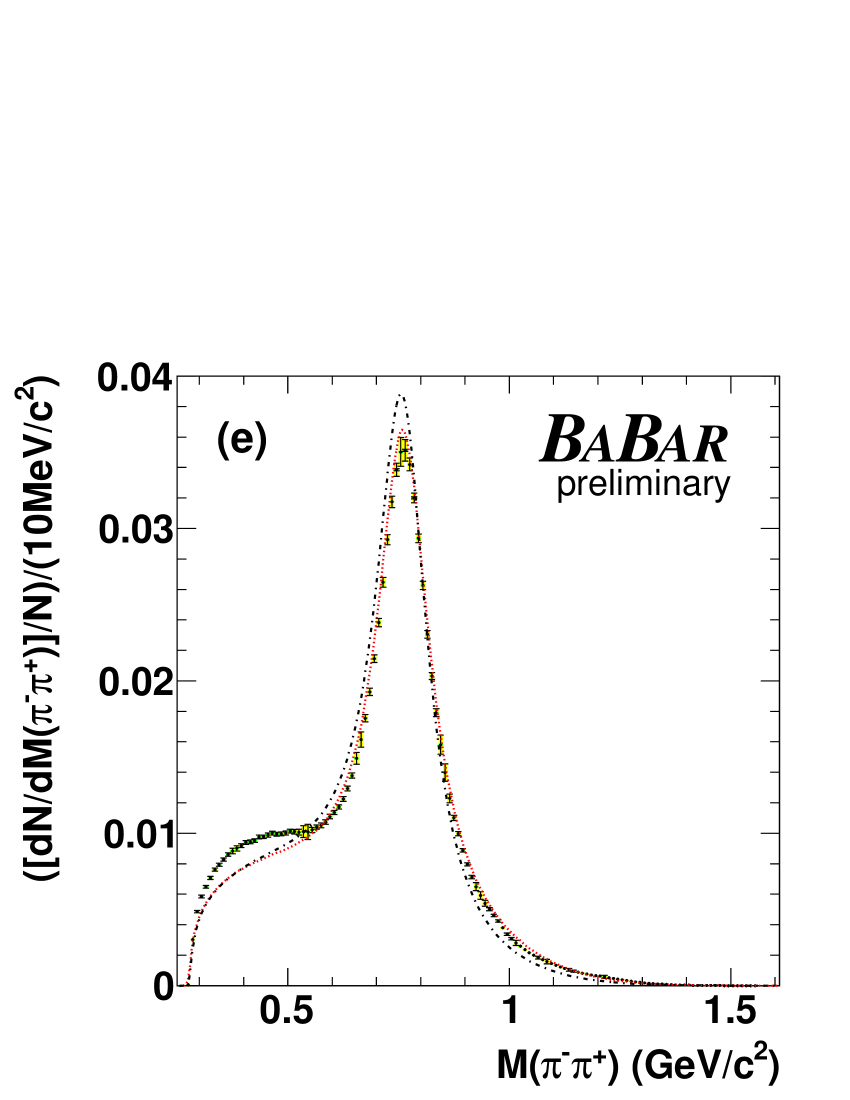
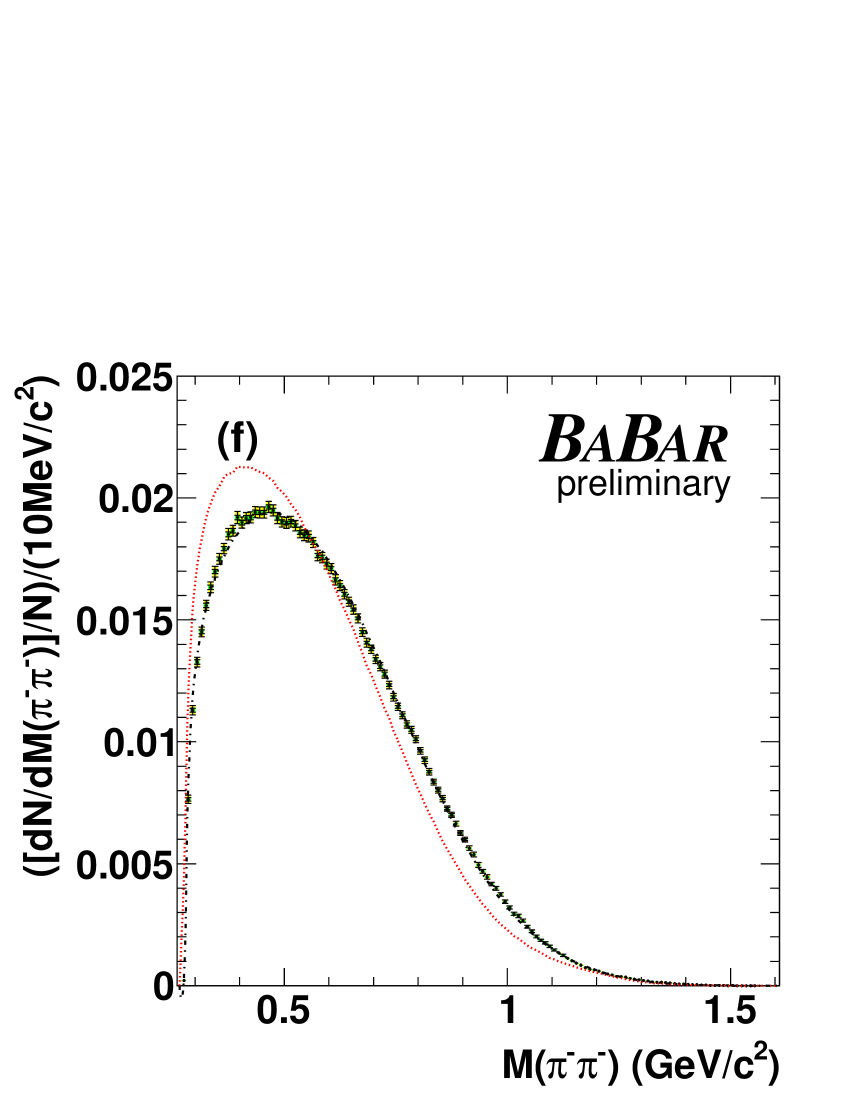
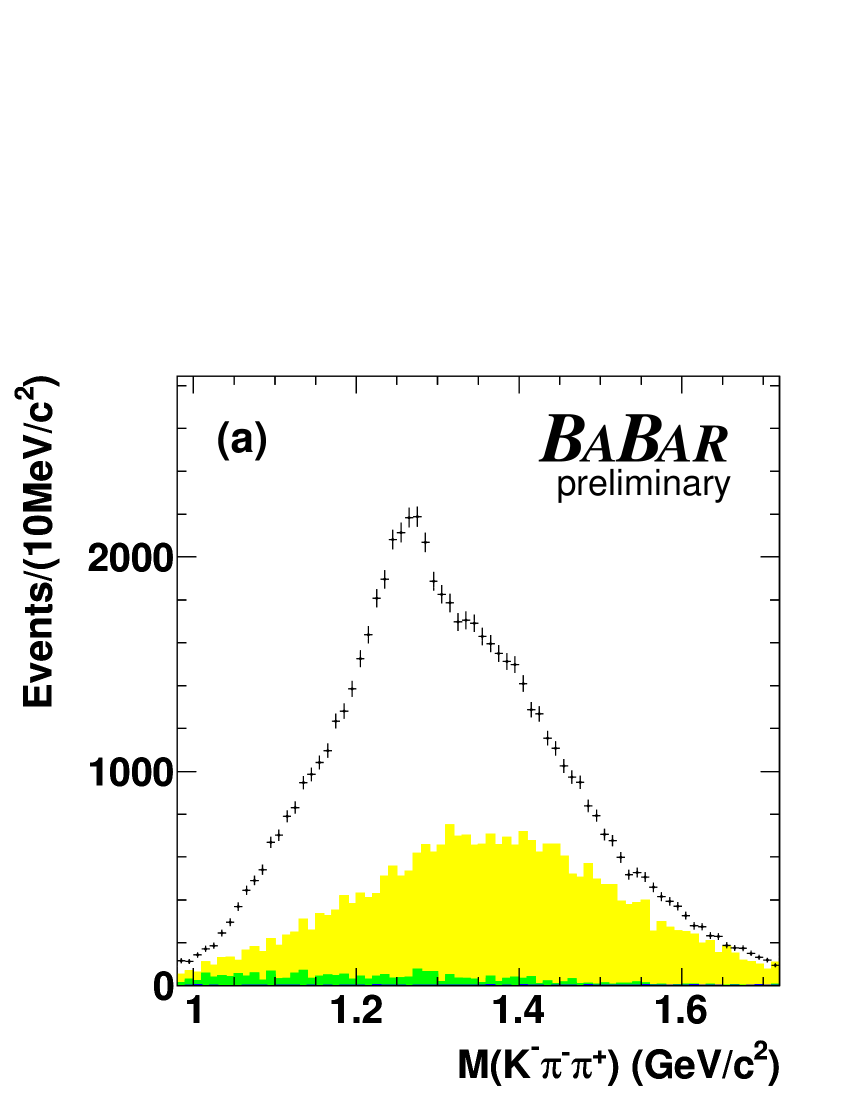
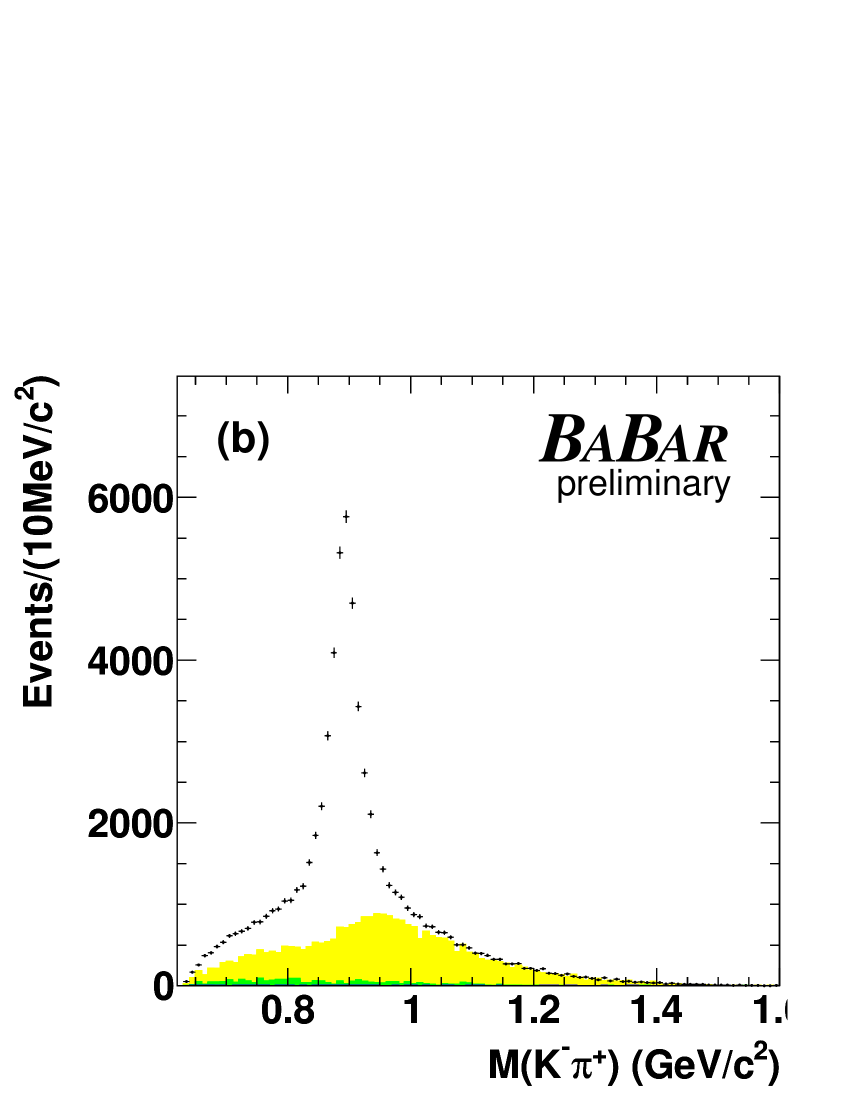
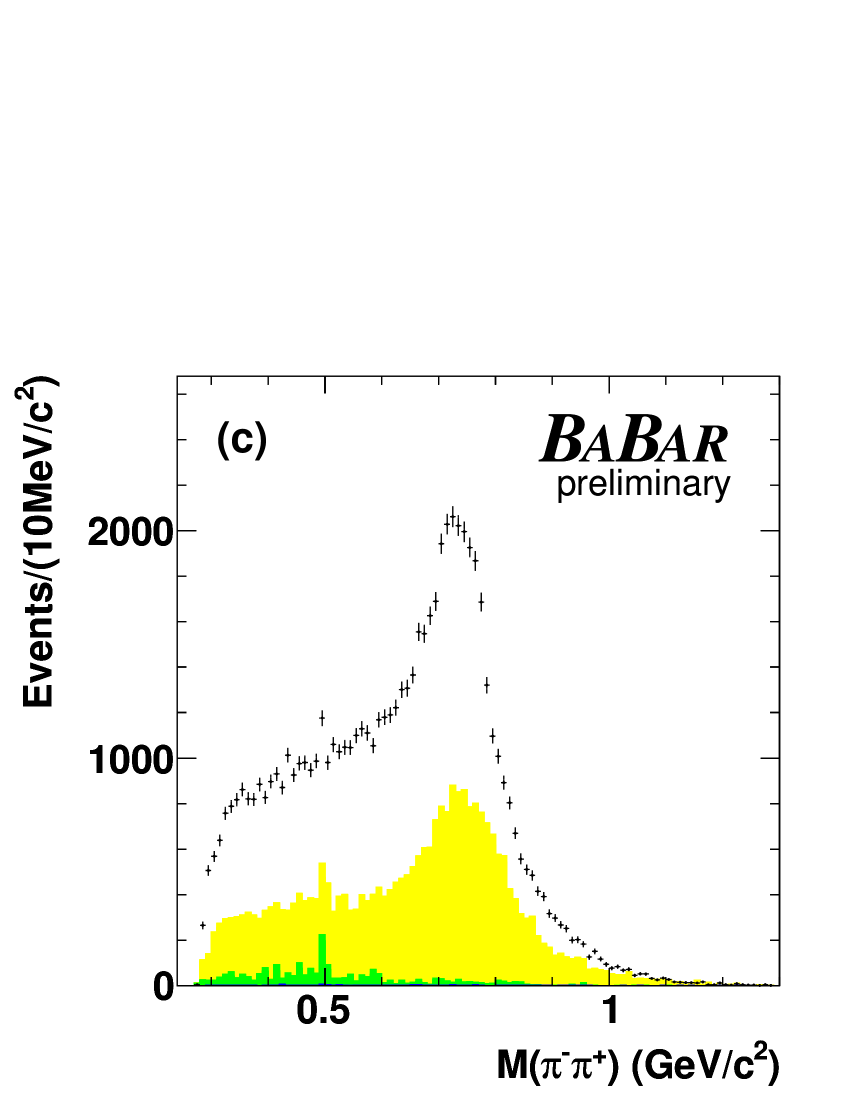
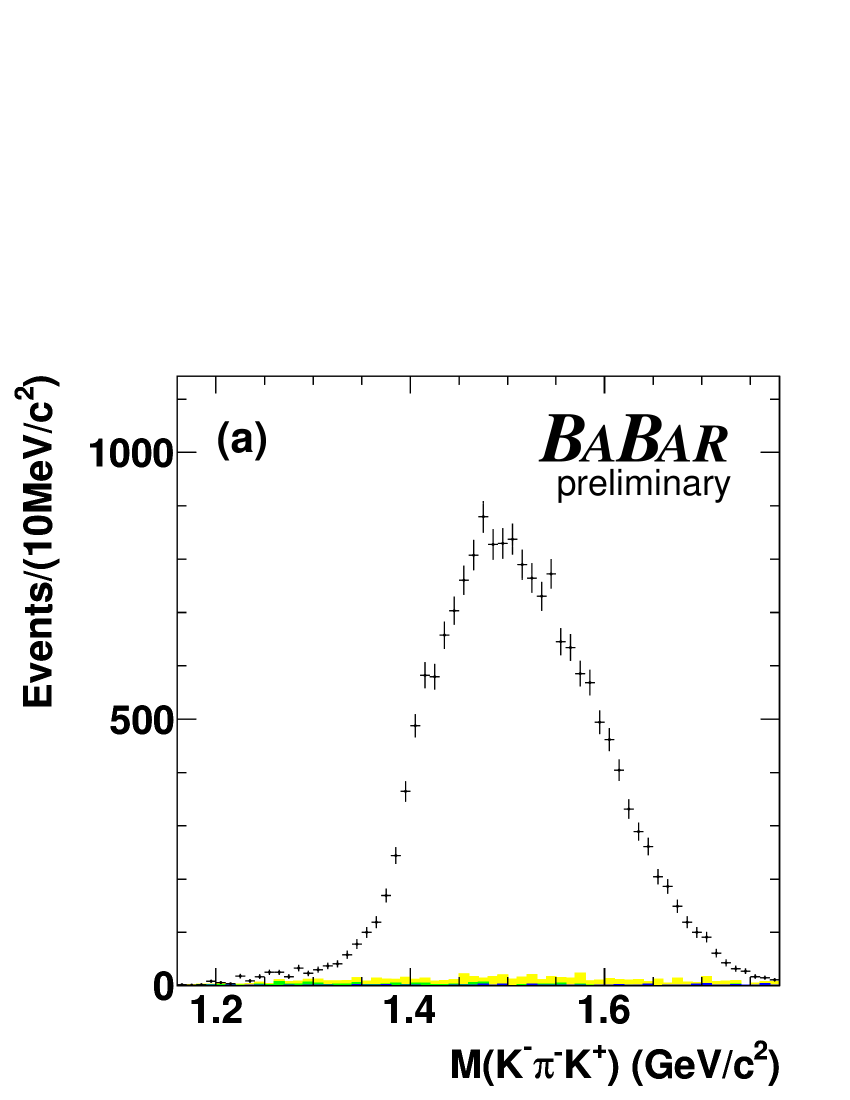
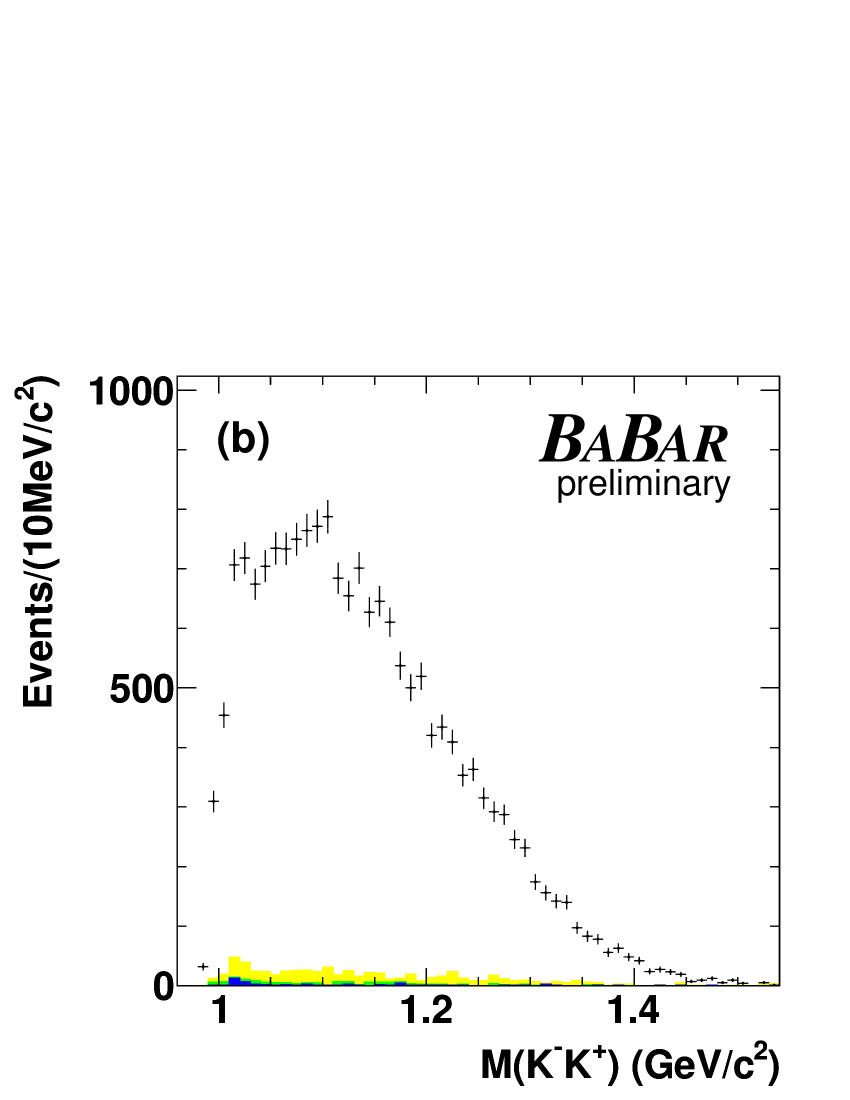
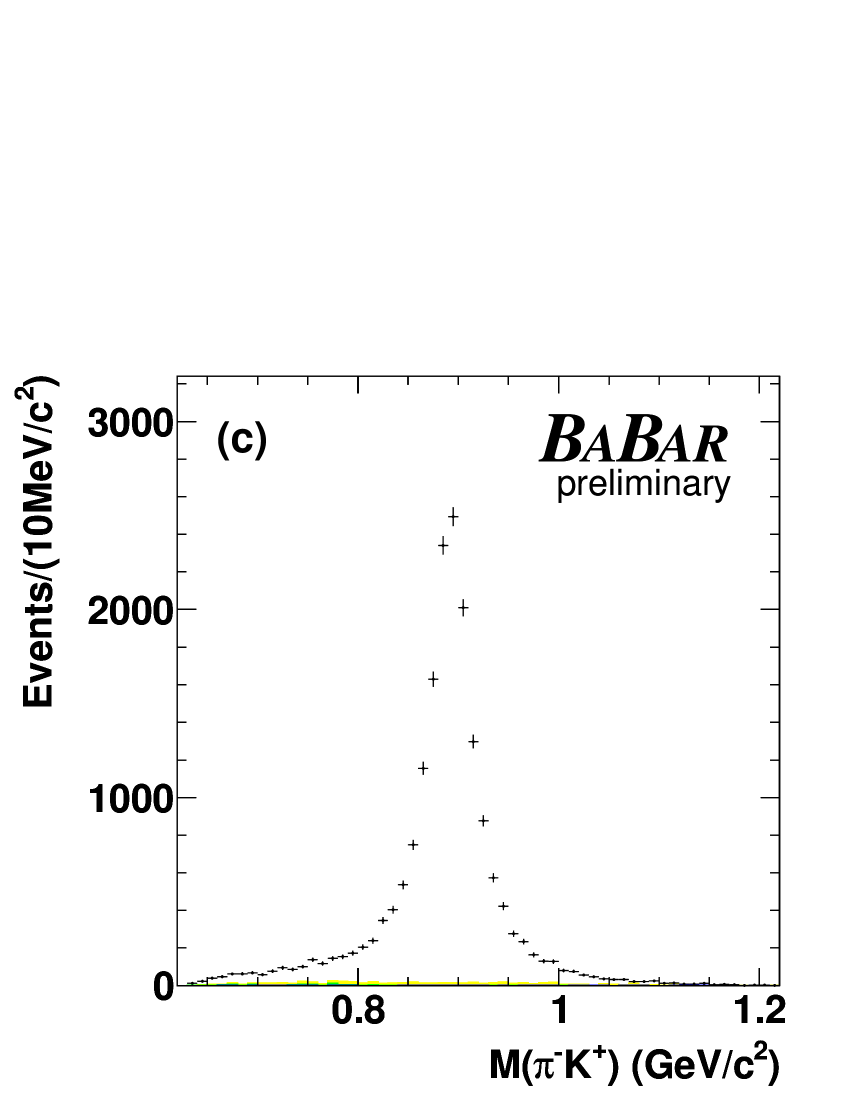
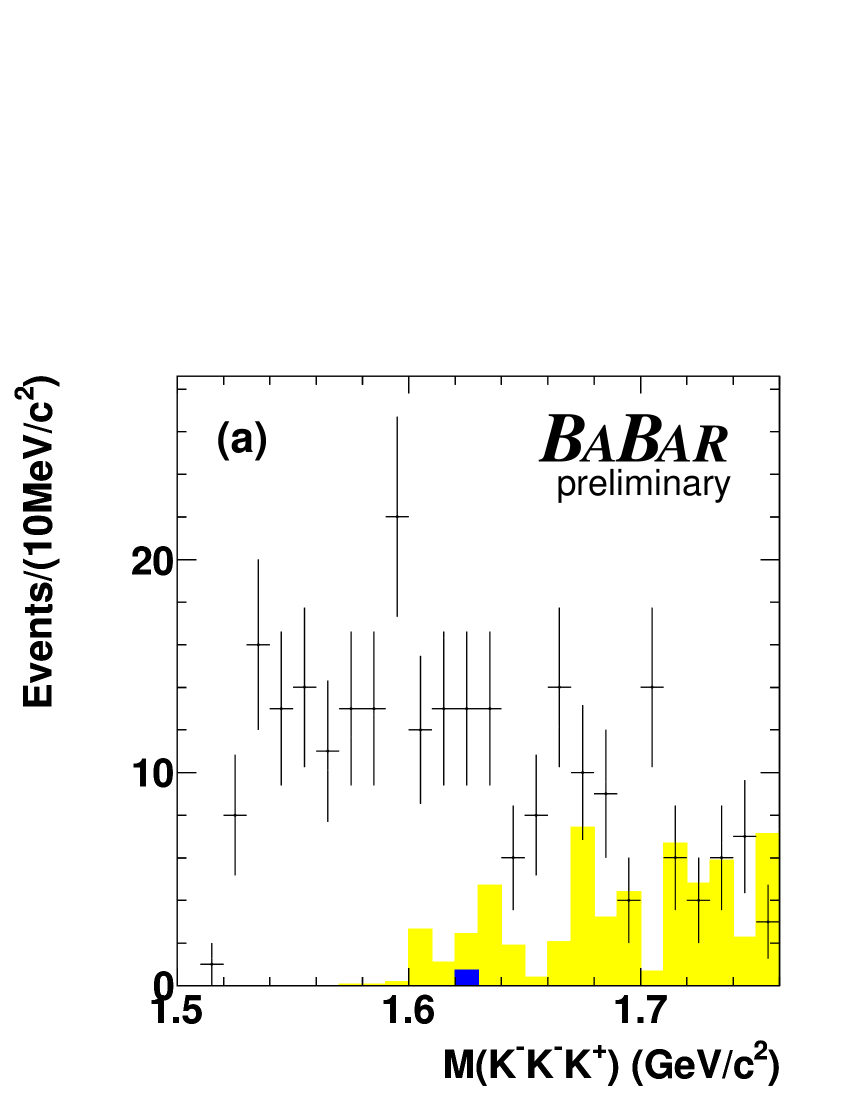
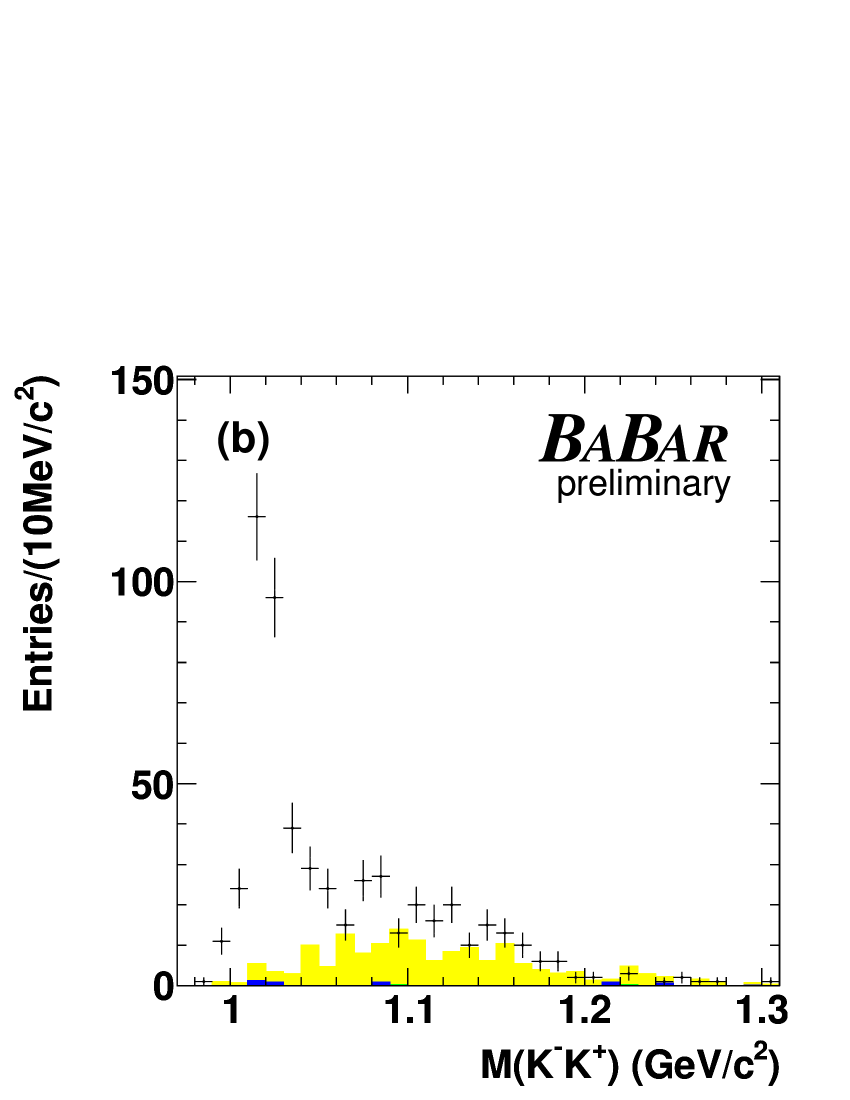
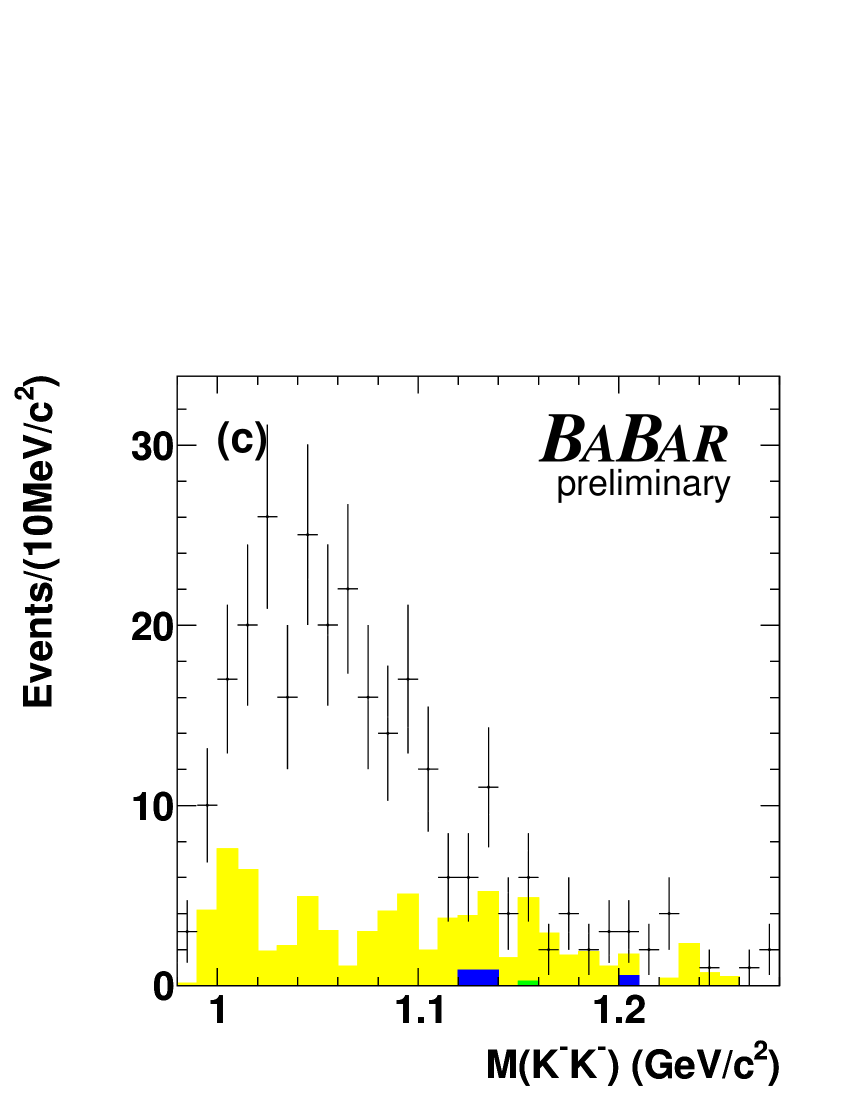
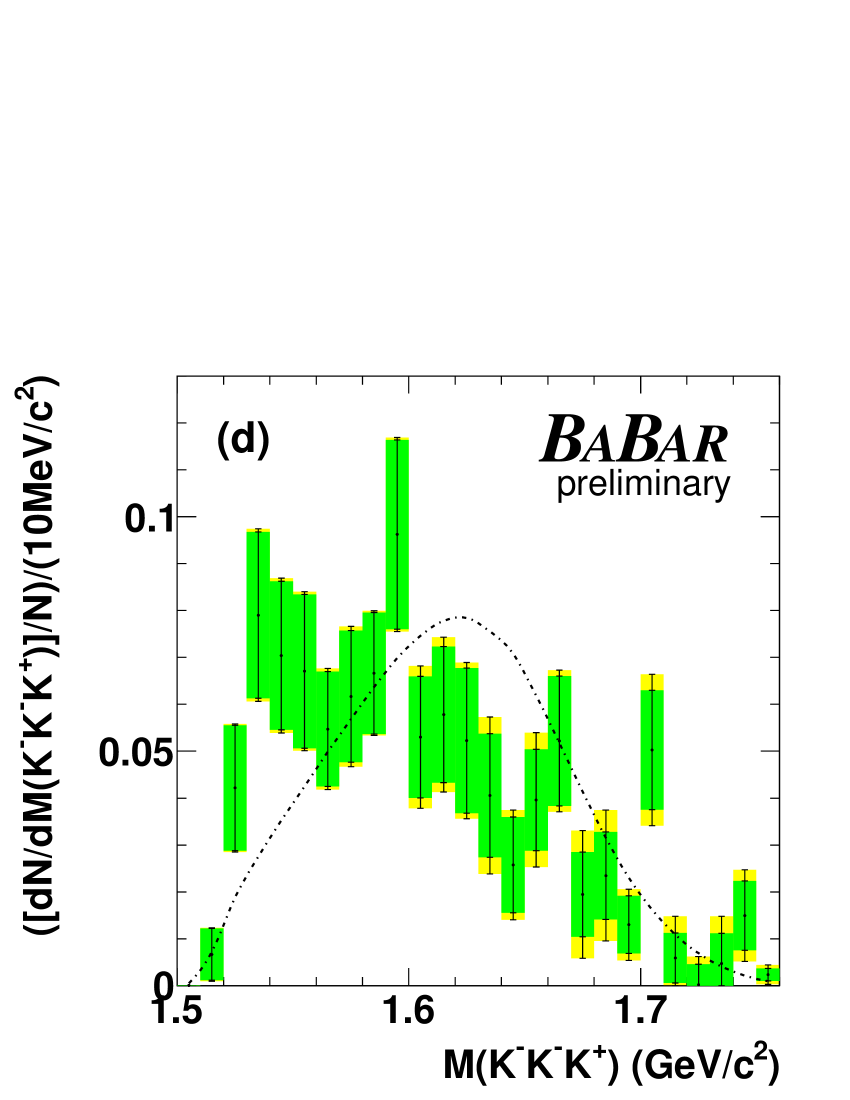
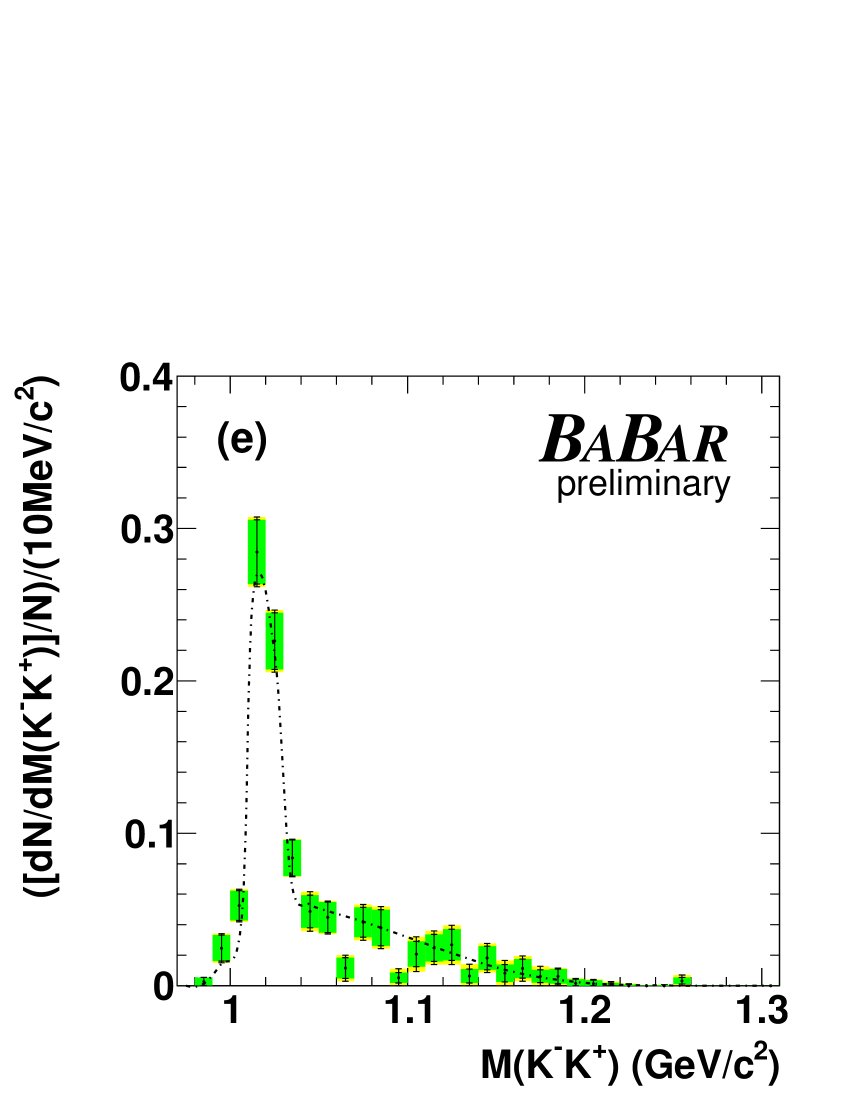
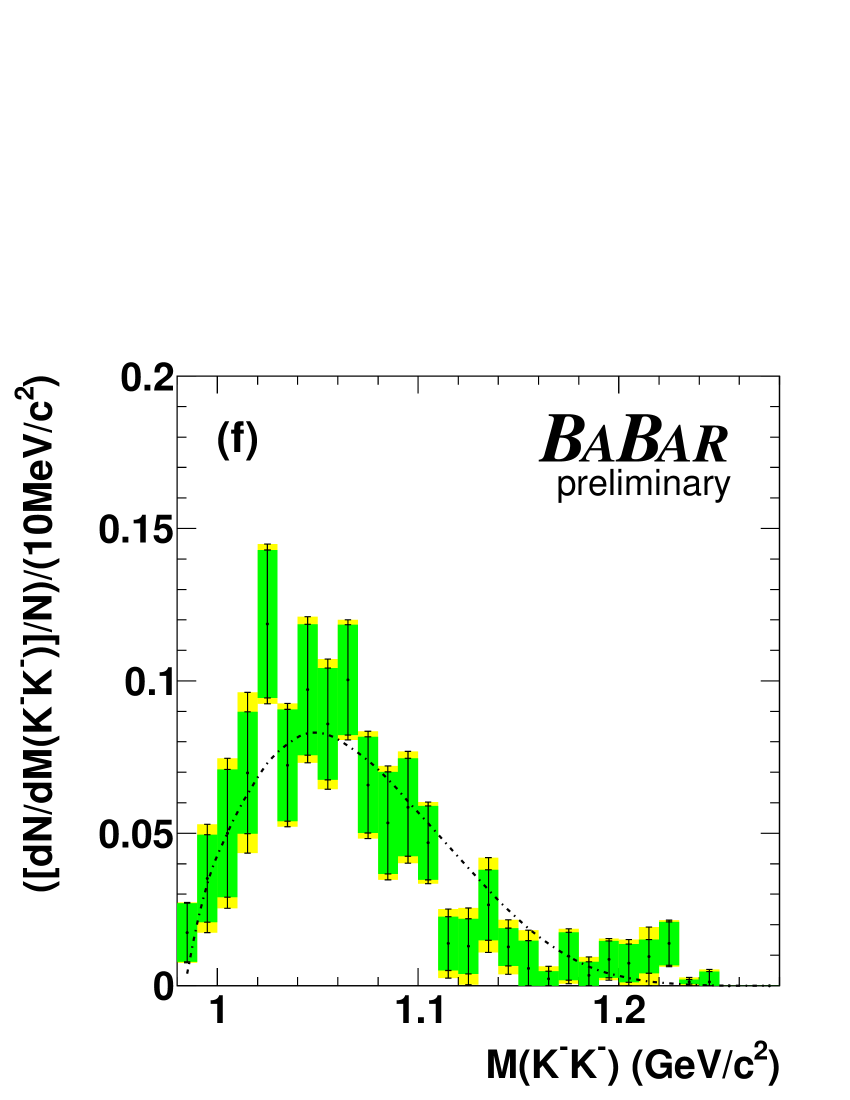
Figure 1: The reconstructed and unfolded invariant mass spectra for
the channels. The reconstructed invariant mass
distributions for (a)
, (b) and (c)
are
presented in the first row. In the second row, the (d)
, (e) and (f)
unfolded invariant mass spectra are shown.
For the reconstructed mass plots, the data is represented by the
points with the error bars representing the statistical
uncertainty. The blue (dark) histogram represents the non-
background MC, the green (medium dark) histogram represents the
backgrounds excluding the cross-feed which
are represented by the yellow (light) histogram. For the unfolded
mass plots,
the data is represented by the
points with the inner error bars (green) representing the statistical
uncertainty and the outer error bars (yellow)
representing the statistical and systematic uncertainties added in
quadrature. The integral of the unfolded distribution has been
normalized to 1. The black dashed line is the generator level MC
distribution used in the BABAR simulation. The red dotted line is
the
CLEO tune for Tauola 2.8 [6].
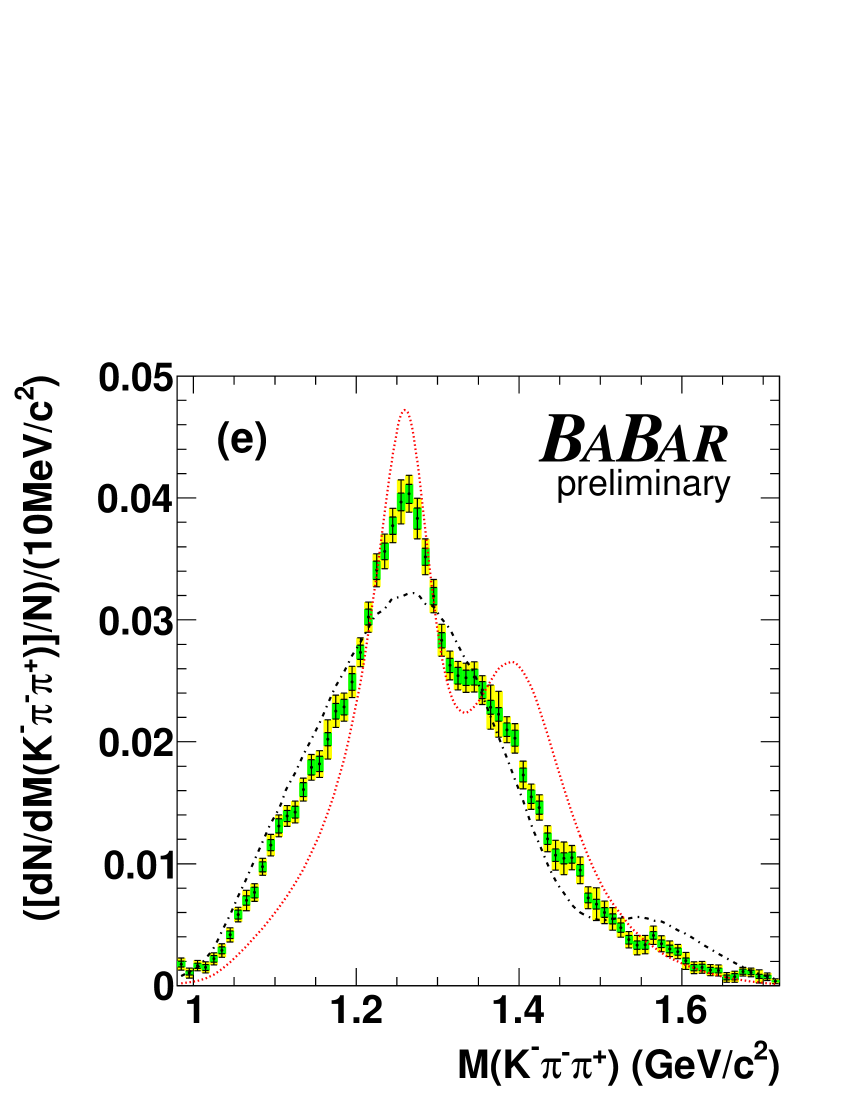
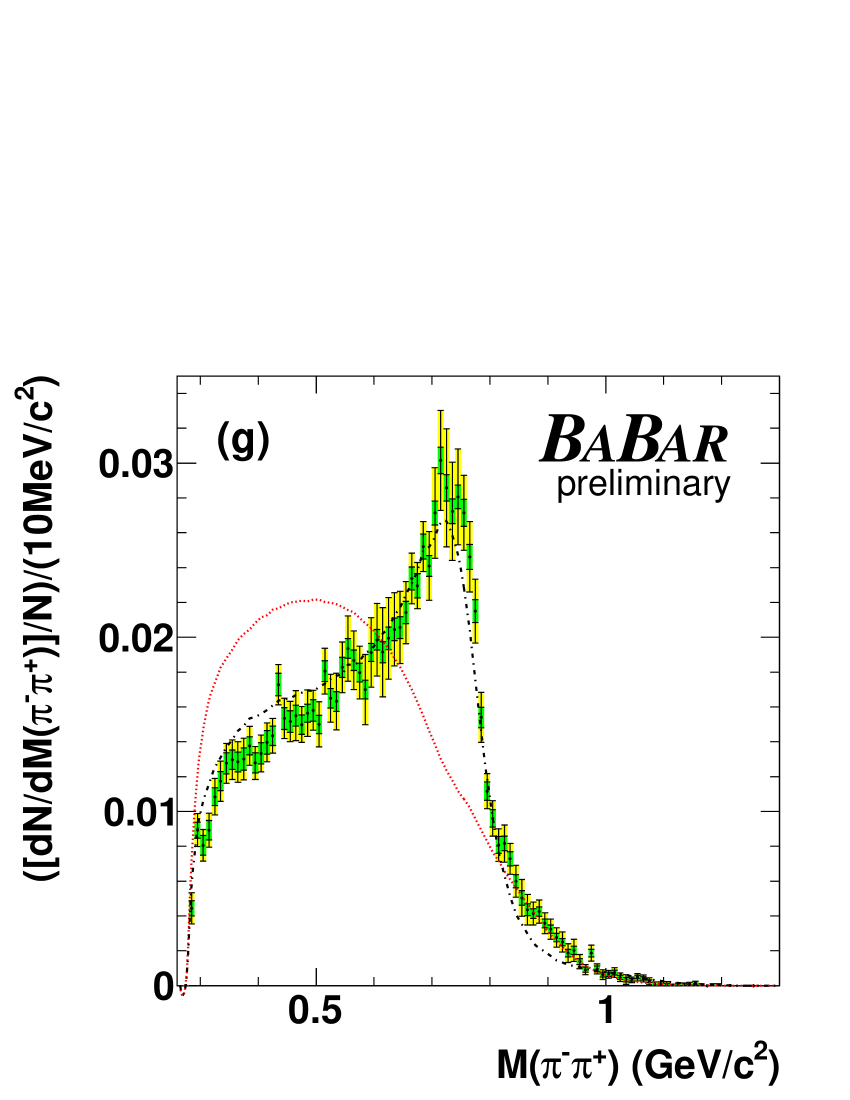
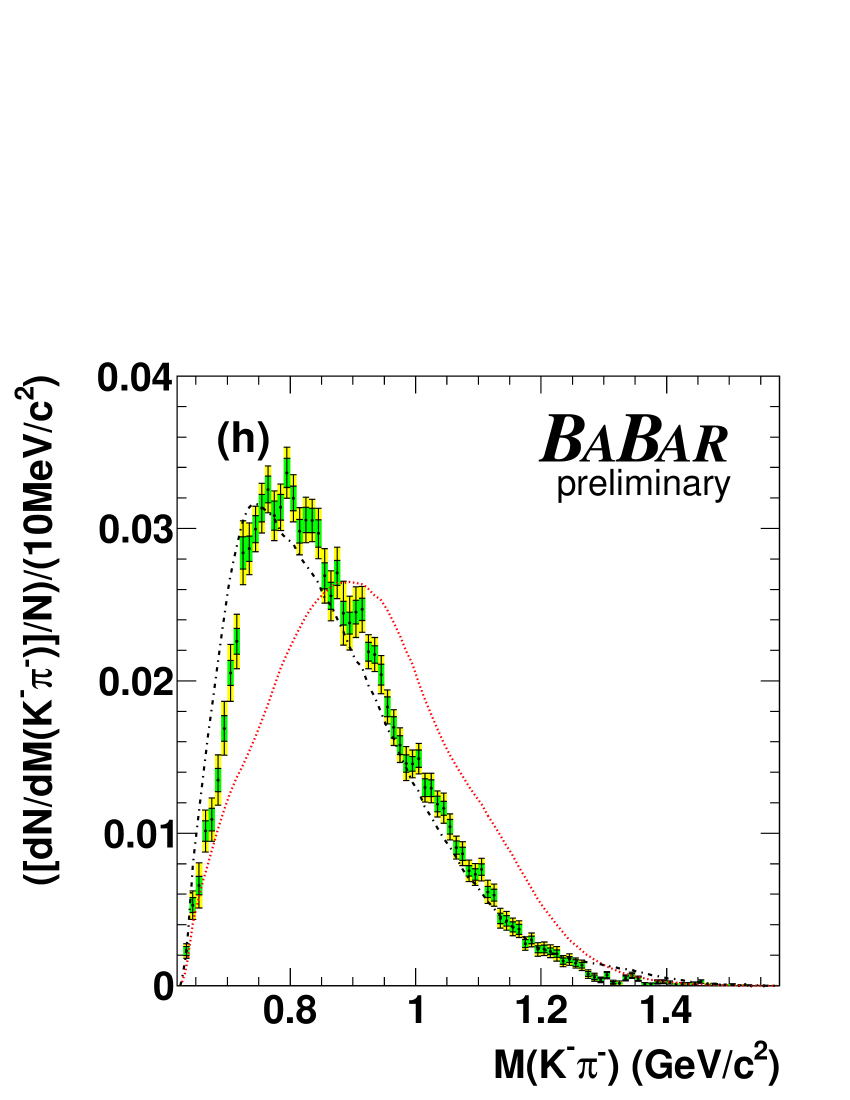
Figure 2: The reconstructed and unfolded invariant mass spectra for
the channels. The reconstructed invariant mass
distributions for (a)
, (b) , (c)
and (d) are
presented in the first row. In the second row, the (e)
, (f) , (g)
and (h) unfolded invariant mass
spectra are shown.
For the reconstructed mass plots, the data is represented by the
points with the error bars representing the statistical
uncertainty. The blue (dark) histogram represents the non-
background MC, the green (medium dark) histogram represents the
backgrounds excluding the cross-feed which
are represented by the yellow (light) histogram. For the unfolded
mass plots,
the data is represented by the
points with the inner error bars (green) representing the statistical
uncertainty and the outer error bars (yellow)
representing the statistical and systematic uncertainties added in
quadrature. The integral of the unfolded distribution has been
normalized to 1. The black dashed line is the generator level MC
distribution used in the BABAR simulation. The red dotted line is
the
CLEO tune for Tauola 2.8 [6].
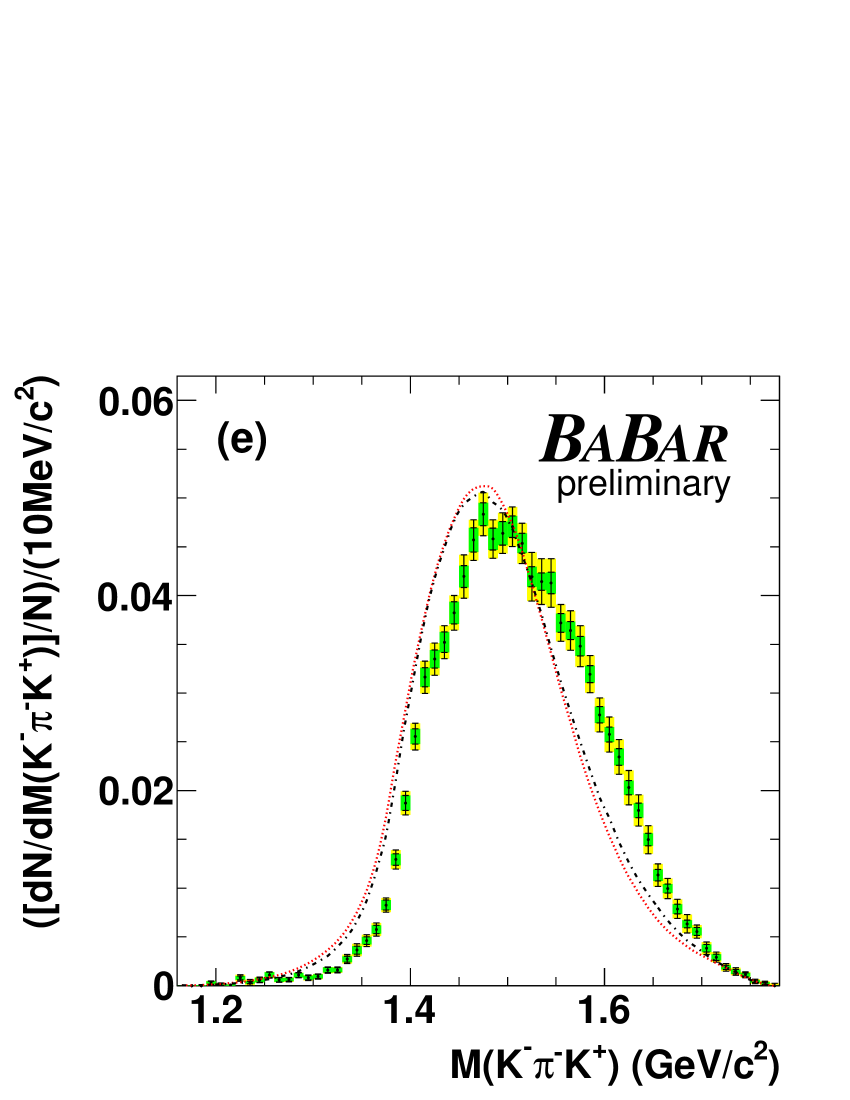
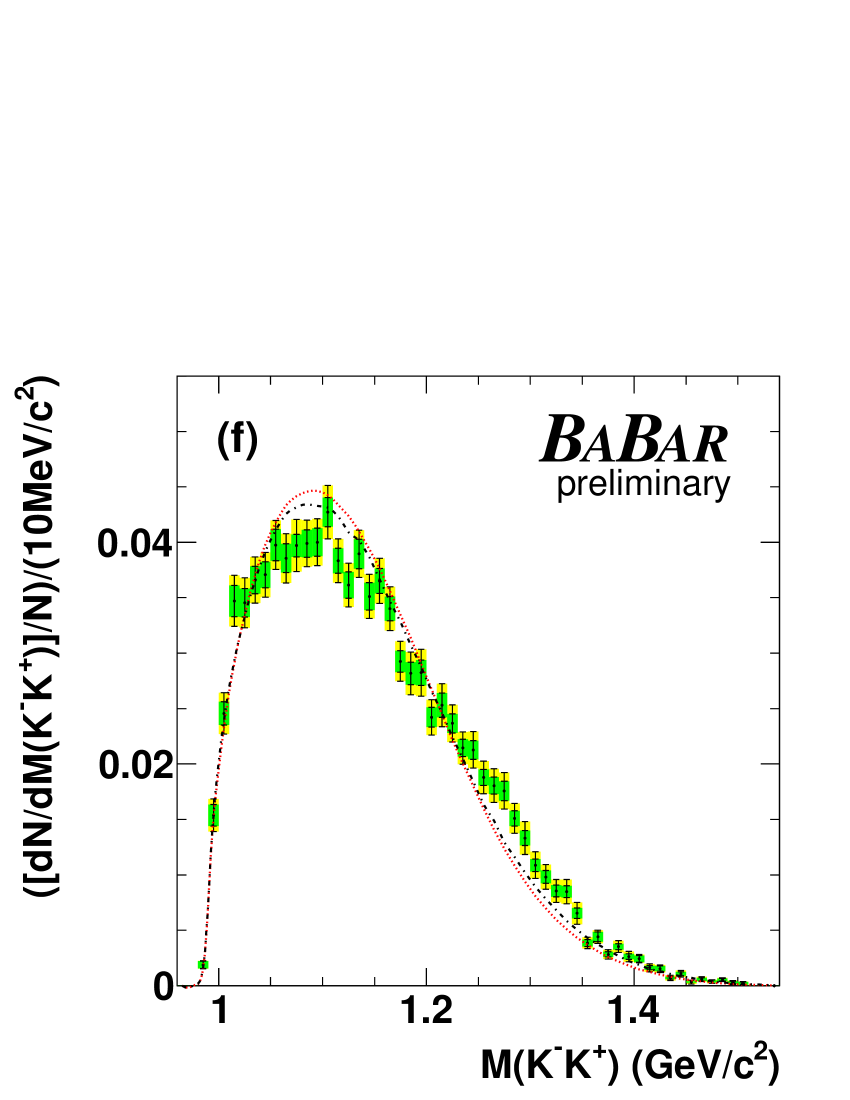
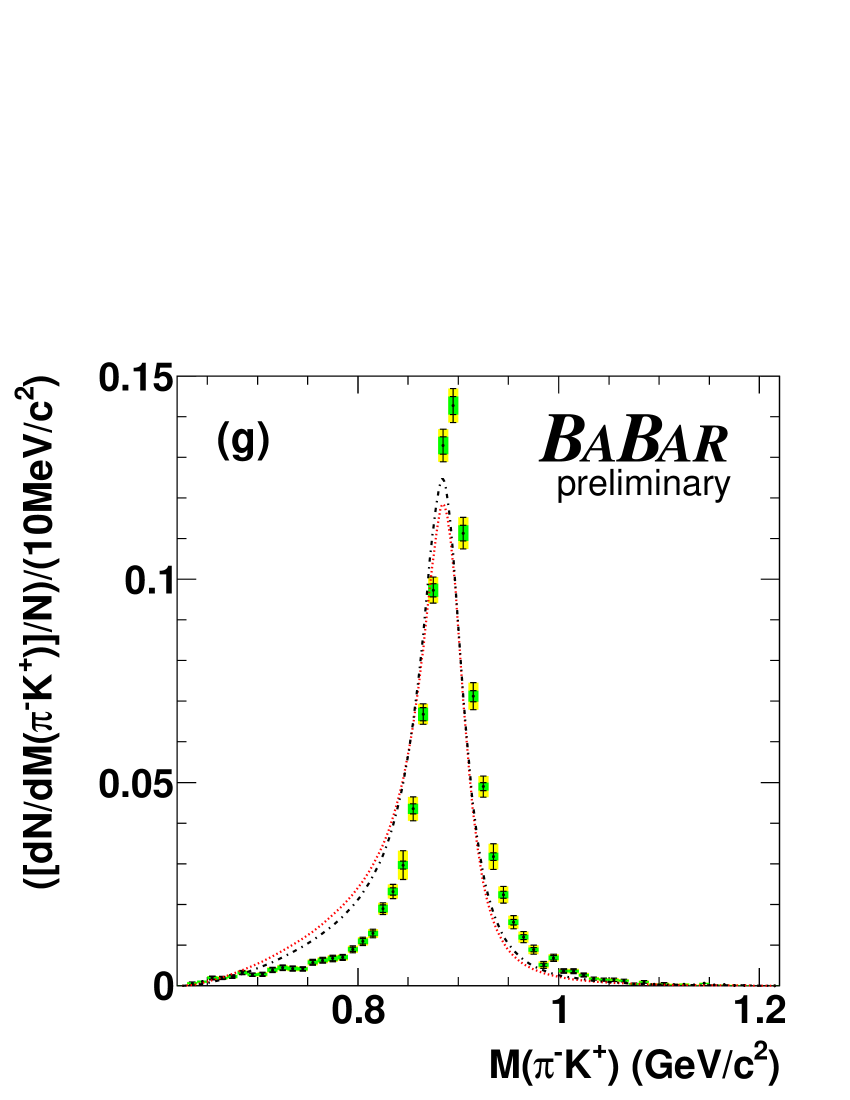
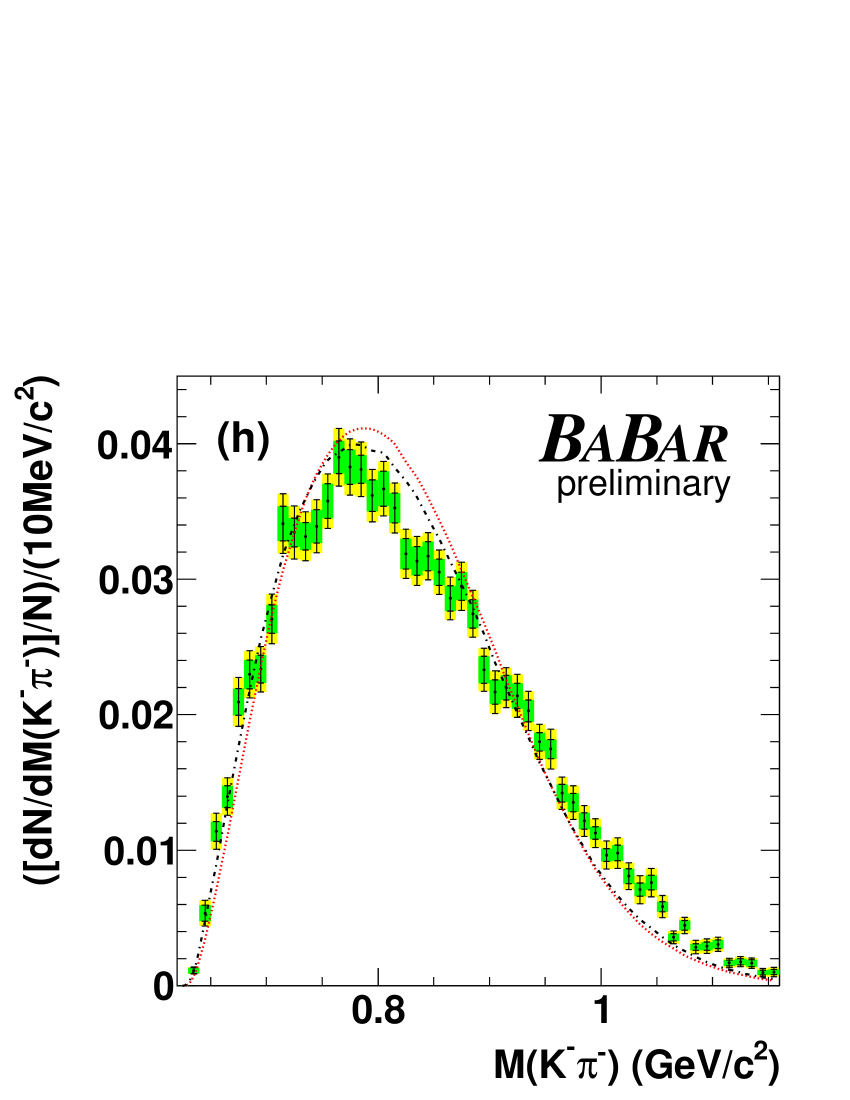
Figure 3: The reconstructed and unfolded invariant mass spectra for
the channels. The reconstructed invariant mass
distributions for (a)
, (b) , (c)
and (d) are
presented in the first row. In the second row, the (e)
, (f) , (g)
and (h) unfolded invariant mass
spectra are shown.
For the reconstructed mass plots, the data is represented by the
points with the error bars representing the statistical
uncertainty. The blue (dark) histogram represents the non-
background MC, the green (medium dark) histogram represents the
backgrounds excluding the cross-feed which
are represented by the yellow (light) histogram. For the unfolded
mass plots,
the data is represented by the
points with the inner error bars (green) representing the statistical
uncertainty and the outer error bars (yellow)
representing the statistical and systematic uncertainties added in
quadrature. The integral of the unfolded distribution has been
normalized to 1. The black dashed line is the generator level MC
distribution used in the BABAR simulation. The red dotted line is
the
CLEO tune for Tauola 2.8 [6].
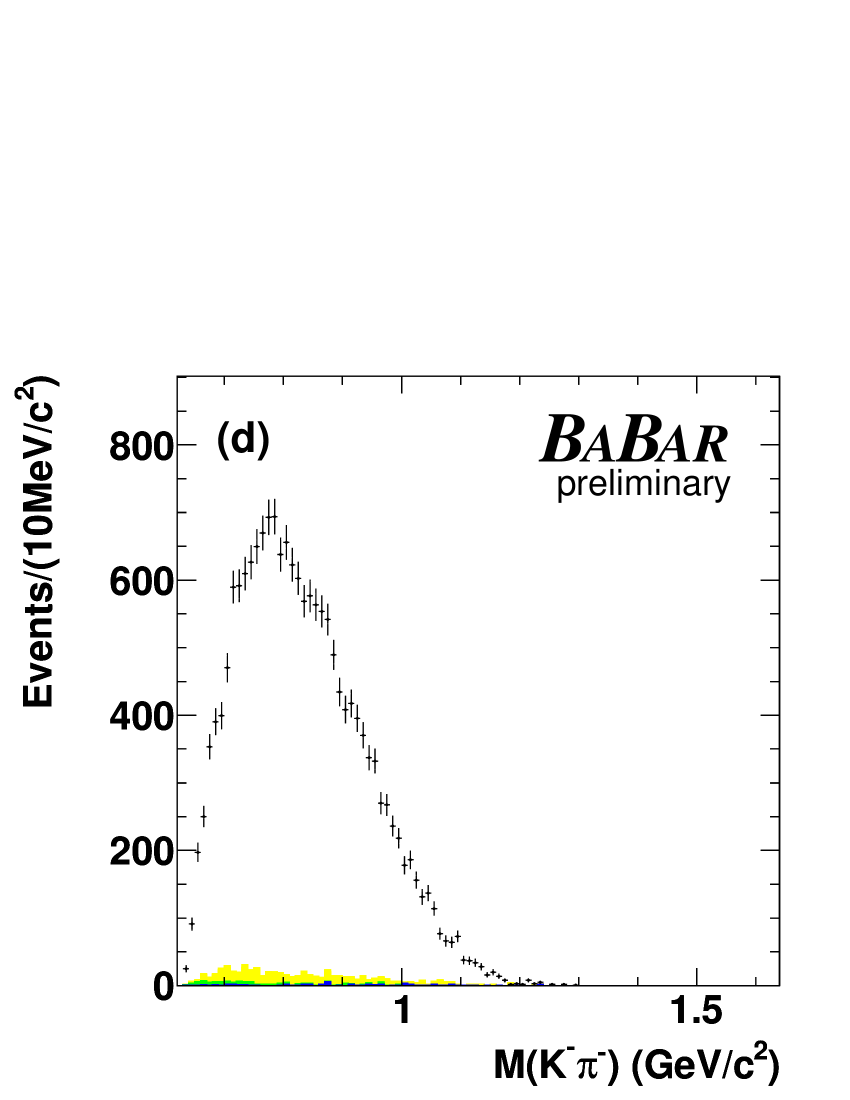
Figure 4: The reconstructed and unfolded invariant mass spectra for
the channels. The reconstructed invariant mass
distributions for (a)
, (b) and (c)
are
presented in the first row. In the second row, the (d)
, (e) and (f)
unfolded invariant mass spectra are shown.
For the reconstructed mass plots, the data is represented by the
points with the error bars representing the statistical
uncertainty. The blue (dark) histogram represents the non-
background MC, the green (medium dark) histogram represents the
backgrounds excluding the cross-feed which
are represented by the yellow (light) histogram. For the unfolded
mass plots,
the data is represented by the
points with the inner error bars (green) representing the statistical
uncertainty and the outer error bars (yellow)
representing the statistical and systematic uncertainties added in
quadrature. The integral of the unfolded distribution has been
normalized to 1. The black dashed line is the generator level MC
distribution used in the BABAR simulation which assumes that
decays entirely through .
5 Discussion and Conclusion
In this paper, we have presented unfolded invariant mass spectra using
Baysian unfolding for the decay modes , , and .
Additional studies have been conducted that confirm the BABAR branching
fraction measurement [4] using control samples to
cross-check all the main backgrounds. The and are
also used to validate that the mis-identification rates are
consistent within the assigned systematic uncertainties.
These invariant mass distribtuions are essential for determining the strange and
non-strange spectral density function and for the extraction of
. Work is ongoing with T. Przedzinski, P. Roig,
O. Shekhovtsova, Z. Was to improve the modeling of these decay modes
for the LHC and for the next
generation B-Factories using this data.
6 Acknowledgements
We are grateful for the
extraordinary contributions of our PEP-II colleagues in
achieving the excellent luminosity and machine conditions
that have made this work possible.
The success of this project also relies critically on the
expertise and dedication of the computing organizations that
support BABAR.
The collaborating institutions wish to thank
SLAC for its support and the kind hospitality extended to them.
This work is supported by the
US Department of Energy
and National Science Foundation, the
Natural Sciences and Engineering Research Council (Canada),
the Commissariat à l’Energie Atomique and
Institut National de Physique Nucléaire et de Physique des Particules
(France), the
Bundesministerium für Bildung und Forschung and
Deutsche Forschungsgemeinschaft
(Germany), the
Istituto Nazionale di Fisica Nucleare (Italy),
the Foundation for Fundamental Research on Matter (The Netherlands),
the Research Council of Norway, the
Ministry of Education and Science of the Russian Federation,
Ministerio de Ciencia e Innovación (Spain), and the
Science and Technology Facilities Council (United Kingdom).
Individuals have received support from
the Marie-Curie IEF program (European Union) and the A. P. Sloan Foundation (USA).
Additional support for I. M. Nugent was provided by the Alexander von Humboldt
Foundation.
References
[1]
N. Cabibbo, Unitary Symmetry and Leptonic Decays, Phys. Rev. Lett. 10 (1963)
531–533.
doi:10.1103/PhysRevLett.10.531.
[4]
B. Aubert, et al., Exclusive branching fraction measurements of semileptonic
tau decays into three charged hadrons, and
, Phys. Rev. Lett. 100 (2008) 011801.
arXiv:0707.2981,
doi:10.1103/PhysRevLett.100.011801.
[5]
G. D’Agostini, A Multidimensional unfolding method based on Bayes’ theorem,
Nucl. Instrum. Meth. A362 (1995) 487–498.
doi:10.1016/0168-9002(95)00274-X.
[6]
P. Golonka, B. Kersevan, T. Pierzchala, E. Richter-Was, Z. Was, et al., The
Tauola photos F environment for the TAUOLA and PHOTOS packages: Release. 2.,
Comput.Phys.Commun. 174 (2006) 818–835.
arXiv:hep-ph/0312240, doi:10.1016/j.cpc.2005.12.018.