The Star Cluster System in the Nearby Starburst Galaxy M82
Abstract
We present a photometric study of star clusters in the nearby starburst galaxy M82 based on the UBVI, YJ and H band Hubble Space Telescope images. We find 1105 star clusters with mag. 1070 of them are located in the disk region, while 35 star clusters are in the halo region. The star clusters in the disk are composed of a dominant blue population with a color peak at , and a weaker red population. The luminosity function of the disk clusters shows a power-law distribution with a power law index , and the scale height of their distribution is ( pc), similar to that of the stellar thin disk of M82. We have derived the ages of 630 star clusters using the spectral energy distribution fit method by comparing UBVI(YJ)H band photometric data with the simple stellar population models. The age distribution of the disk clusters shows that the most dominant cluster population has ages ranging from 100 Myr to 1 Gyr, with a peak at about 500 Myr. This suggests that M82 has undergone a disk-wide star formation about 500 Myr ago, probably through the interaction with M81. The brightest star clusters in the nuclear region are much brighter than those in other regions, indicating that more massive star clusters are formed in the denser environments. On the other hand, the colors of the halo clusters are similar to those of globular clusters in the Milky Way Galaxy, and their ages are estimated to be older than 1 Gyr. These are probably genuine old globular clusters in M82.
1 Introduction
Nearby starburst galaxies have been of great importance in terms that they provide a detailed view of the starburst process in galaxies. Especially, thanks to the high spatial resolution images obtained with the Hubble Space Telescope (HST), it became possible to study the properties of the star clusters and to use them for investigating the star formation history in these galaxies. There are numerous studies of young star clusters in starburst or star-forming galaxies (e.g. Whitmore et al. 1999; Larsen 2002; Scheepmaker et al. 2007; Park et al. 2009; Hwang & Lee 2008; Cantiello et al. 2009; Hwang & Lee 2010; Pellerin et al. 2010; Whitmore et al. 2010; Chandar et al. 2010; Larsen et al. 2011). It is found that young star clusters in these galaxies show a power law luminosity function () with similar power index values () (Bastian, Covey, & Meyer, 2010; Hwang & Lee, 2008), and that some of them are more massive () than normal young clusters () so that they are called super star clusters (SSCs).
Existence of an old halo in these galaxies also has been known. Several studies investigated old star clusters in star-forming or starburst galaxies. A significant population of old star clusters is found even in late-type galaxies with high star formation rate (e.g. Chandar et al. 2004). Hwang & Lee (2008) found several tens of old globular cluster candidates in an interacting and highly star-forming spiral galaxy M51, and estimated its globular cluster specific frequency to be as low as , which is even lower than that of the Milky Way (). Whitmore et al. (2010) reported the presence of some old clusters in the Antennae galaxy with high star formation activity.
M82 is one of the nearest starburst galaxies, and its star formation rate is as high as M⊙ yr-1 (O’Connell & Mangano, 1978; Bell & Kennicutt, 2001), one of the highest values in the nearby universe (see Mayya & Carrasco (2009) for an extensive review). M82 has been known as Irr II or Amorphous for long. However discovery of a bar and spiral arms in the near-infrared (NIR) images led it to be classified as SBc (Telesco et al., 1991; Mayya, Carrasco, & Luna, 2005). It has a dynamical mass of (Greco, Martini, & Thompson, 2012). This galaxy belongs to the M81 Group and it is embedded in a huge neutral hydrogen cloud connecting all major member galaxies (Yun, Ho, & Lo, 1994; Chynoweth et al., 2008). The observation of group-wide neutral hydrogen structure provided a strong evidence that the interaction between M81 and M82 might have induced the starburst phenomenon in M82 (Rieke et al., 1980; Yun, Ho, & Lo, 1994; Yun, 1999; Förster Schreiber, Genzel, Lutz, & Sternberg, 2003).
There have been many studies on the star clusters in M82 since O’Connell & Mangano (1978) reported the existence of several knots and semi-stellar objects in the central region of M82. Some of them were classified as SSCs based on their high luminosity () (O’Connell et al., 1995). Later Melo et al. (2005) detected 197 SSCs with in the nuclear region of M82 using the data taken with /Wide Field Planetary Camera 2 (WFPC2), and concluded that most nuclear star clusters in M82 are young (age Myr) and compact ( pc). Barker, de Grijs, & Cerviño (2008) reported an enhanced star cluster formation at about Myr ago in the inner few hundred parsecs of M82 based on the age distribution of about 150 star clusters.
Other than the central or nuclear region, a post-starburst region B has been a target of many studies. de Grijs, O’Connell, & Gallagher (2001) detected 113 star clusters in the region B using the data taken with /WFPC2 and Near Infrared Camera and Multi-Object Spectrometer (NICMOS) and concluded that the last tidal encounter between M81 and M82 occurred at about 600 Myr ago based on the age distribution of the star clusters. Later de Grijs, Bastian, & Lamers (2003) revisited the same data set and argued that the encounter epoch is about 1 Gyr ago. However, Smith et al. (2007) found 35 star clusters in the region B using the image data obtained with /Advanced Camera for Surveys (ACS) and concluded that M81 and M82 might have encountered at about 150 Myr ago based on the ages of the detected star clusters. This result is supported by Konstantopoulos et al. (2008) who showed that the spectroscopic ages of seven star clusters in the region B are in agreement with those reported in Smith et al. (2007).
A study of the star clusters over the entire disk of M82 was given by Mayya et al. (2008) who found 653 star clusters in the disk of M82 using the image data obtained with /ACS. However, they assumed two fixed values for the ages of star clusters, 8 Myr and 100 Myr, instead of deriving their ages, to study cluster mass distributions. Therefore, it is still needed to make a comprehensive study on the age distribution of star clusters over the entire disk of M82 to investigate its star cluster formation history. Since numerous previous studies on the same issue have led to various conclusions regarding the epochs of the encounter between M81 and M82, a study on the ages of the star clusters in the entire M82 disk, not restricted to some specific regions, will be of great merit.
Another important issue is to find old halo clusters in M82 and to investigate their properties. To date only a few old globular clusters were reported from a couple of spectroscopic observations of limited number of candidates (Konstantopoulos et al., 2009; Saito et al., 2005) so that little is known about the old population in M82. Because of its proximity, M82 is an ideal target to search for old halo populations, if any. M82 is a very useful galaxy for understanding the existence and properties of old stellar populations in starburst galaxies.
In this study, we present a survey of the star clusters in M82 using high resolution optical and near-infrared ( to ) images taken with /ACS Wide Field Channel (WFC) and /Wide Field Camera 3 (WFC3), covering not only the disk but also some halo area in M82. The addition of and band data improves the capability to deal with the reddening and to reduce the age estimation uncertainty for star clusters. This paper is organized as follows: The methods of data reduction and analysis are described in Section 2. §3 presents the main results. Implication of these results are discussed in §4, and the primary results are summarized in §5.
We adopt a distance to M82, 3.55 Mpc () determined from the measurement of the -band magnitude of the tip of the red giant branch (TRGB) magnitude (Lee et al., 2013). The distance to M82 is similar to that to M81, Mpc () (Durrell, Sarajedini, & Rupali, 2010; Gerke et al., 2011). At this distance, one arcsecond (arcmin) corresponds to 17 pc (1.02 kpc) in physical scale. The foreground reddening toward M82 is and the corresponding extinctions are , , , , , and (Schlegel, Finkbeiner, & Davis, 1998). The total magnitudes, colors, and position angle of M82 are , , and 65 degrees (de Vaucouleurs et al., 1991). At the adopted distance (without the internal extinction correction), the absolute magnitudes are and . The inclination angle of M82 is degrees in the V band (Lynds & Sandage, 1963), and degrees in the and band (Ichikawa et al., 1995), and degrees in the images (Mayya, Carrasco, & Luna, 2005), respectively. We adopt degrees for analysis in this study. We use the center position of M82 from NASA/IPAC Extragalactic Database based on the Jordell–VLA Astrometric Survey (JVAS) and Cosmic Lens All-Sky Survey (CLASS).
2 Data Reduction & Analysis
2.1 Data
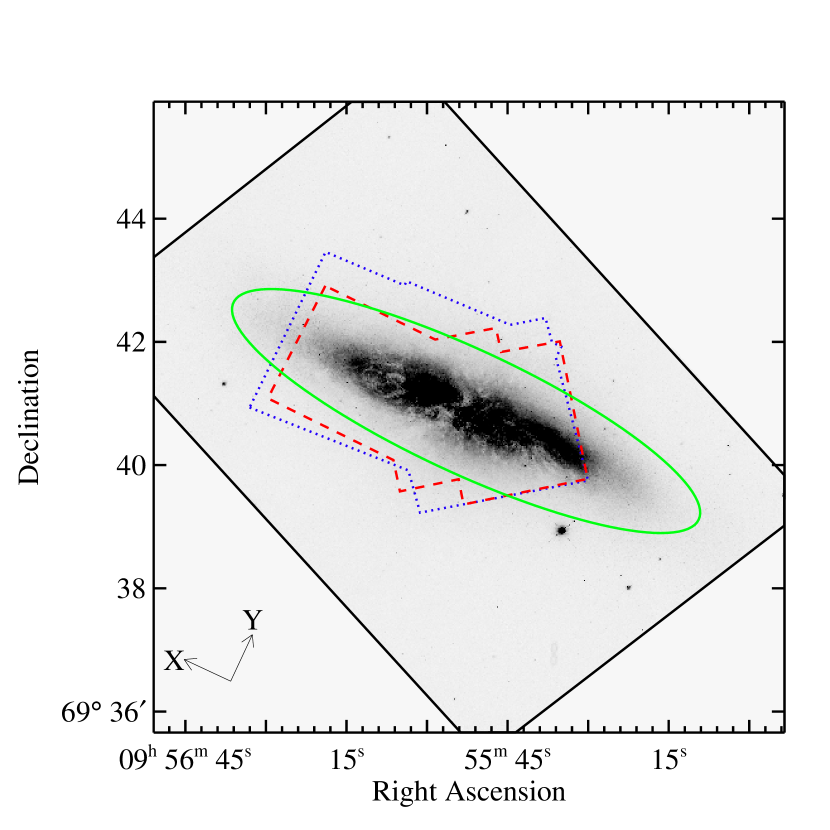
Table 1 lists a summary of the data used in this study. We used the image data obtained by the Hubble Heritage Team using the /ACS in , , and filter bands (called , , and hereafter) (proposal ID 10776, PI: M. Mountain). In each filter band, six exposures were taken in a 32 mosaic configuration with the accumulated exposure times of 1600, 1360, and 1360 seconds, respectively. The final field coverage is about centered on M82, covering the optical disk of M82. All the necessary data reduction processes were done by the Hubble Heritage Team, including the ACS image data reduction with the standard ACS pipeline (CALACS) and the image combination with MultiDrizzle task. More detailed information on the observation and data reduction is given in Mutchler et al. (2007). The full width at half maximum (FWHM) of a point source in the -band image is about 0.1 arcsec.
We also used the ultraviolet (UV) and near-infrared (NIR) image data taken with /WFC3 (Proposal ID 11360, PI: R. O’Connell) that partially covered the M82 disk in (), (YJ), and () bands. The full width at half maximum (FWHM) of a point source in NIR images is about 0.25 arcsec. All the image data provided from the archive are processed through the ‘on-the-fly’ calibration based on the best reference frames available. We have combined three exposures for and two exposures for YJ and H using SWARP (Bertin et al., 2002) to make a mosaic image in each filter band. The final mosaic images cover about . See Figure 1 for the areal coverage of each band.
2.2 Source Detection and Photometry
Since M82 is an almost edge-on disk galaxy, it is very challenging to detect sources in the disk and central region of the galaxy. We combined the , , and band images, and applied a ring median filtering method (with filter radii and pixels) with RMEDIAN task in IRAF to the combined image to generate a map of smoothly varying background brightness. Then we subtracted it from the original combined image, obtaining a master detection image. This method improves the detection efficiency for the sources in the disk. A similar method was adopted by Hwang & Lee (2008) successfully to detect the star clusters buried in the spiral arms of M51. We used Source Extractor (Bertin & Arnouts, 1996) on the master detection image to detect sources with a threshold of 3 and a minimum contiguous detected area of five pixels.
We used PHOT task in IRAF/DAOPHOT package to derive photometry in
, YJ, and
band images at the coordinates of detected sources. A single aperture with fixed
size of was adopted in all bands for the derivation of consistent
colors. The aperture size was determined based on the FWHM of point sources in the
NIR WFC3 image data with FWHM, which provides the poorest resolution in our data set.
The photometric zero points for /ACS and WFC3 in Vega magnitude system are
adopted from the STScI websites
(http://www.stsci.edu/hst/acs/analysis/zeropoints/tablestart,
and http://www.stsci.edu/hst/wfc3/photzplbn, respectively).
The aperture magnitude requires correction for the lost light fraction due to the finite size of an aperture. The aperture correction for point sources is determined based on the instrumental characteristics of the . However, for extended sources, the aperture correction also depends on their light profile characteristics and sizes. Therefore, we use an aperture correction method for extended sources with a circular shape, as adopted by Hwang & Lee (2008), based on the correlation between the slope of light profiles and the calculated value for the aperture correction. This correlation is obtained by calculating the slope of the aperture magnitude profiles between pixels () and pixels () for well-isolated and extended sources with circular shapes. The aperture correction values are calculated by difference between aperture magnitudes with pixels () and pixels (). There is a good correlation between the slope and the aperture correction value (Magslope, rms). To avoid over correction, we restrict the maximum correction value as 1.5 mag that is the largest aperture correction value of well-isolated sources. These aperture correction values are estimated only on the -band image to derive the -band total magnitudes of the star clusters.
2.3 Star Cluster Selection
Since selecting star clusters in nearby galaxies is a challenging process even with the high resolution images, various methods have been used for the images of nearby galaxies. Scheepmaker et al. (2007) selected star clusters in M51 based on the source sizes. They measured the size of the sources using ISHAPE (Larsen, 1999), and selected star cluster candidates with effective radii pc. Then they manually inspected the candidates for final selection. Mayya et al. (2008) selected star clusters in M82 using the parameters provided by Source Extractor. They checked FWHM, isophotal area, ellipticity, and magnitude of the detected sources to select star cluster candidates. They also finalized the star cluster candidates through visual inspection. Hwang & Lee (2008) selected star clusters in M51 using a combination of automatic screening and visual inspection. They used the FWHM and ellipticity information of the sources to define the cluster candidates. Star clusters were selected by inspecting radial profiles and 2D contours of the candidates. Both the automatic method and the visual inspection method are successful in cluster finding. However, the automated methods have difficulties in finding the clusters located in the varying background. It needs additional visual check. Star clusters in M82 are often located in the bright and crowded background (especially in the disk), so that visual inspection is an indispensable step to find star clusters in M82. Therefore we use a combination of automatic screening and visual inspection to search for star clusters in M82 in this study. First we made a list of about 14000 candidates for visual inspection, selecting the sources with FWHM pix and mag (after aperture correction). Then we visually checked the images, radial profiles, and isophote contour maps of the sources. Finally we selected 1105 star clusters, satisfying the following criteria: (1) round appearances, (2) extended radial profiles, and (3) lack of smooth extended structures.
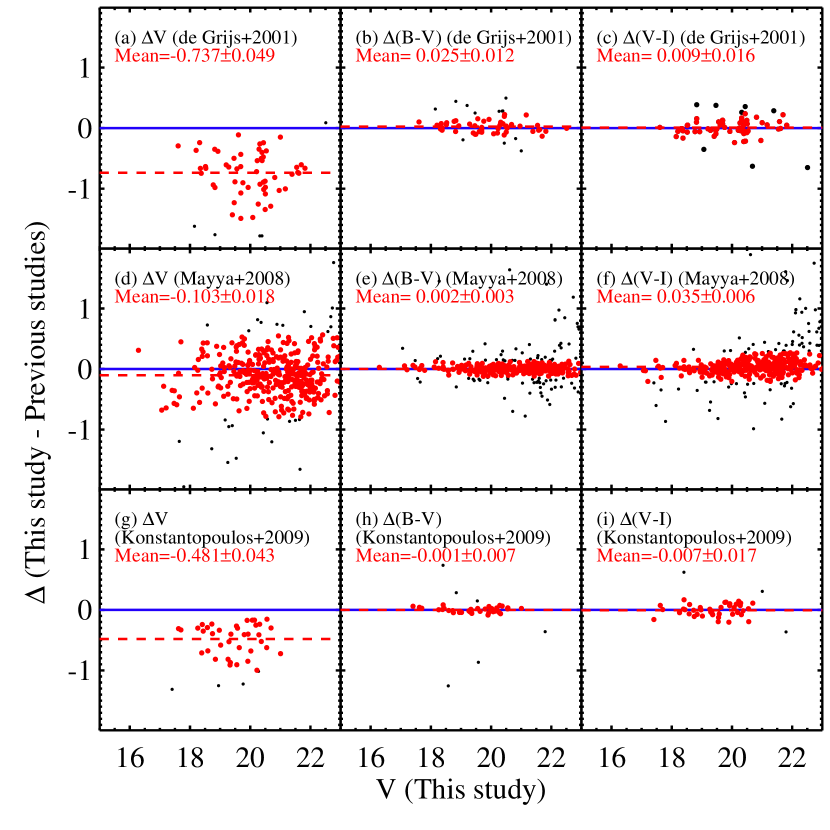
We compared our photometry of the M82 star clusters with those in previous studies (de Grijs, Bastian, & Lamers, 2003; Mayya et al., 2008; Konstantopoulos et al., 2009), as shown in Figure. 2. The colors in these four studies show a very good agreement. magnitudes in this study show an approximate agreement with those in Mayya et al. (2008), but are systematically brighter than those in other studies (de Grijs, Bastian, & Lamers, 2003; Konstantopoulos et al., 2009). This is due to the fact that the magnitudes in this study and Mayya et al. (2008) provide total magnitudes for star clusters, while the other studies provide magnitudes for the fixed apertures. The mean differences derived with 2 sigma clipping are , , and for de Grijs, Bastian, & Lamers (2003) minus this study, , , and for Mayya et al. (2008) minus this study, and , , and for Konstantopoulos et al. (2009) minus this study. Mayya et al. (2008) adopted the isophotal magnitudes provided by Source Extractor, which are similar to the total magnitudes.
2.4 Size Estimation of the Star Clusters
To measure the size of star clusters, we used ISHAPE that was designed to estimate the size of slightly extended sources in images (Larsen, 1999). It assumes that the image of a source can be modeled as convolution of a point spread function (PSF) and analytic functions for an extended source. We made a PSF image using DAOPHOT/SEEPSF task in IRAF for selected bright isolated stars. We adopted a MOFFAT15 model for analytic function. ISHAPE provides FWHMs of the sources, and we converted them to effective radii by multiplying 1.13, according to the guide of the ISHAPE manual.
2.5 Estimation of Age, Extinction, and Mass of the Star Clusters
We have estimated ages, extinctions, and masses of the star clusters in M82 by comparing the photometric data with the model spectral energy distributions (SEDs). Model SEDs are derived from the simple stellar population (SSP) synthesis models by Bruzual & Charlot (2003). The models span ages from 1 Myr to 15 Gyr for metallicity range of Z. We assume a Salpeter initial mass function (IMF) of (Salpeter, 1955) with a lower mass limit with 0.1 and an upper mass limit with 100 . We adopted a solar metallicity for the star clusters in the disk based on the abundance of HII regions in M82 (Smith et al., 2006). Note that using a Salpeter IMF could overestimate the cluster mass by a factor of 1.70–3.46 although relative mass distribution of star clusters is not changed (de Grijs, Bastian, & Lamers, 2003). We adopted the Salpeter IMF, because most of the previous studies adopted the same IMF and because we wanted to compare our results with them. We checked the effect of adopting the Chabrier IMF in comparison with the Salpeter IMF for SSP models in the color-color diagram. The colors of the SSP models with these two IMFs are almost same for log , and they change by 0.1 for log . Therefore our results are affected little by adopting different IMFs.
SED fitting based on broad band photometry is known to have some limits, but is still very useful for estimating ages of star clusters. Anders et al. (2004) showed that at least four band data are needed to obtain reliable age estimation with an SED fit method. Especially, and bands are important for age estimation of young star clusters, because those bands cover the Balmer jump that is a sensitive age indicator. Maíz Apellániz (2009) also suggested that the combination of , optical, and NIR band data is useful to determine the ages of star clusters when the extinction of each cluster is unknown. M82 is almost edge-on, and most star clusters in the disk suffer from significant extinction. We utilize six photometric bands for age and extinction estimation of the star clusters in the disk region. About 870 star cluster candidates in the central region of M82 were covered in six bands. However, only images are available for about 200 star clusters, which are located mostly in the outer region of M82.
The estimated ages of the clusters are not affected by the cluster size estimation, because the cluster colors were derived from the fixed aperture photometry. It is also noted that the estimated masses of the clusters do not depend on the cluster size estimation, because they were derived from the -band total magnitudes.
3 Results
3.1 A Catalog of the Star Clusters in M82
In Table 2 we list a catalog of 1105 star cluster candidates (hereafter star clusters) with mag. Brief descriptions on the data columns of the catalog are given as follows: Column 1 lists an identification number of a star cluster; Columns 2 and 3 list J2000.0 right ascension (RA) and declination (Dec) in degrees; Columns 4 lists aperture corrected -band magnitudes and corresponding errors; Columns from 5 to 9 list (), (), (), (), and () colors and corresponding errors for an aperture radius ; and Column 10 and 11 list effective radii and ages, respectively.
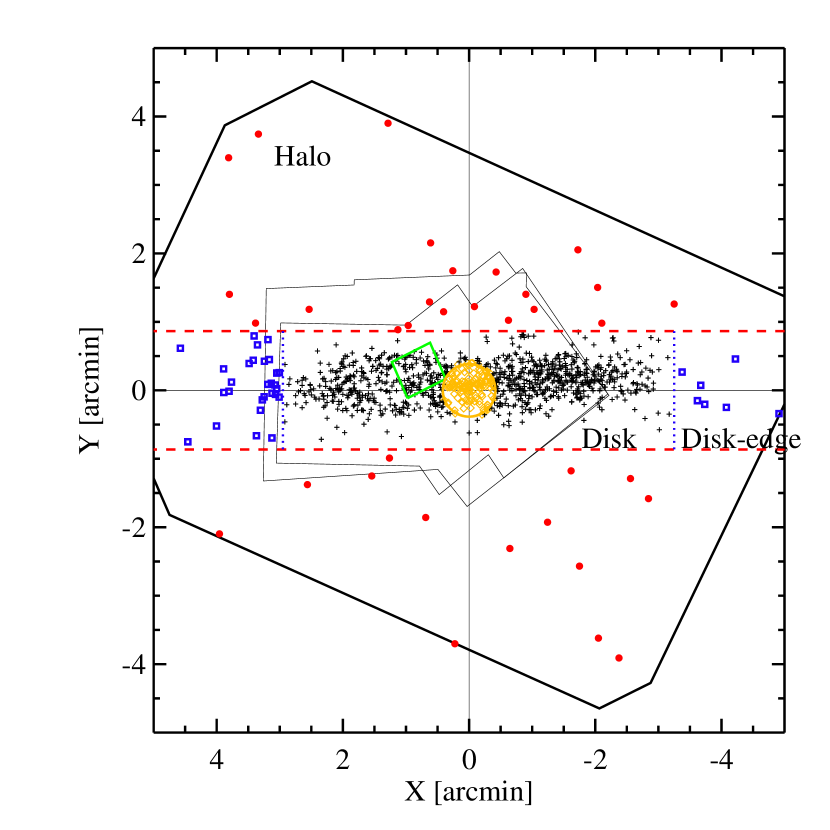
3.2 Spatial Distribution of the Star Clusters
Figure 3 displays the spatial distribution of the star clusters in M82. We defined the and coordinates, which are projected distances along the major and minor axes, respectively. and increase towards the northeast and the northwest, respectively, and are given by PAPA and PAPA where , , and are the central coordinates of M82, and PA is the position angle for the major axis.
Several features are noted in this figure. First, the most distinguishable feature is an elongated structure, showing that most star clusters are distributed on the disk: they are mostly located within from the major axis and from the minor axis. The distribution of the disk star clusters appears to show a discontinuity at along the major axis, indicating the disk star cluster populations may include two kinds. So we divided the disk area into two: the disk region (, ) and the disk-edge region (, ), as marked in Figure 3. Second, there are a small number of star clusters scattered far from the disk. These are probably old globular clusters belonging to the halo of M82. Third, in the nuclear region that is known to have a recent starburst, we find 132 star clusters inside the circular area with a radius (425 pc). Mayya et al. (2008) found 260 star clusters in the same region, including fainter clusters in -band images as well as clusters in very complex regions. Fourth, we find 80 star clusters in a (595 pc 680 pc) field centered on the region B, a famous post-starburst region. We divide the entire field into four main regions for analysis: the main disk region, the nuclear region, the disk edge region, and the halo region as marked in Figure 3. Additionally, we select a sub region which is called region B for comparison with previous studies. This region is included in the disk region.
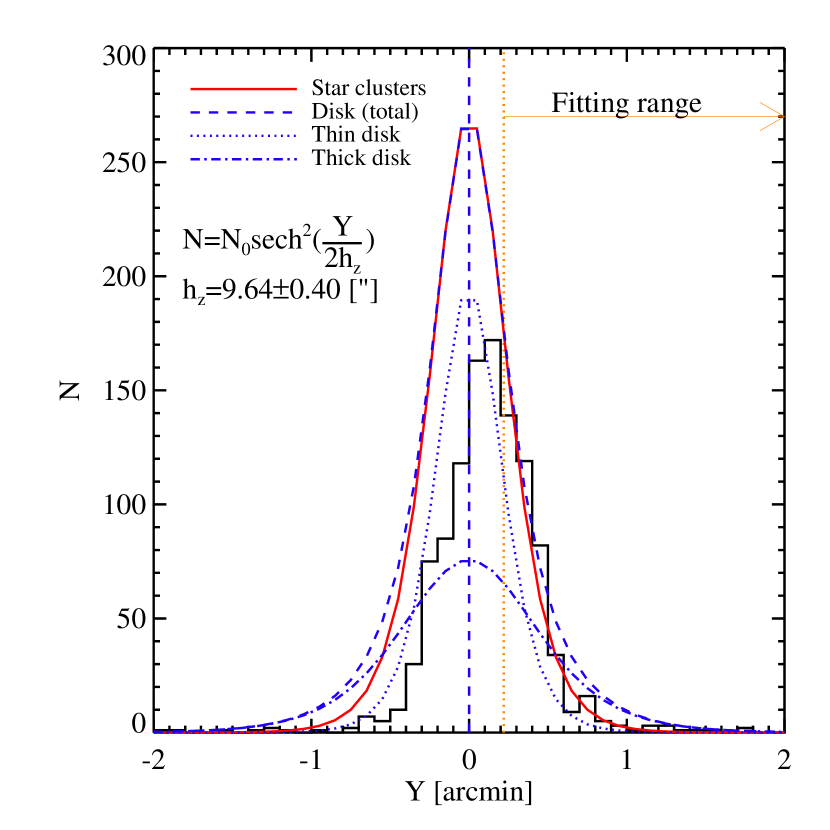
We derived a number density of star clusters as a function of distance from the major axis () to investigate the vertical structure of the star cluster system, as plotted in Figure 4. The number density distribution appears to have a Gaussian shape with asymmetry. The peak is shifted from the center to the northern-side (), and the number density of southern-side () is smaller than that of northern-side. This offset and asymmetry is considered to be due to the extinction and incompleteness of cluster detection. This shows that the star clusters in the southern-side suffer from more extinction than those in the northern-side, and that the southern-side () is closer to us than the northern-side.
We fit the data with a hyperbolic secant function, sech where is a scale height (de Grijs & van der Kruit, 1996), plotting the result by the solid line in the figure. The fitting is performed for the range of to avoid the incompleteness problem. The vertical distribution of the star clusters is fit very well by the hyperbolic secant function for . We also investigate the vertical structure of stellar populations using the band image. We sum counts with a range of along the X-axis to derive a stellar light distribution along the Y-axis. This distribution of stellar light shows asymmetry similar to that of star clusters. We estimated the scale height of the vertical distribution of stellar light by fitting with a double hyperbolic secant function (for thin and thick disks) for the range of . Derived scale heights of the thin and thick disks are (143 0.51 pc) and (294 0.85 pc), respectively. Thus the thick disk is twice thicker than the thin disk.
We derived a value for of the star cluster distribution, ( pc). This value is a little larger than that of the thin disk derived from stellar light, but this distribution includes the intermediate-age and old star clusters that are regarded as thick disk or halo populations. The genuine of the star clusters in the disk could be similar to that of stellar thin disk. It suggests that most star clusters are distributed similarly to stellar populations in the thin disk.
It is also noted that there are several star clusters at above the fit function. These clusters may be a separate population from the disk population. They are considered to belong to the halo of M82. We defined the halo region by (= = 882 pc) derived from the -band stellar luminosity profile for analysis, as marked in Figure 3.
3.3 Photometric Properties of Star Clusters
3.3.1 Color-Magnitude Diagrams and Color Distribution of the Star Clusters
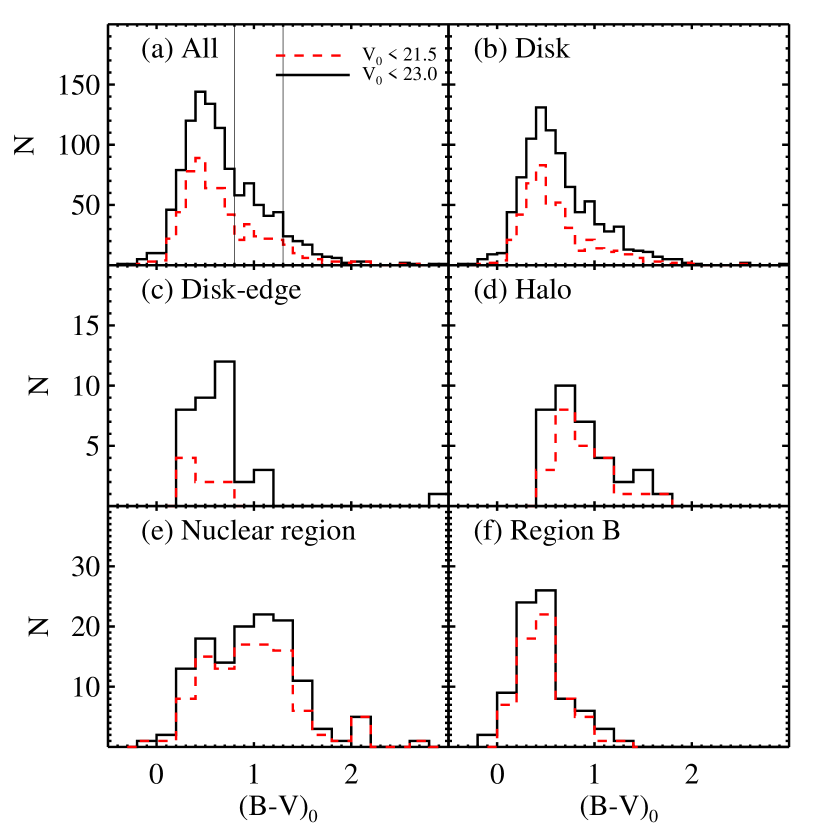
Figure 5 displays color-magnitude diagrams (CMDs) of the star clusters in M82, and Figure 6 shows corresponding color histograms (for all star clusters and only bright star clusters with mag): (a) the entire area, (b) the disk region, (c) the disk-edge region, (d) the halo region, (e) the nuclear region, and (f) the region B. Here magnitudes and colors represent the values dereddened according to the foreground reddening. Distinguishable features are as follows. First, the star clusters in M82 are dominated by the star clusters in the disk. They are composed of a dominant blue population with a color peak at , and a weaker redder population that are mostly redder than . We divide the cluster sample according to their color range: (blue clusters), (intermediate color clusters), and (red clusters) for further analyses. Second, the CMDs and color distributions vary depending on the region. Third, the star clusters in the disk-edge region and the region B are mostly blue. Fourth, the brightest star clusters in the disk-edge region, mag, are much fainter than those in other regions. Fifth, the star clusters in the nuclear region include a large number of brighter star clusters compared with other regions, and they show a large scatter in color, indicating a presence of high differential reddening. Finally, the star clusters in the halo region are mostly red with . These may be old globular clusters, showing the existence of an old halo in M82. A few of them have very red colors , indicating that some of them may be reddened star clusters or background galaxies.
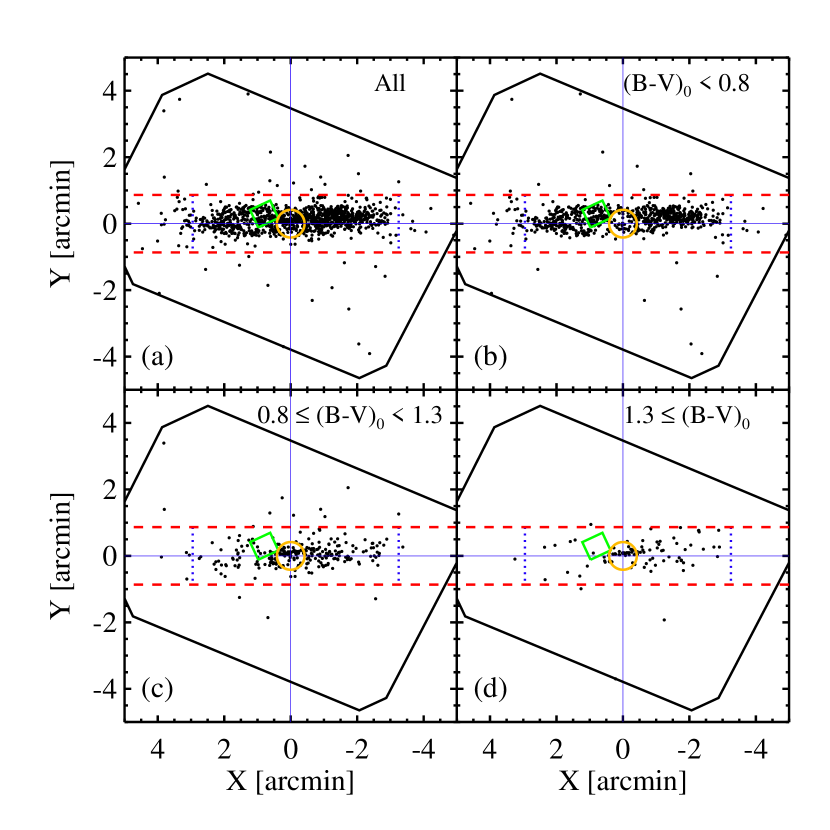
3.3.2 Spatial Distribution of the Star Clusters with Different Colors
The spatial distributions of the star clusters with different color ranges are shown in Figure 7. The blue star clusters () are mostly distributed in the disk, and several of them are found in the halo region. There are 69 and 48 blue star clusters in the region B and nuclear region, respectively. The intermediate-color clusters () are also found mostly in the disk region and a few are in the halo region. Interestingly the distribution in the left is much wider than that in the right. It could be a result due to inhomogeneous extinction. A more detailed description is given in Section 3.6. Ten and 52 intermediate-color clusters are found in the region B and nuclear region, respectively. The red star clusters () are mostly located in the disk, especially in the right side of the disk. Only one red cluster is found in the region B, while 32 red clusters are detected in the nuclear region. Interestingly the red clusters are located along a narrow linear structure. We checked the and band images, and found the existence of dust lanes in the nuclear region. These dust lanes obscure the star clusters in the nuclear region, and the star clusters in the edge of the dust lanes are only shown as a narrow linear structure. The star clusters in the region B are usually blue, while more than half of star clusters in the nuclear region are red. It could be caused by the different age of star clusters or differential reddening. The region B is regarded as a window with less extinction and the nuclear region is usually considered as a high extinction region, so that the red colors of most clusters in the nuclear region may be a result of internal reddening. The linear distribution of the red star clusters in the nuclear region implies that there is a narrow window in the nuclear region or the clusters are formed in such a location.
3.3.3 Color-Color Diagrams of the Star Clusters
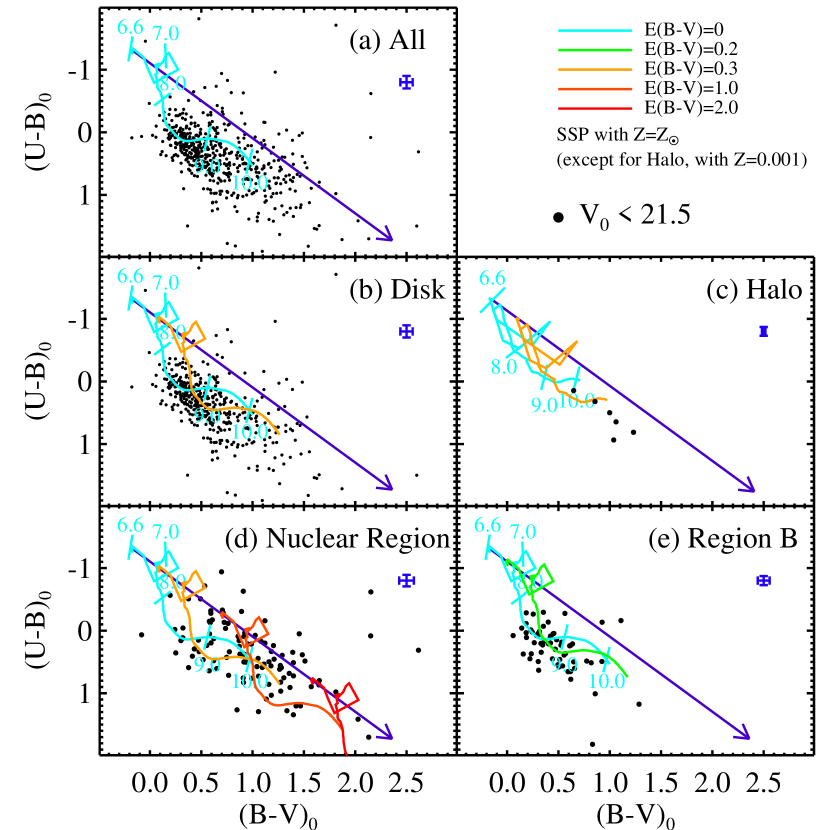
Figure 8 displays the color-color diagrams (CCDs) of the bright star clusters with mag in M82: (a) the entire area covered by images, (b) the disk region, (c) the halo region, (d) the nuclear region, and (e) the region B. Note that the halo region is partially covered by images so that only six objects are plotted. We also plotted the SSP models with solar metallicity from the Padova group (Marigo et al., 2008). Several features are noted in Figure 8. First, the disk star clusters are mostly in the region for and . Second, the halo star clusters are old (log(age)). Third, the star clusters in the nuclear region are mostly and . However, there are some clusters that are severely reddened ( or more). Fourth, the region B star clusters are mostly located in the region for and .
3.4 Luminosity Functions of the Star Clusters
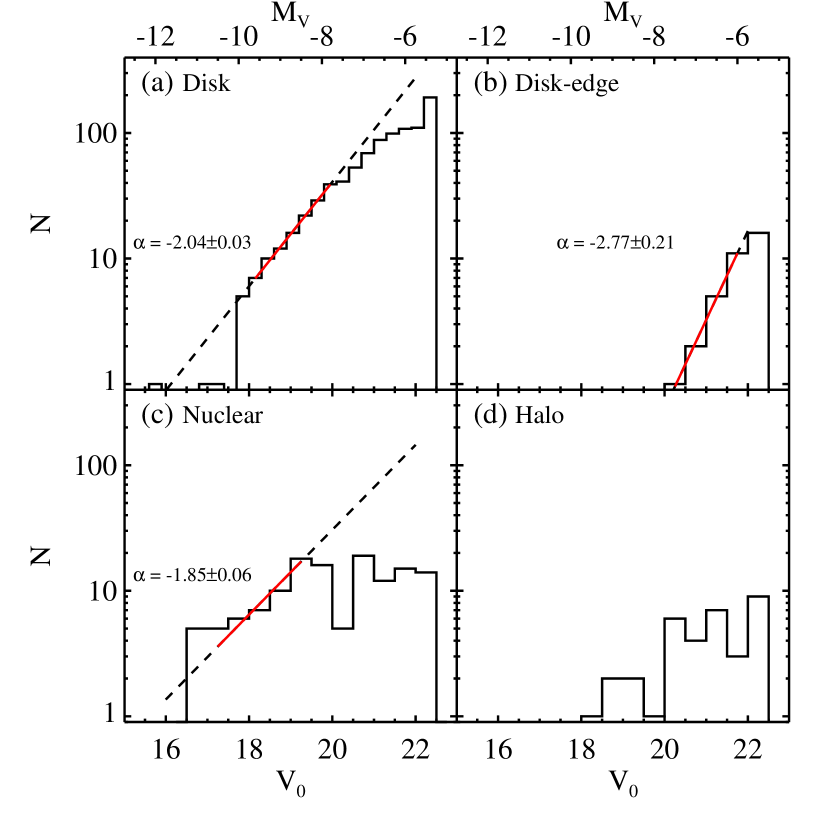
The luminosity function of the star clusters in M82 is shown in Figure 9. The luminosity function of the star clusters with in the disk is fit well by a power-law function, with . This value is similar to that of young star clusters in other late-type galaxies (e.g. Whitmore et al., 1999; Hwang & Lee, 2008; Santiago-Cortés, Mayya, & Rosa-González, 2010). Annibali et al. (2011) suggested that the slope of the luminosity function of the star clusters in the spiral galaxies becomes steeper when the luminosity of the fitting range is increased. The slope of the luminosity function for the star clusters in the disk region in M82 also follows this trend. The faint end in the luminosity function for the star clusters in the disk region becomes flatter at mag, which is a result due to incompleteness. This flattening is also seen in the luminosity function of M82 star clusters derived from the same data by Mayya et al. (2008).
The luminosity function of the star clusters with in the disk-edge region is also fit by a power-law function with , which is a little steeper than that of the star clusters in the disk region. The brightest star cluster in the disk-edge region is much fainter than those in other regions, as mentioned at Section 3.3.1. This result suggests two conflicting interpretations that the bright clusters could not be formed in this region or bright clusters were disrupted in this region. The former is more probable, considering that more massive clusters form in denser environments. The luminosity function of the star clusters in the nuclear region is fit by a power-law function with a shallower slope of . However, it is noted that there is an excess in the bright end of the luminosity function for the nuclear region. It suggests that the starburst phenomenon in the nuclear region could form very luminous star clusters, but we should deal carefully with this result because of extinction and incompleteness. The luminosity function of the star clusters in the halo region cannot be fit by a power-law function. It is noted that there are bright clusters with in the halo region that are not found in the disk-edge region, while the numbers of the star clusters in the halo and disk-edge regions are similar.
3.5 Size Distribution of the Star Clusters
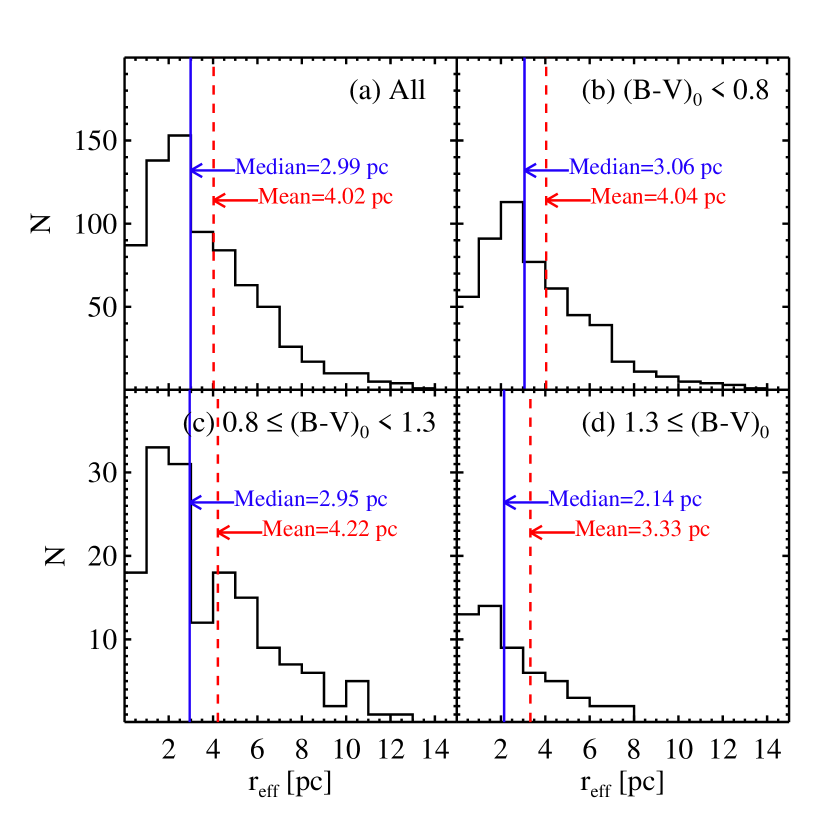
Figure 10 displays the distributions of effective radii of the star clusters in M82: (a) all, (b) the blue star clusters, (c) the intermediate-color star clusters, and (d) the red star clusters. The star clusters have sizes of pc, but mostly smaller than 8 pc. The size distribution shows a peak at pc, and it smoothly decreases as the star cluster size increases. The median and mean values of the star cluster sizes are 2.99 pc and 4.02 pc for all star clusters, 3.06 pc and 4.04 pc for the blue star clusters, 2.95 pc and 4.22 pc for the intermediate-color star clusters, and 2.14 pc and 3.33 pc for the red star clusters. The mean value of M82 star cluster sizes derived in this study is consistent with the peak value 3.8 pc given by Mayya et al. (2008). There are no significant differences of sizes between the blue and intermediate color star clusters (mean values are 4.04 pc and 4.22 pc, respectively). However, the sizes of the red clusters (a mean value of 3.33 pc) are a little smaller than the blue clusters (4.04 pc), but their standard deviations are too large () to insist the difference.
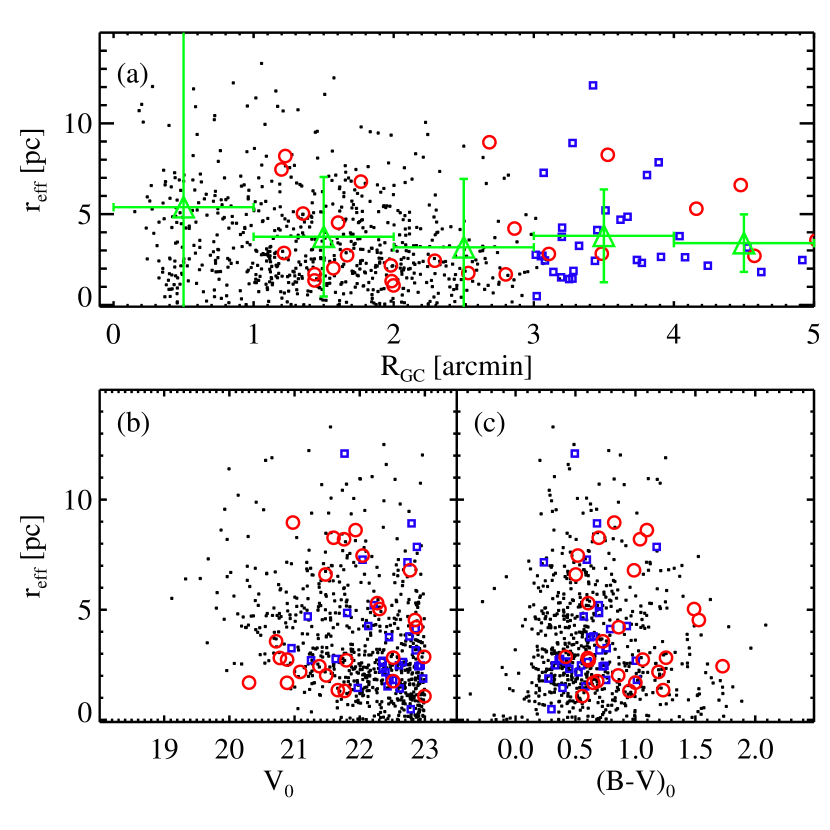
Figure 11(a) displays the sizes of the star clusters versus the galactocentric distance (). There is seen no significant trend of the sizes depending on . However it is noted that large star clusters with pc are found mostly in the inner region of the disk at . Figure 11(b) and (c) displays the sizes of the star clusters versus -band magnitudes and colors, respectively. Large star clusters with pc are mostly fainter than mag, while small star clusters with pc have a wide range of magnitudes. The color of the star clusters does not show any significant dependence on the size of the star cluster.
The peak value for M82 star clusters, 2 pc, is similar to that of the star clusters in other galaxies: e.g., 2.27 pc for M51 (Hwang & Lee, 2008), pc for M83 (Bastian et al., 2012), and pc for M31 (Vansevičius et al., 2009). A relation between cluster radii and galactocentric distance is found for the star clusters of M51 and M83 (Scheepmaker et al., 2007; Hwang & Lee, 2008; Bastian et al., 2012). The star clusters in the outer region of those galaxies have larger sizes than those in the inner region of those galaxies. However, the star clusters in M82 do not follow this trend. We also checked the relation between the sizes and distances from the major axis, finding no significant trend.
3.6 Age, Extinction, and Mass of the Star Clusters
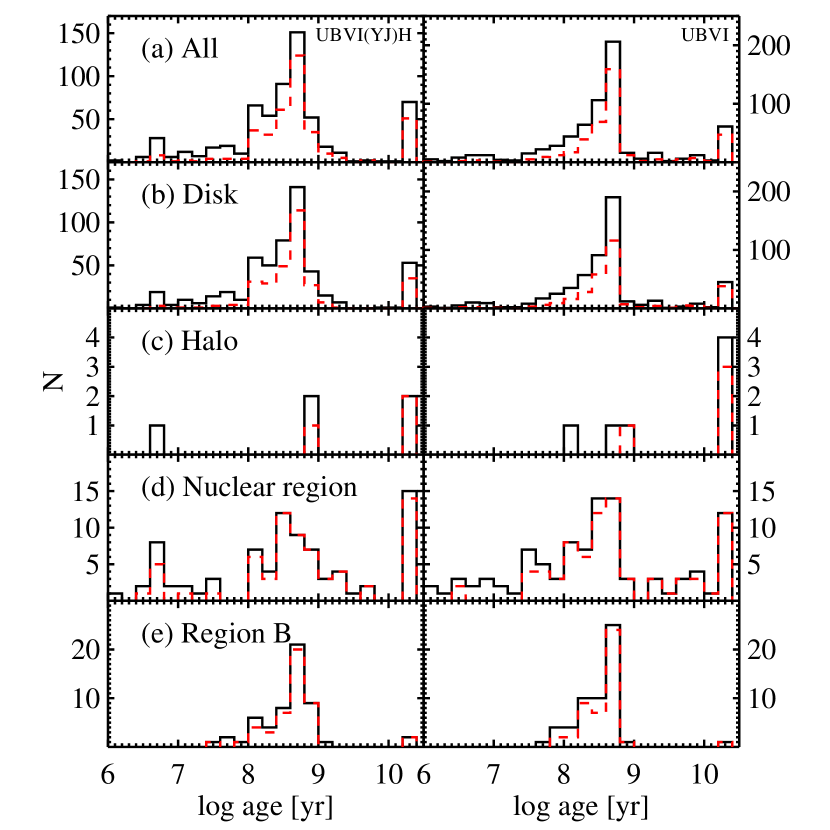
Figure 12 displays the age distribution of 630 star clusters in M82: (a) the entire region covered by the -band images, (b) the disk region, (c) the halo region, (d) the nuclear region, and (e) region B. The ages of the star clusters are derived from SED fitting with two filter combinations, (left panels) and (right panels). Several distinguishable features are noted in Figure 12(a). First, there is a dominant population of intermediate-age star clusters having ages from 100 Myr to 1 Gyr with a peak at Myr (). This is seen in both fit results and fit results. There appears to be a separate weaker peak at Myr (). This is better seen in the left panel than in the right panel. Second, there is a small number of young population with Myr. Third, there is a sizable population of old star clusters with Gyr.
Figure 12(b) to (e) show the variation of the age distribution of the star clusters depending on their positions. First, the age distribution of the disk star clusters is similar to that for all star clusters because the entire cluster system in M82 is dominated by the disk clusters. Second, the number of the halo star clusters with age estimates is small, but they are mostly older than 1 Gyr. Third, the star clusters in the nuclear region show three populations: a major intermediate-age population with a peak value at Myr (), a relatively small number of very young population with Myr as well as old population with Gyr. Fourth, the star clusters in the region B are mostly intermediate-age clusters.
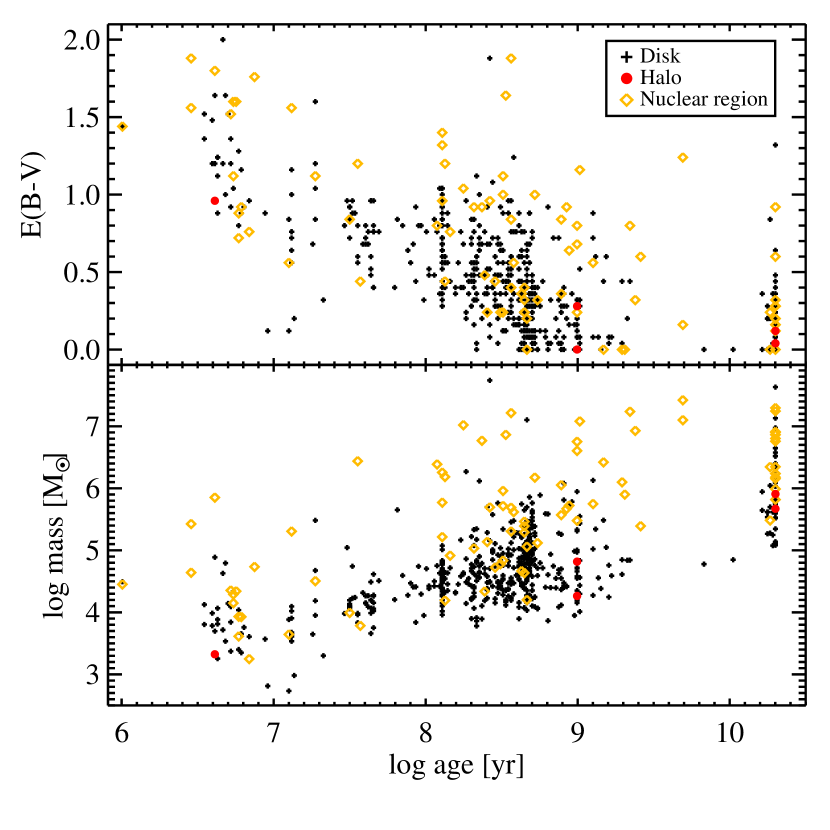
Figure 13 displays and masses versus ages of the star clusters in the halo, disk, and nuclear regions. values of the star clusters in the halo region are mostly small with . values of the star cluster in the disk and nuclear regions are mostly distributed in the range of . The reddening value appears to increase as cluster ages decrease. In particular, for the young star clusters in the disk and nuclear regions with age Myr the reddening values are . This indicates that young star clusters are usually located in dusty area suffering from high extinction, or that ages of these clusters might be under-estimated due to overestimation of extinction.
The masses of the star clusters in M82 have a range with , but mostly . The lower boundary of the cluster masses is defined by the survey limit of this study. Most massive star clusters with are located in the nuclear region. Several clusters with have very high masses with , but it should be treated with caution because over estimation of the extinctions could lead to high mass. Young star clusters with ages Myr have mostly low mass . Old star clusters are mostly massive with .
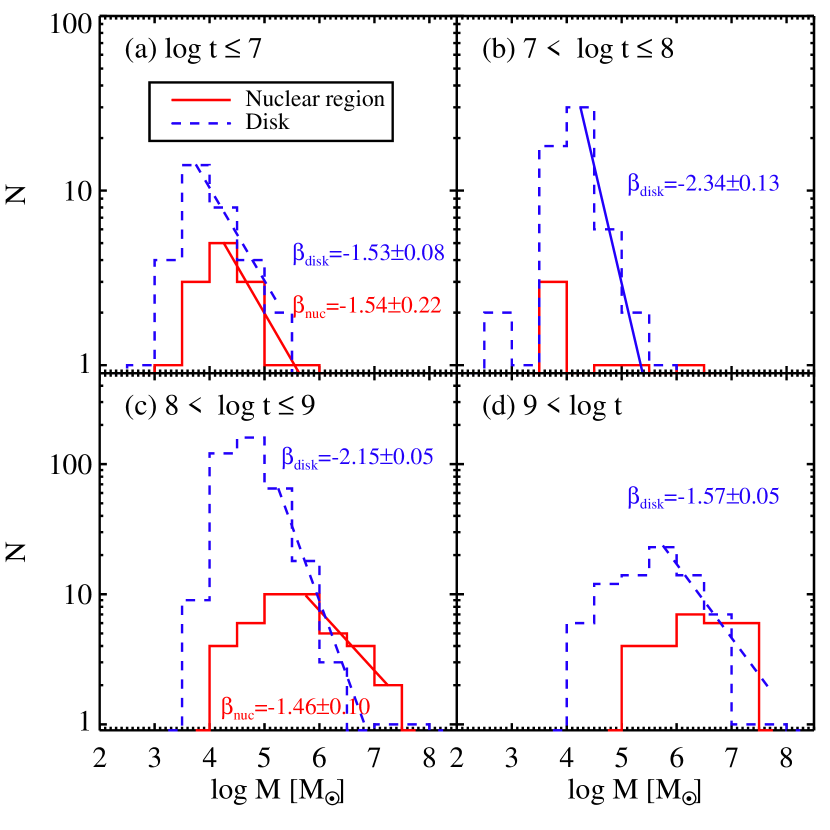
Figure 14 displays the mass functions of the star clusters in the disk and nuclear region with different ages. There are several noticeable features as follows. (1) Upper parts of the mass functions of the young star clusters with in the disk and nuclear region mostly follow power-law functions (). (2) The mass of the youngest star clusters with in both the disk and nuclear regions have similar slopes of power-law functions with and (fitting ranges of for the star clusters in the disk region and for the star clusters in the nuclear region). (3) The mass functions of the intermediate-age star clusters with in both regions have significantly different slopes of power-law functions. (4) The mass functions of the old star clusters in the disk do not follow a power-law function.
It is known that the mass function of the young star clusters in most disk galaxies follows a power-law functions with (e.g. for M51 young star clusters (), with (Hwang & Lee, 2010); and for the young star clusters in Antennae galaxies (), with (Whitmore et al., 2010), but the mass functions of the youngest star clusters in M82 have a shallower slope with . It may be understood as a shallower initial cluster mass function (ICMF) of starburst galaxies, but the number of the young star clusters is too small to interpret this result as a top heavy ICMF. It is also noted that the mass function of the intermediate-age star clusters in the nuclear region is shallower with than that of typical young clusters, as shown in Figure 14(c). However, this mass function can be interpreted as a result of star cluster disruption or incomplete survey.
There are several extremely massive star clusters () in the nuclear region with . They are more massive than typical globular clusters. The existence of the high mass star clusters could be interpreted as a result of a starburst phenomena of M82 at the epoch of the galaxy interaction. According to the spectroscopic study by Lançon et al. (2008), two luminous star clusters have dynamical masses of , which is slightly less massive than our results suggest (), but they are still super massive.
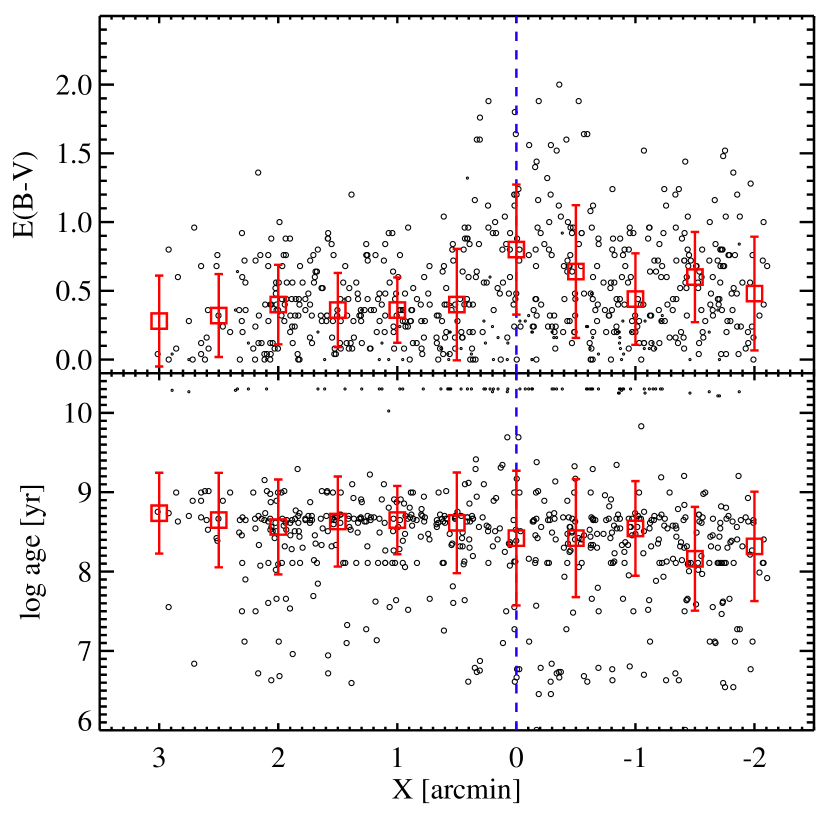
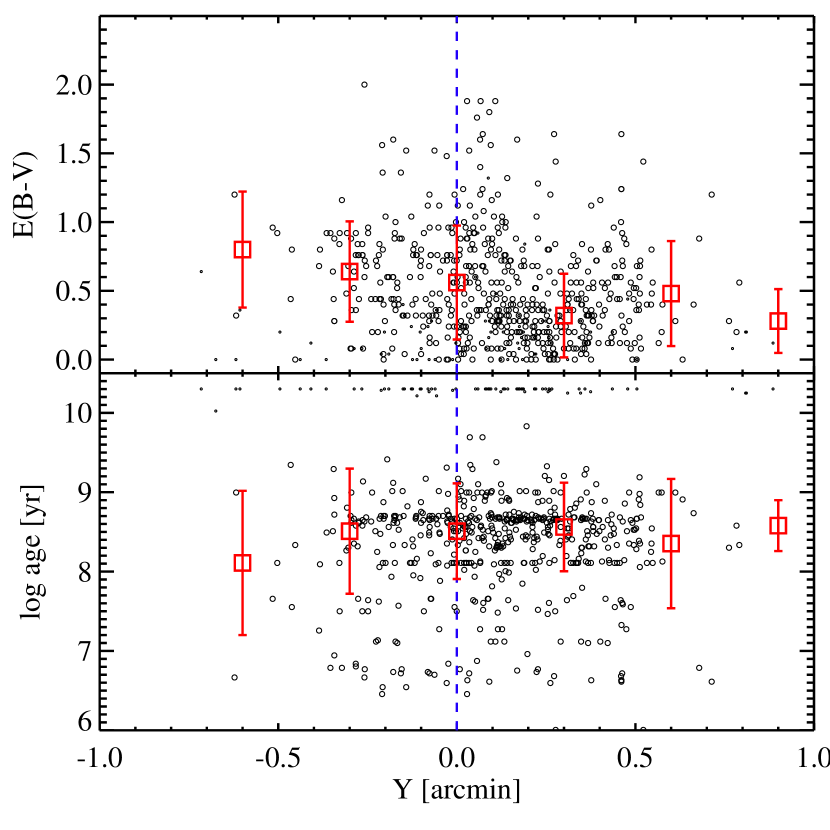
Figure 15 and 16 display variations of and ages along the major axis and the minor axis for the M82 star clusters. values are on average higher in the south-west side, indicating that the north-east side of the galaxy is farther than the south-west side. This result gives a hint for understanding the wider distribution of intermediate-color star clusters () in the north-east side. The star clusters with the largest values of are located mostly in the nuclear region. Mean values of are 0.3–0.5 in the disk region, and in the nuclear region. On the other hand, mean cluster ages show little variation along the or axes.
We tested the effect of reddening errors to the derived ages and masses of the star clusters. The errors of derived in our SED fitting for M82 clusters range from zero to about 0.1 with a mean value of 0.04. A reddening error of 0.1 for leads to 0.1 dex difference in log(age) and negligible difference in mass.
4 Discussion
4.1 Comparison with Previous Studies
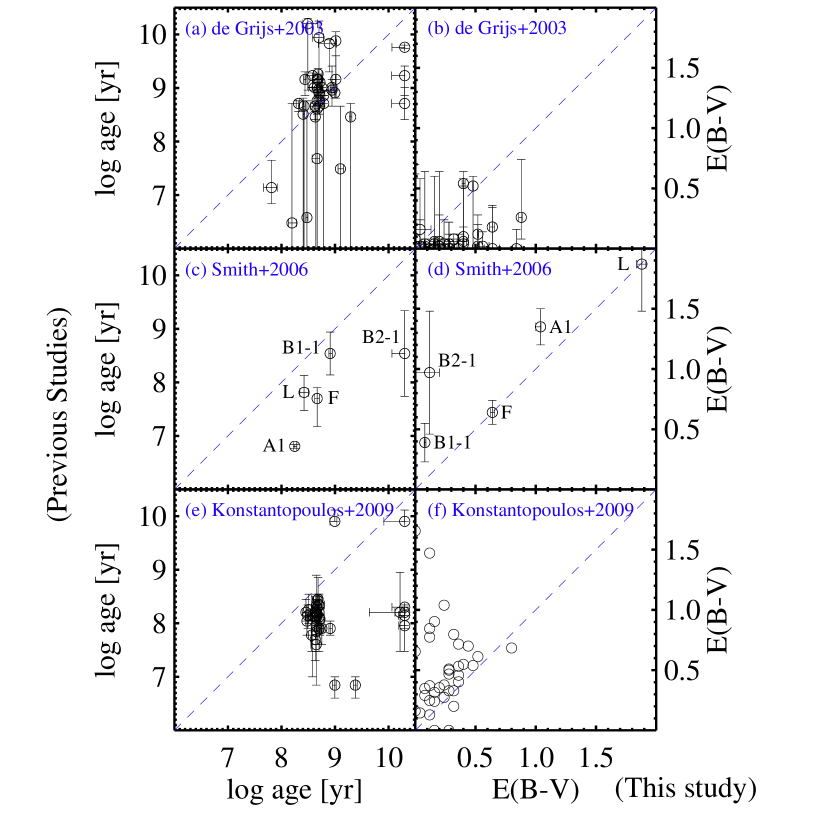
Ages and reddening values of star clusters in galaxies are often derived from the comparison of a combination of broad band photometry and/or spectra with SSP models. In Figure 17 we compare our estimates for age and reddening with those in de Grijs, Bastian, & Lamers (2003); Smith et al. (2006); Konstantopoulos et al. (2009). Our ages and reddenings show a correlation with others’s but with some scatters and systematic offsets. Our ages are on average slightly larger (0.7 dex) than Konstantopoulos et al. (2009)’s and Smith et al. (2006)’s, but slightly smaller (0.12 dex) than de Grijs, Bastian, & Lamers (2003)’s. Our reddening values are on average slightly smaller (0.2) than Konstantopoulos et al. (2009)’s and Smith et al. (2006)’s, but slightly larger (0.2) than de Grijs, Bastian, & Lamers (2003)’s that are mostly zero values. Note that Konstantopoulos et al. (2009) derived ages from the spectra first, then estimated reddenings from colors based on these ages.
These differences could be explained by raising a few points. The first possibility is the different filter sets. de Grijs, Bastian, & Lamers (2003) used filter set, while we used . It is known that the existence of band data will lead to a better determination of ages and reddenings with SED fit methods, especially for young clusters. Smith et al. (2007) found, from the photometry of the star clusters in the region B, and that their ages are much younger than those of de Grijs, Bastian, & Lamers (2003), while their reddenings are much larger than the latter. This is consistent with our findings as above. Note that de Grijs, Bastian, & Lamers (2003) obtained almost zero reddening values, which may lead to slightly older ages than those of ours (0.2 dex) with estimated reddening of .
The second possibility is the different SSP models. We used SSP models from Bruzual & Charlot (2003), while Smith et al. (2006) and Konstantopoulos et al. (2009) adopted the STARBURST99 models from Leitherer et al. (1999). This model difference could lead to the different results of the age estimation. Recently Rodríguez-Merino et al. (2011) investigated the evolution history of M82 using multi-wavelength photometry of unresolved stellar light in the disk. They used 5 arcsec apertures to derive spatially resolved star formation history of the M82 disk with multi-wavelength data from UV to NIR. They compared observational data with SED models from the Padova Group (Bressan et al., 1993) with solar-metallicity and Salpeter IMF. This model is very similar to the model adopted in this study. They derived mean values for age and reddening of the apertures for the region B, and . These values for integrated stellar light are similar to the mean values for the star clusters in the region B derived in this study, and . Therefore the model difference could be a main source of age differences between our results and those of Smith et al. (2006) and Konstantopoulos et al. (2009).
The third possibility is the different methods. We used SED fitting with broad band photometry, while Smith et al. (2006) and Konstantopoulos et al. (2009) derived cluster parameters from spectroscopy. Both methods yield similar results in general, but with a large scatter. It is not easy to disentangle clearly each possibility among these.
4.2 Halo Star Clusters in M82
There is only a little information on the existence of old stellar population in the halo of M82, while there are many observational reports showing the existence of ionized gas, atomic gas, and molecular clouds in the halo region of M82 (Taylor, Walter, & Yun, 2001; Chynoweth et al., 2008; Veilleux, Rupke, & Swaters, 2009; Roussel et al., 2010). Some observational studies reported the existence of intermediate-age stars outside the disk of M82 (Davidge, 2008). Only a small number of globular clusters in the field of M82 were discovered by previous spectroscopic studies (two in Saito et al., 2005 and two in Konstantopoulos et al., 2009). These globular clusters were found only in the south of M82 in the direction toward M81 so that Mayya & Carrasco (2009) suspected that they may not belong to M82.
In this study, we have discovered 35 star clusters in the halo region of M82. The color distribution of these halo clusters show a dominant blue peak at and they are mostly old ( Gyr). In addition they are located in a wide area surrounding M82. These suggest that a significant population of old globular clusters does exist in the halo of M82. However, there may be some contamination due to background galaxies. Measurements of radial velocities of these objects are needed to distinguish the halo members and the background galaxies.
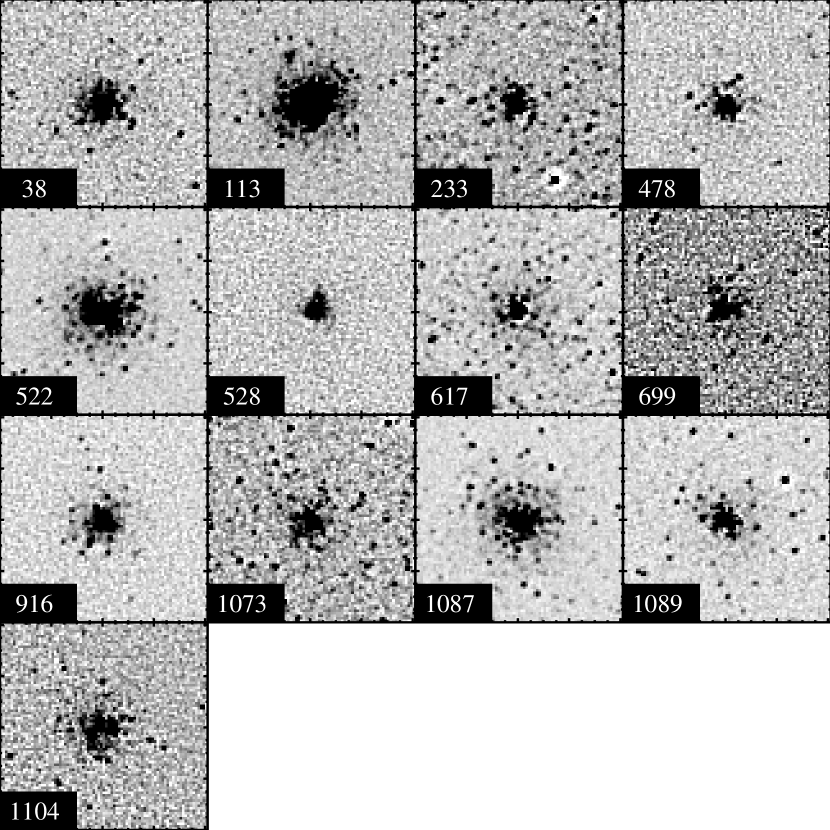
Another noteworthy point for the halo clusters in M82 is that there are some clusters whose stars are partially resolved. With the resolving power of /ACS, it is possible to resolve some bright stars in M82 (Lee et al., 2013; Jang et al., 2012). If we find star clusters that are partially resolved into stars in M82, then they can be considered to be the members of M82. We made a smoothed image for a field including each star cluster, and subtracted it from the original image to reveal any feature of resolved stars in each cluster. Then we inspected the subtracted images, finding 13 halo star clusters showing features of resolved stars, as shown in Figure 18.
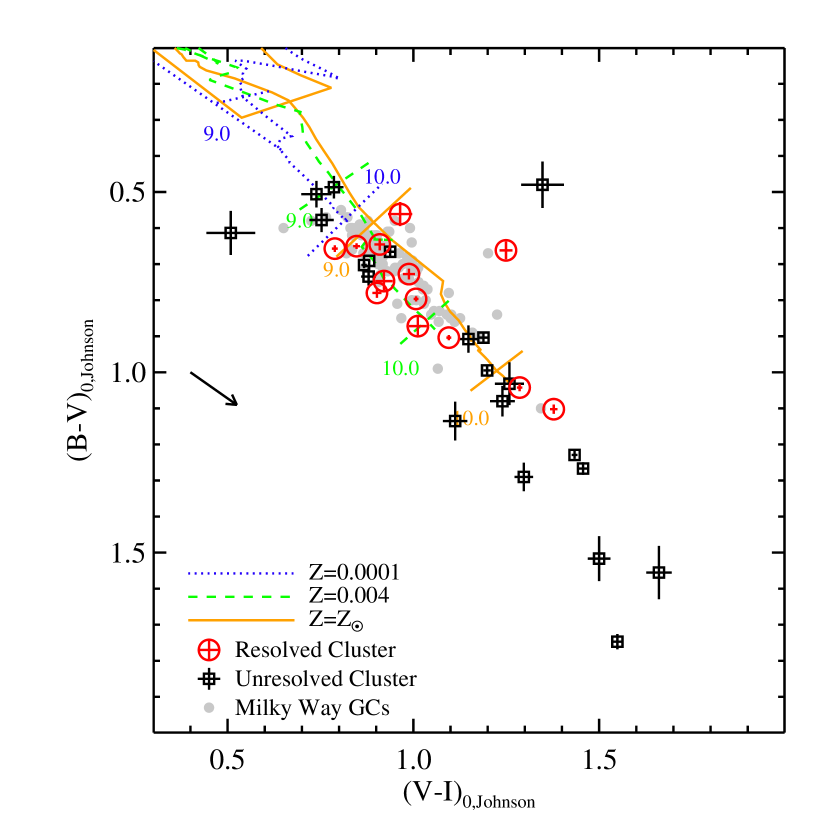
We transformed the photometry of the halo star clusters from the filter system into Johnson-Cousins filter system using the calibration information from Sirianni et al. (2005) to compare the halo star clusters with the globular clusters in the Milky Way Galaxy (Harris, 1996). Figure 19 displays a CCD of the halo star clusters. SSP models for and 0.0001 (Bruzual & Charlot, 2003) are also plotted. The star clusters with and without resolved stars are plotted in different symbols (circles and squares, respectively). Most halo star clusters have color ranges with and . This color range is similar to that of the Milky Way globular clusters. The resolved star clusters and unresolved star clusters have similar color ranges except for a few extremely red unresolved clusters. Therefore most of the unresolved star clusters are also probably the globular clusters of M82. Three reddest objects may be highly reddened star clusters.
Since the halo region is far from the disk plane (projected distance pc), we can assume that the internal extinction is negligible. The halo population in late-type galaxies is usually metal poor so that we assume a lower metallicity for the halo star clusters in M82. Based on these assumptions, the halo star clusters mostly concentrated on the region at and in Figure 19 are consistent with 10 Gyr age with Z. Several halo clusters are located in the region extended to the redder direction along the SSP model. These red halo clusters could be candidates of reddened old metal-rich star clusters. Four of them are located relatively closer to the disk (kpc), so that they might have been reddened due to internal extinction.
4.3 Comparison of M82 Halo Star Clusters with M81 Globular Clusters
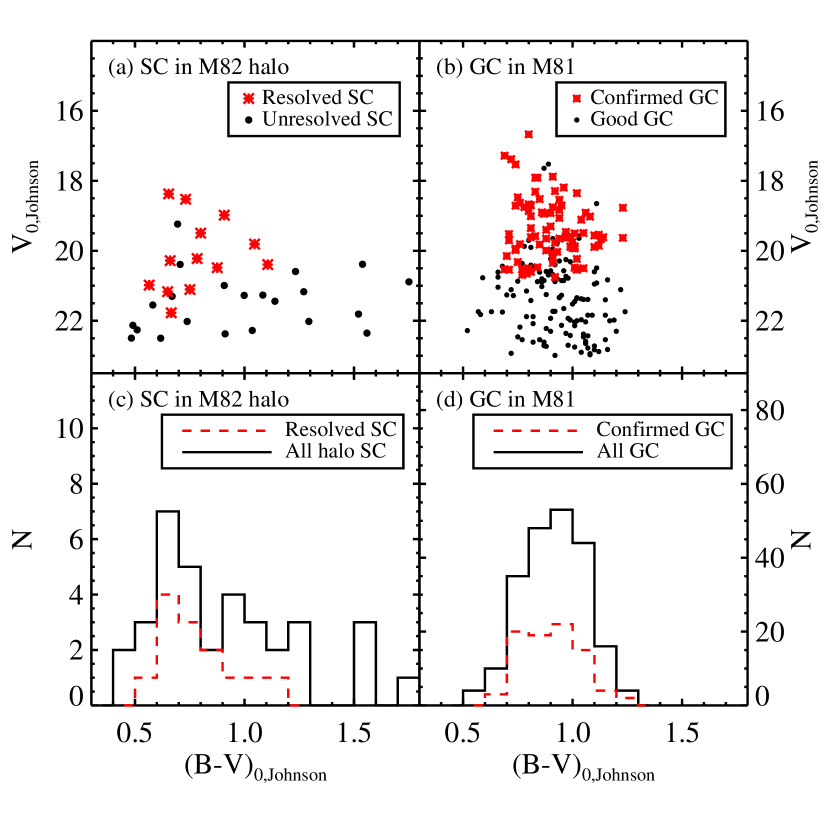
We compared the M82 halo star clusters with the M81 globular clusters in the diagrams and color distributions in Figure 20. It is relatively easy to select halo star clusters in M82, because it is an almost edge-on galaxy. In contrast, it is difficult to select halo globular clusters in M81, because M81 is almost face-on and many globular clusters were found in the projected plane of the disk region of M81.
Nantais et al. (2011) found 214 globular cluster candidates in M81 including 85 confirmed by spectroscopic studies (Nantais & Huchra, 2010), and provided a catalog of the globular cluster candidates with Johnson-Cousins photometry. The brightest globular clusters in M81 are about one magnitude brighter than those in M82. The color ranges of the M82 halo star clusters and M81 globular clusters are similar, with , although four of the unresolved halo star clusters in M82 have redder colors than .
The color distributions of the M82 and M81 clusters are different. The M82 clusters show an asymmetric distribution, while the M81 clusters have a Gaussian-like distribution. The peak color for the M82 clusters, , is bluer than that for the M81 clusters, at . This difference is seen both in the total sample and in the confirmed globular cluster samples (resolved star clusters in M82 and spectroscopically confirmed globular clusters in M81). If the internal extinction for the clusters is negligible and the mean ages are similar, the difference in the peak color could be explained by different metallicities: the M82 halo clusters are on average more metal poor than the M81 globular clusters. However it is noted that there are a small number of M82 halo clusters that have similar colors to the peak color of the M81 globular clusters. These results show that M82, showing a recent starburst, have an old stellar halo including metal poor old globular clusters, In addition, the origin of the metal-poor halo clusters in M82 appears to be different from that of the M81 globular clusters.
4.4 Evolution of M82
M82 is a famous archetype of the starburst galaxy, and many studies have concentrated on understanding of the recent starburst. Previous studies suggested that there might have been two starbursts in the central region of M82: one at 10 Myr ago and another at 5 Myr ago (Förster Schreiber, Genzel, Lutz, & Sternberg, 2003). The first starburst started in the nuclear region as well as in the bar, while the second burst in the circum-nuclear region.
Recently, Mayya & Carrasco (2009) noted from the analysis of stellar light that M82 differs from normal late type galaxies: normal spiral galaxies mostly have disks with continuing star formation, and its mean stellar age is old ( Gyr), while the mean age of the disk of M82 has relatively young ages (500 Myr) and star formation was quenched at about 100 Myr ago. This is consistent with the results derived from the star clusters in this study. Young clusters in M82 have been used to study the impact driven by dynamical interactions with M81. Chandar, Tsvetanov, & Ford (2001) found 114 star clusters in eight WFPC2 fields of M81. They showed that the young cluster formation in M81 started at 600 Myr ago from the analysis of CCD. This is consistent with the population of star clusters with an age peak at 500 Myr in M82 derived in this study. The existence of almost coeval star clusters in M81 and M82 suggests that the interaction between two galaxies at this epoch may have enhanced the star cluster formation in both galaxies.
Mayya & Carrasco (2009) suggested three possible scenarios to explain the star formation history derived from stellar light in the disk as follows: (1) a starburst galaxy formed by flyby encounter of low surface brightness (LSB) galaxies, (2) a rejuvenated disk galaxy with a truncated stellar disk, and (3) a newly formed galaxy. They supported the first scenario, but they could not rule out the other scenarios, either. We discuss each scenario in the following considering the results derived in this study.
The first scenario is based on theoretical simulations (Mihos, 1999). This simulation suggested that flyby encounter of a companion galaxy could have induced the disk-wide star formation in the host gas-rich LSB. We found that a significant star formation over the entire disk at about 500 Myr ago from the age distribution of M82 disk clusters as shown in Figure 12. If we adopt this model for the cause of the observed disk-wide star formation, then the epoch of the interaction between M81 and M82 should be about 500 Myr ago. Yun et al. (1993) suggested that the gas around M82 may have originated from M82, and it means that M82 was a gas-rich galaxy before its interaction with M81. These results support this scenario. However, this scenario cannot explain the recent central starburst in M82.
The second scenario was proposed by Sofue (1998). In this scenario, the disk of M82 was stripped by the interaction and a new disk was formed. Then the old stars stripped from the disk and halo should be discovered in the M81 group. These remnants of stripping were not yet found, but Mayya & Carrasco (2009) noted that the stripped stars may be low-mass main sequence stars and they are fainter than the detection limit of observation. However, stellar ages and velocity fields of M82 are not consistent with the expectation of this scenario (Konstantopoulos et al., 2009). This scenario suggested that the stellar contents of M82 are dominated by the bulge population. However, we found that the star clusters with ages ranging from very young ( Myr) to very old ( Gyr) exist in the nuclear region. It suggests that the star clusters in the nuclear region are not dominated by the bulge population.
The last scenario is that M82 is a newly formed galaxy. However, we found the existence of the old globular cluster system in this study, and AGB stars are also found in the halo region (Davidge, 2008). These show that M82 is not a newly formed galaxy. Therefore we can rule out the second and third scenarios. Our results support the first scenario, but the existence of recent starbursts in the nuclear region remains to be explained.
5 Summary
In this study we presented a photometric study of the star clusters in the starburst galaxy M82 based on high resolution images. We found 1105 star clusters in the entire /ACS field of M82, and derived their photometry from images. Primary results are summarized below.
-
•
A majority of the star clusters are located in the disk of M82. The scale height of their vertical number density profile is derived to be ( pc), which is similar to that of the thin stellar disk of M82. We also found 35 star clusters in the halo region of M82.
-
•
The CMDs and color distribution of the star clusters vary depending on the regions. The star clusters in the disk of M82 are composed of a dominant blue population and a weaker red population. The blue populations in the disk have a color peak at , and the red populations in the disk are mostly redder than . The star clusters in the disk-edge region are mostly bluer than , while those in the nuclear region have a large color range of . The star clusters in the halo region have a color range of that is similar to that of the globular clusters in the MWG.
-
•
The luminosity function of the disk star clusters follows a power-law function with that is similar to those of young clusters in other galaxies, while the luminosity function of the star clusters in the halo and nuclear region do not follow power-law functions. The luminosity function of the star clusters in the disk-edge region is also fit by a power-law function but with a slightly steep slope, .
-
•
The size distribution of the star clusters has a strong peak at pc, and has a long tail to larger radii. There is no significant trend between the star cluster size and galactic central distance.
-
•
We estimated the ages of about 630 star clusters in M82 with band data, and found that the most dominant population shows a peak at Myr. There are also some star clusters with younger ( Myr) and older ( Gyr) ages.
-
•
The mass function of the young star clusters (log(age)) is fit by a power law with a slope () shallower compared with that of other late type galaxies such as M51 and Antennae galaxies.
-
•
We found two populations of star clusters in the nuclear region: very young clusters with ages of 5 Myr and intermediate age clusters with ages of 500 Myr. The former represents the recent starburst, while the latter are consistent with those in the disk. The brightest young clusters have high masses (M⊙), indicating that massive clusters form preferentially in the high density regions.
-
•
The colors and ages of the halo star clusters in M82 are similar to those of the globular clusters in the Milky Way Galaxy, so that they could be regarded as old globular clusters in M82. It suggests that M82 has an old stellar halo that is similar to that of other normal galaxies. From the comparison of colors, we have found that the M82 globular cluster system is on average more metal poor than M81 globular cluster system.
-
•
Our results suggest that there were four epochs of starburst in M82. The first epoch is when the old globular clusters were formed. The second is when a majority of the star clusters were formed in the entire disk, which started 1 Gyr ago and stopped 100 Myr ago. The third is when star clusters were formed in the nuclear region Myr ago. The fourth is when star clusters were formed recently in the central region (maybe 3 Myr ago).
References
- Anders & Fritze-v. Alvensleben (2003) Anders, P., & Fritze-v. Alvensleben, U. 2003, A&A, 401, 1063
- Anders et al. (2004) Anders, P., Bissantz, N., Fritze-v. Alvensleben, U., & de Grijs, R. 2004, MNRAS, 347, 196
- Annibali et al. (2011) Annibali, F., Tosi, M., Aloisi, A., & van der Marel, R. P. 2011, AJ, 142, 129
- Barker, de Grijs, & Cerviño (2008) Barker, S., de Grijs, R., & Cerviño, M. 2008, A&A, 484, 711
- Bastian, Covey, & Meyer (2010) Bastian, N., Covey, K. R., & Meyer, M. R. 2010, ARA&A, 48, 339
- Bastian et al. (2012) Bastian, N., Adamo, A., Gieles, M., et al. 2012, MNRAS, 419, 2606
- Bell & Kennicutt (2001) Bell, E. F., & Kennicutt, R. C., Jr. 2001, ApJ, 548, 681
- Bertin & Arnouts (1996) Bertin, E., & Arnouts, S. 1996, A&AS, 117, 393
- Bertin et al. (2002) Bertin, E., Mellier, Y., Radovich, M., Missonnier, G., Didelon, P., & Morin, B. 2002, Astronomical Data Analysis Software and Systems XI, 281, 228
- Bressan et al. (1993) Bressan, A., Fagotto, F., Bertelli, G., & Chiosi, C. 1993, A&AS, 100, 647
- Bruzual & Charlot (2003) Bruzual, G., & Charlot, S. 2003, MNRAS, 344, 1000
- Cantiello et al. (2009) Cantiello, M., Brocato, E., & Blakeslee, J. P. 2009, A&A, 503, 87
- Chabrier (2003) Chabrier, G. 2003, PASP, 115, 763
- Chandar et al. (2010) Chandar, R., Whitmore, B. C., Kim, H., et al. 2010, ApJ, 719, 966
- Chandar, Tsvetanov, & Ford (2001) Chandar, R., Tsvetanov, Z., & Ford, H. C. 2001, AJ, 122, 1342
- Chandar et al. (2004) Chandar, R., Whitmore, B., & Lee, M. G. 2004, ApJ, 611, 220
- Chynoweth et al. (2008) Chynoweth, K. M., Langston, G. I., Yun, M. S., Lockman, F. J., Rubin, K. H. R., & Scoles, S. A. 2008, AJ, 135, 1983
- Davidge (2008) Davidge, T. J. 2008, AJ, 136, 2502
- de Grijs, Bastian, & Lamers (2003) de Grijs, R., Bastian, N., & Lamers, H. J. G. L. M. 2003, MNRAS, 340, 197
- de Grijs, O’Connell, & Gallagher (2001) de Grijs, R., O’Connell, R. W., & Gallagher, J. S., III 2001, AJ, 121, 768
- de Grijs & van der Kruit (1996) de Grijs, R., & van der Kruit, P. C. 1996, A&AS, 117, 19
- de Vaucouleurs et al. (1991) de Vaucouleurs, G., de Vaucouleurs, A., Corwin, H. G., Jr., Buta, R. J., Paturel, G., & Fouque, P. 1991, Volume 1-3, XII, 2069 pp. 7 figs.. Springer-Verlag Berlin Heidelberg New York,
- Durrell, Sarajedini, & Rupali (2010) Durrell, P. R., Sarajedini, A., & Chandar, R. 2010, ApJ, 718, 1118
- Förster Schreiber, Genzel, Lutz, & Sternberg (2003) Förster Schreiber, N. M., Genzel, R., Lutz, D., & Sternberg, A. 2003, ApJ, 599, 193
- Gerke et al. (2011) Gerke, J. R., Kochanek, C. S., Prieto, J. L., Stanek, K. Z., & Macri, L. M. 2011, arXiv:1103.0549
- Girardi et al. (1995) Girardi, L., Chiosi, C., Bertelli, G., & Bressan, A. 1995, A&A, 298, 87
- González Delgado et al. (2005) González Delgado, R. M., Cerviño, M., Martins, L. P., Leitherer, C., & Hauschildt, P. H. 2005, MNRAS, 357, 945
- Greco, Martini, & Thompson (2012) Greco, J. P., Martini, P., & Thompson, T. A. 2012, ApJ, 757, 24
- Harris (1996) Harris, W. E. 1996, AJ, 112, 1487
- Hwang & Lee (2008) Hwang, N., & Lee, M. G. 2008, AJ, 135, 1567
- Hwang & Lee (2010) Hwang, N., & Lee, M. G. 2010, ApJ, 709, 411
- Ichikawa et al. (1995) Ichikawa, T., Yanagisawa, K., Itoh, N., Tarusawa, K., van Driel, W., & Ueno, M. 1995, AJ, 109, 2038
- Jang et al. (2012) Jang, I. S., Lim,. S., Park, H. S., & Lee, M. G. 2012, ApJ, 751, L19
- Konstantopoulos et al. (2008) Konstantopoulos, I. S., Bastian, N., Smith, L. J., et al. 2008, ApJ, 674, 846
- Konstantopoulos et al. (2009) Konstantopoulos, I. S., Bastian, N., Smith, L. J., Westmoquette, M. S., Trancho, G., & Gallagher, J. S. III 2009, ApJ, 701, 1015
- Lançon et al. (2008) Lançon, A., Gallagher, J. S., III, Mouhcine, M., Smith, L. J., Ladjal, D., & de Grijs, R. 2008, A&A, 486, 165
- Larsen (1999) Larsen, S. S. 1999, A&AS, 139, 393
- Larsen (2002) Larsen, S. S. 2002, AJ, 124, 1393
- Larsen et al. (2011) Larsen, S. S., de Mink, S. E., Eldridge, J. J., et al. 2011, A&A, 532, A147
- Lee et al. (2013) Lee, M. G. et al. 2013, in preparation
- Leitherer et al. (1999) Leitherer, C., Schaerer, D., Goldader, J. D., et al. 1999, ApJS, 123, 3
- Lynds & Sandage (1963) Lynds, C. R., & Sandage, A. R. 1963, AJ, 68, 284
- Marigo et al. (2008) Marigo, P., Girardi, L., Bressan, A., et al. 2008, A&A, 482, 883
- Maíz Apellániz (2009) Maíz Apellániz, J. 2009, ApJ, 699, 1938
- Mayya, Carrasco, & Luna (2005) Mayya, Y. D., Carrasco, L., & Luna, A. 2005, ApJ, 628, L33
- Mayya et al. (2006) Mayya, Y. D., Bressan, A., Carrasco, L., & Hernandez- Martinez, L. 2006, ApJ, 649, 172
- Mayya et al. (2008) Mayya, Y. D., Romano, R., Rodríguez-Merino, L. H., Luna, A., Carrasco, L., & Rosa-González, D. 2008, ApJ, 679, 404
- Mayya & Carrasco (2009) Mayya, Y. D., & Carrasco, L. 2009, Revista Mexicana de Astronomia y Astrofisica Conference Series, 37, 44
- Melo et al. (2005) Melo, V. P., Muñoz-Tuñón, C., Maíz-Apellániz, J., & Tenorio-Tagle, G. 2005, ApJ, 619, 270
- Mihos (1999) Mihos, J. C. 1999, IAU Symp 186 Galaxy Interactions at Low and High Redshift, 205
- Mutchler et al. (2007) Mutchler, M., et al. 2007, PASP, 119, 1
- Nantais & Huchra (2010) Nantais, J. B., & Huchra, J. P. 2010, AJ, 139, 2620
- Nantais et al. (2011) Nantais, J. B., Huchra, J. P., Zezas, A., Gazeas, K., & Strader, J. 2011, AJ, 142, 183
- O’Connell & Mangano (1978) O’Connell, R. W., & Mangano, J. J. 1978, ApJ, 221, 62
- O’Connell et al. (1995) O’Connell, R. W., Gallagher, J. S., III, Hunter, D. A., & Colley, W. N. 1995, ApJ, 446, L1
- Ohyama et al. (2002) Ohyama et al. 2002, PASJ, 54, 891
- Park et al. (2009) Park, W.-K., Park, H. S., & Lee, M. G. 2009, ApJ, 700, 103
- Pellerin et al. (2010) Pellerin, A., Meurer, G. R., Bekki, K., et al. 2010, AJ, 139, 1369
- Rieke et al. (1980) Rieke, G. H., Lebofsky, M. J., Thompson, R. I., Low, F. J., & Tokunaga, A. T. 1980, ApJ, 238, 24
- Rodríguez-Merino et al. (2011) Rodríguez-Merino, L. H., Rosa-González, D., & Mayya, Y. D. 2011, ApJ, 726, 51
- Roussel et al. (2010) Roussel, H., et al. 2010, A&A, 518, L66
- Saito et al. (2005) Saito, Y., et al. 2005, ApJ, 621, 750
- Salpeter (1955) Salpeter, E. E. 1955, ApJ, 121, 161
- Santiago-Cortés, Mayya, & Rosa-González (2010) Santiago-Cortés, M., Mayya, Y. D., & Rosa-González, D. 2010, MNRAS, 405, 1293
- Scheepmaker et al. (2007) Scheepmaker, R. A., Haas, M. R., Gieles, M., Bastian, N., Larsen, S. S., & Lamers, H. J. G. L. M. 2007, A&A, 469, 925
- Schlegel, Finkbeiner, & Davis (1998) Schlegel, D. J., Finkbeiner, D. P., & Davis, M. 1998, ApJ, 500, 525
- Shen & Lo (1995) Shen, J., & Lo, K. Y. 1995, ApJ, 445, L99
- Sirianni et al. (2005) Sirianni, M., et al. 2005, PASP, 117, 1049
- Smith et al. (2006) Smith, L. J., Westmoquette, M. S., Gallagher, J. S., O’Connell, R. W., Rosario, D. J., & de Grijs, R. 2006, MNRAS, 370, 513
- Smith et al. (2007) Smith, L. J., et al. 2007, ApJ, 667, L145
- Sofue (1998) Sofue, Y. 1998, PASJ, 50, 227
- Taylor, Walter, & Yun (2001) Taylor, C. L., Walter, F., & Yun, M. S. 2001, ApJ, 562, L43
- Telesco et al. (1991) Telesco, C. M., Joy, M., Dietz, K., Decher, R., & Campins, H. 1991, ApJ, 369, 135
- Vansevičius et al. (2009) Vansevičius, V., Kodaira, K., Narbutis, D., et al. 2009, ApJ, 703, 1872
- Veilleux, Rupke, & Swaters (2009) Veilleux, S., Rupke, D. S. N., & Swaters, R. 2009, ApJ, 700, L149
- Whitmore et al. (2010) Whitmore, B. C., et al. 2010, AJ, 140, 75
- Whitmore et al. (1999) Whitmore, B. C., Zhang, Q., Leitherer, C., Fall, S. M., Schweizer, F., & Miller, B. W. 1999, AJ, 118, 1551
- Wills et al. (2000) Wills, K. A., Das, M., Pedlar, A., Muxlow, T. W. B., & Robinson, T. G. 2000, MNRAS, 316, 33
- Yun (1999) Yun, M. S. 1999, IAU Symp 186 Galaxy Interactions at Low and High Redshift, 81
- Yun et al. (1993) Yun, M. S., Ho, P. T. P., & Lo, K. Y. 1993, ApJ, 411, L17
- Yun, Ho, & Lo (1994) Yun, M. S., Ho, P. T. P., & Lo, K. Y. 1994, Nature, 372, 530
| Filter | Proposal ID | Instrument | Exposure times (s) |
|---|---|---|---|
| 10776 | /ACS WFC | 1600 | |
| 10776 | /ACS WFC | 1360 | |
| 10776 | /ACS WFC | 1360 | |
| 11360 | /WFC3 UVIS | 1050, 1215, 1620 | |
| 11360 | /WFC3 IR | 598, 1195 | |
| 11360 | /WFC3 IR | 598, 2395 |
| ID | R.A.(J2000) | Dec.(J2000) | () | () | () | () | () | [pc] | log(age) [yr] | |
|---|---|---|---|---|---|---|---|---|---|---|
| 481 | 9 55 47.07 | 69 40 42.3 | 16.289 0.007 | 1.127 0.012 | 1.531 0.009 | 0.764 0.015 | 1.050 0.013 | 0.697 0.019 | … | 8.67 |
| 611 | 9 55 52.68 | 69 40 46.0 | 17.061 0.028 | 1.032 0.044 | 0.906 0.092 | -0.139 0.038 | 0.545 0.353 | 1.140 0.368 | … | 9.17 |
| 628 | 9 55 53.47 | 69 40 51.1 | 17.125 0.004 | 1.322 0.006 | 2.061 0.013 | 0.500 0.009 | 1.166 0.051 | 0.815 0.069 | 3.23 | 8.25 |
| 624 | 9 55 53.34 | 69 40 49.8 | 17.207 0.020 | 1.128 0.021 | 1.425 0.075 | 0.382 0.011 | 1.162 0.194 | 0.738 0.260 | 4.76 | 9.69 |
| 561 | 9 55 50.42 | 69 40 47.3 | 17.407 0.013 | 1.260 0.017 | 1.521 0.047 | 0.366 0.016 | 1.267 0.098 | 0.618 0.139 | 4.91 | 9.38 |
| ††footnotetext: (This table is available in its entirety in a machine-readable form in the online journal. A portion is shown here for guidance regarding its form and content.) |