Properties of Liquid Iron along the Melting Line up to the Earth-core Pressures
Abstract
We report a molecular dynamics study of transport coefficients and infinite frequency shear modulus of liquid iron at high temperatures and high pressures. We observe a simultaneous rise of both shear viscosity and diffusion coefficient along the melting line and estimate if liquid iron can vitrify under Earth-core conditions. We show that in frames of the model studied in our work iron demonstrates a moderate increase of viscosity along the melting line. It is also demonstrated that in the limit of high temperatures and high pressures the liquid iron behaves similar to the soft spheres system with exponent .
pacs:
61.20.Gy, 61.20.Ne, 64.60.KwI I. Introduction
The behavior of iron at the Earth core pressure-temperature conditions is a topic of hot debates for many decades. Apparently the behavior of iron is of great importance for understanding of the phenomena occurring in the inner and outer core. However, it appears to be very difficult to find any unambiguous information about iron at such extreme conditions. The problem is clear: it is impossible to carry out direct experiments at so high temperatures. Therefore one has to use extrapolation of the lower temperatures results. This leads to a great variation of the most principle data. Even the location of the melting line of iron at high pressures is not clear: the results from diamond anvil experiments give the melting temperature approximately twice smaller then the shock wave experiments (a possible explanation of this discrepancy was proposed in Ref. stegailov ).
The situation with transport properties of iron at high pressure is even much worse. The difference between the viscosities obtained by different methods achieves br-ufn . Secco classified the iron viscosity estimations in three groups secco : the ones from geodesic measurements and seismological investigations give the Earth-core viscosity up to . The viscosities obtained from the Earth magnetic field are of the order of . Finally the theoretical predictions give the iron viscosities from up to secco . Obviously the discrepancy of between different methods can not be recognized as acceptable.
One of the possible sources of errors in the high pressure iron viscosity estimation can originate from the extrapolation of low pressure data far beyond the range of pressures where we have experimental data. In this respect it is reasonable to find a system which we can study with reasonable precision in wide range of pressures and temperatures. The most obvious way to implement this idea is to employ some model of iron in molecular dynamics.
Several authors carried out MD simulations of iron at Earth-core conditions with different empirical potentials or by means of DFT method. In Refs. fe-eam1 ; fe-eam2 the authors use the same parametrization of embedded atom potential (EAM) for iron proposed by Sutton and Chen suttonchen . The authors of Ref. fe-eam1 and Ref. fe-eam2 have chosen different density-temperature points which makes more difficult to compare theirs results. However, the viscosity data from both articles look to be consistent with each other. The viscosities at the Earth core conditions obtained in both cited papers are of the order of magnitude of . In Ref. fe-eam2 the viscosities are also compared to the ab-initio calculations of Alfe et. al alfe (Table I of Ref. alfe ). One can see from this comparison that the data from classical MD calculations and from ab-initio MD are close to each other and that there is no systematic deviation of EAM data from the ab-initio ones.
A lot of information about iron at high pressure was recently obtained by ab-initio simulations. It includes the melting line calculations am1 ; am2 , transport properties of iron alfe and mixtures of iron with other elements a-mix . However, ab-initio simulations are very computationally expensive and do not allow to study the properties of iron in a vast region of pressure - temperature points.
The goal of the present study is to perform a systematic study of liquid iron properties along the melting line in a wide range of temperatures and pressures. This will allow us to see the changes which take place in a model of realistic liquid under huge change in pressure and temperature. Since we use the same model and all data points are obtained directly we do not use any extrapolation procedures which allows us to see the general trends in the liquid iron behavior along the melting line up to the very high pressures.
II II. Systems and methods
As it was stated above the goal of this article is to study the properties of liquid iron along the melting line. In the literature there is a lot of different data on the melting line of iron obtained by different groups and using different methods. Several authors reported melting line of iron from molecular dynamic simulation.
The most extensive simulation of melting line of iron was performed by Belonosho et. al belonoshko . Basing on the EAM potential for iron introduced in this work the authors computed the melting line from Gpa up to GPa. This corresponds to the temperatures up to K which is even above the estimated Earth core temperature.
Basing on these well documented data from Ref. belonoshko we compute the properties of iron along the melting line. For doing this we simulate a system of iron atoms in the (P,T) points located along the melting line from K up to K with the temperature step K. Firstly we simulate the system in ensemble to find the equilibrium density of liquid at the given temperature and pressure. At this stage we carry out MD steps with the step size ps. When the equilibrium density is found we simulate the system in ensemble at this density in order to calculate the equilibrium structure and infinite frequency shear modulus of the liquid. At this stage the system is propagated time steps with ps. Finally using the obtained final structure at the chosen density and temperature as initial conditions we carry out simulation of the sample to find the diffusion coefficient. For doing this we simulate the system for steps with ps. The infinite frequency shear modulus is evaluated as , where and is off-diagonal pressure component. The diffusion coefficient is computed from the slope of mean square displacement of the particles via Einstein relation.
One of the central quantities of our analysis is the shear viscosity of liquid iron along the melting line. In order to compute the viscosity we employ the Reverse Non-equilibrium MD method also known as Müller-Plathe method rnemd . In this method an artificial momentum flux is imposed in the system which results in a linear velocity profile of particles. The viscosity coefficient can be calculated from the slope of the velocity profile and the momentum transferred to the system rnemd . For the viscosity calculation the system was simulated for time steps with ps. The momentum transfer was undertaken every steps. The temperature was held by coupling to Berendsen thermostat with time constant . The first half of the simulation was used for equilibration while during the second half the velocity distribution was written in the file every steps. All of these distributions written to the file were used to estimate the viscosity.
All simulations reported in this work were done by LAMMPS simulation package lammps .
III III. Results and discussion
As it was mentioned in the introduction we are interesting in the behavior of the transport coefficients of liquid iron along the melting line. In our previous publications we analyzed the behavior of simple liquids along the melting curve we-jetp ; we-pre . Two simple models were studied - soft spheres ( with ) and Lennard-Jones () liquids. It was shown that in these models both shear viscosity and diffusion coefficient grow up upon increasing pressure along the melting line. However, even if these model liquids can be used as a rough model to analyze the most general trends in liquids, the simplicity of these models can result in large qualitative errors at high pressures and high temperatures comparing to the experimental liquids. In this respect the present work is aimed to understanding the high temperature - high pressure behavior of an example of real liquid. We choose a particular case of liquid iron due to its importance in geophysical investigations.
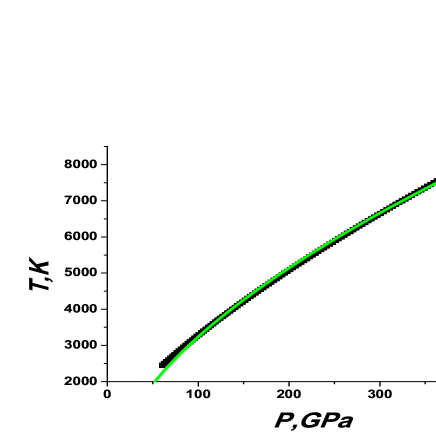
Fig. 1 (a) shows the melting line of iron belonoshko and Fig. 1 (b) demonstrates the liquid branch of the melting line in the density - temperature plane. This line was obtained by performing simulations at the data points from Ref. belonoshko . As it is expected the density of the liquid quickly rises along the melting curve.

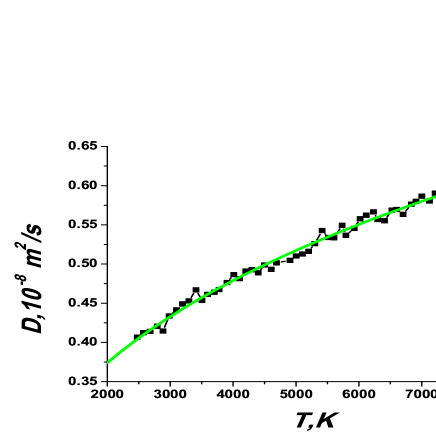
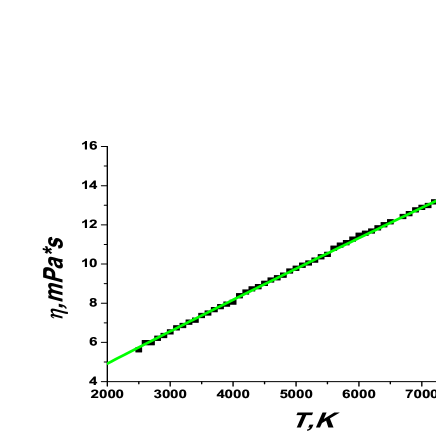
Figs. 2 (a) and (b) represent the diffusion coefficient and shear viscosity of liquid iron along the melting line. As in the case of simple models both the diffusion coefficient and the viscosity rapidly increase with increasing the temperature. The viscosity rise is especially dramatic: at the highest temperature studied ( K) it is times higher then at the lowest one ( K). At the same time the diffusion coefficient increases just times. Anyway the liquid becomes more viscous and more diffusive at the same time.
The question of simultaneous growing up of diffusion coefficient and shear viscosity was raised up in our previous publication we-pre . This question is interesting in conjunction with glass transition. The most common criteria of glass transition states that the liquid experiences glass transition when its viscosity reaches some very high value. A typical convention is that the viscosity of glass transition is Poise. However, it is implicitly assumed that the liquid looses its diffusivity under this viscosity grows. However, in case of high temperatures and high pressures both viscosity and diffusivity increase, so one comes to a contradiction to the usual common view on glass transition.
In order to solve this contradiction we proposed in Ref. we-pre to use one more criterium of glass transition: the liquid undergoes the glass transition if the relaxation time becomes as long as the typical time of experiment. Different publications propose to use or seconds or seconds as the glass transition relaxation time. Following this definition one needs to see the behavior of the relaxation time in order to understand if the liquid vitrifies following the melting line up to extremely high temperatures - high pressures limit.
The relaxation time can be computed via Maxwell relation hansen
| (1) |
where is the viscosity of the liquid and the infinite frequency shear modulus. In the majority of experimental situations it is supposed that the viscosity changes much faster then and the relaxation time is mainly determined by the viscosity behavior. This case the viscosity criterium of glass transition becomes equivalent to the relaxation time one. However, as it was shown in Ref. we-pre the infinite frequency shear modulus of liquid can dramatically grow along the melting line.
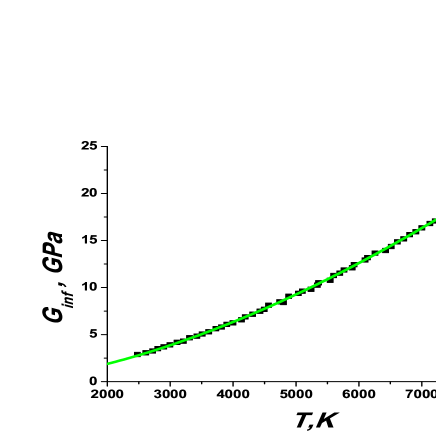
Fig. 3 (a) shows the infinite frequency shear modulus of iron along the melting line. One can see that drastically increases with increasing the temperature. The ratio of at the highest and the lowest temperatures is approximately , while for the viscosity it is . As a result in spite of the rise of viscosity the relaxation time still decreases (Fig. 3 (b)).

From the results presented above one can see that the qualitative behavior of liquid iron at high temperatures - high pressures is equivalent to the behavior of simple liquids such as soft spheres and Lennard-Jones ones. The soft spheres model is especially simple since it demonstrates a set of scaling properties along the melting line klein ; klein1 ; jzah ; hrj . The scaling relations for all quantities presented here are given in Refs. we-jetp ; we-pre . Here we repeat them for the sake of completeness:
| (2) |
| (3) |
| (4) |
| (5) |
In order to see the relations between the simplest model studied and the current liquid iron system we fit all the quantities above (, , and ) to the relations of the form , is the quantity of interest and is the correspondent exponent from eqs. (2) - (5). In order to get all of the exponents consistent with the case of soft spheres all quantities were fitted simultaneously. The results of such fitting are given in Figs. 1 - 3. The exponent coefficient is found to be equal to . One can see that except the melting pressure all of the quantities are well represented by the soft spheres-like scaling relations. In the case of pressure the deviation does not exceed in the whole range of temperatures considered in this work. However, the slope from the scaling formula and from MD data are very different which means that the melting line itself is poorly represented by the scaling law. At the same time the transport coefficients and elastic properties () are well described by the soft spheres-like model.
It is well known that the structure of liquid metals can be well approximated by simple hard spheres model ashcroft . In Ref. fe-hs experimental measurements of liquid iron structures factors were reported and the comparison of experimental curves with the hard spheres model was done. As it follows from Fig. 3 of Ref. fe-hs the structure factors of iron can be sufficiently well represented by hard spheres ones which proves that the main contribution into the liquid structure comes from repulsive part of the interaction. It is well known that the structure of liquid is closely related to its transport properties and therefore one can expect that simple purely repulsive models of liquid can reproduce the diffusion and shear viscosity of iron sufficiently well.
At the same time melting line is strongly affected by the presence of attractive terms in the interparticle interaction potential we-jcp1 which means that a purely repulsive model such as soft spheres should fail to reproduce the melting curve of a system with both repulsive and attractive interactions.
One of the experimental studies of the liquid iron viscosity at high pressure was reported in Ref. visc-hp-exp . The authors of this paper measured the viscosity at temperature as high as K and found that the change in viscosity comparing to the room temperature is small. Basing on this result they concluded that the statement proposed by Poirier that the viscosity of liquid is nearly constant along the melting line poirier is correct. From our results we can conclude that it is just partially true. The viscosity change along the melting line is not fast: it increases times on -fold temperature change. However, we observe the systematic rise of viscosity along the melting line so one can not claim that it is constant: if on measures the viscosities along the melting line for large enough temperature interval one will clearly see the rise of viscosity. However, the temperatures studied in our work range from K up to K which exceeds the range of temperatures reported in most of experimental works. It means that in the range of temperatures explored in experiments the viscosity change can be small enough to use Poirier statement with sufficient accuracy.
IV Conclusions
The present article represents a molecular dynamics study of transport coefficients and glass transition of liquid iron in the limit of high temperatures - high pressures along the melting line. We show that both shear viscosity and diffusion coefficient increase along the melting line. However, due to very rapid increase of the infinite frequency shear modulus the relaxation time drops quickly with increasing the pressure along the melting curve which means that liquid iron becomes harder to vitrify at higher temperatures and higher pressures.
It is worth to note that the magnitude of viscosities we obtain are consistent with other simulations of liquid iron at high temperatures and high pressures fe-eam1 ; fe-eam2 ; alfe . However, it looks that all simulations of iron at such extreme conditions strongly underestimate the shear viscosity.
Surprisingly, the behavior of liquid iron at Earth-core like temperatures and pressures can be sufficiently well qualitatively described by soft spheres model which is one of the simplest models of liquid. By fitting the MD data to the soft spheres scaling relation we find that liquid iron is qualitatively similar to the soft spheres with the exponent .
The most important difference between the soft spheres and liquid iron represented by the EAM potential Ref. belonoshko is in the collective nature of the later. It is well known that in the limit of high pressures the particles come very close to each other and the system is dominated by the repulsive excluded volume effects and the collective effects can become negligible. Our simulations confirm this speculation and propose that the exact results for soft spheres reported in our previous work we-pre can be extrapolated to the high temperature - high pressure limit of liquids in general.
Acknowledgements.
Y.F is grateful to A. B. Belonoshko (Theoretical Physics KTH, Sweden) for sharing his results for the iron melting line and V.V. Stegailov (JIHT RAS) for his help with simulations. Y.F. also thanks the Joint Supercomputing Center of the Russian Academy of Sciences and the Russian Scientific Center Kurchatov Institute for computational facilities. The work was supported in part by the Russian Foundation for Basic Research (Grants No 13-02-00579, No 13-02-00913, No 11-02-00341-a and No 11-02-00303) and the Ministry of Education and Science of Russian Federation, projects 8370 and 8512.References
- (1) S.V. Starikov and V. V. Stegailov, Phys. Rev. B, 80, 220104 (2009).
- (2) D.E. Smylie, V.V. Brazhkin, A. Palmer, Uspekhi Fizicgeskikh Naus 179, 91 (2009).
- (3) R.A. Secco ”Viscosity of the outer core”, in Mineral Physics and Crystallography: A Handbook of Physical Constans (AGU Refer- ence Shelf, Vol. 2, Ed. T J Ahrens) (Washington, DC: American Geophysical Union, 1995) p. 218.
- (4) Y. Zhang, G. Guo, G. Nie, Phys. Chem. Minerals 27, 164 (2000).
- (5) C. Desgranges and J. Delhommelle, Phys. Rev. B 76, 172102 (2007).
- (6) A. P. Sutton and S. Chen, Philos. Mag. Lett. 61, 139 (1990).
- (7) D. Alfe, G. Kresse, and M. J. Gillan, Phys. Rev. B 61, 132 (2000).
- (8) D. Alfe, G.D. Price and M.J. Gillan, Phys. Rev. B 65, 165118 (2002).
- (9) D. Alfe, ”Iron at Earth’s Core Conditions from First Principles Calculations”, Book Series: Reviews in Minearology & Geochemistry 107, 337-354 (2010).
- (10) M. Pozzo, Ch.Davies, D. Gubbins and D. Alfe, Phys. Rev. B 87, 014110 (2013).
- (11) A. B. Belonoshko, R. Ahuja, and B. Johansson, Phys. Rev. Lett. 84, 3638 (2000).
- (12) Muller-Plathe, Phys Rev E, 59, 4894 (1999).
- (13) S. Plimpton, Fast Parallel Algorithms for Short-Range Molecular Dynamics, J. Comp. Phys., 117, 1 (1995); http://lammps.sandia.gov/
- (14) Yu. D. Fomin, V. V. Brazhkin, V. N. Ryzhov JEPT Lett., 95, 320 (2012).
- (15) Yu. D. Fomin, V. V. Brazhkin, V. N. Ryzhov Phys. Rev. E 86, 011503 (2012).
- (16) J.-P. Hansen, I.R. McDonald. ”Theory of simple liquids”, Academic Press (1986).
- (17) O. Klein, Medd. Vetenskapsakad. Nobelinst. 5, No. 6 (1919).
- (18) T.H. Berlin and E.W. Montroll, J. Chem. Phys. 20, 75 (1952).
- (19) V. V. Zhakhovsky, Zh. Eksp. Teor. Fiz. 105, 1615 (1994)[JETP 105, 1615 (1994)].
- (20) W.G. Hoover, M. Ross and K. W. Jonson, Journal of Chemical Physics. 52, 4931 (1970).
- (21) N.W. Ashcroft and J. Lekner, Phys. Rev. 145, 83 (1966).
- (22) G. Shen, V. B. Prakapenka, M.L. Rivers and St. R. Sutton, Phys. Rev. Lett. 92, 185701 (2004).
- (23) Yu. D. Fomin, E. N. Tsiok, and V. N. Ryzhov, J. Chem. Phys., J. Chem. Phys. 134, 044523 (2011).
- (24) M. D. Rutter, R. A. Secco, H. Liu, T. Uchida, M. L. Rivers, St. R. Sutton, and Y. Wang, Phys. Rev. B, 66, 060102(R) (2002).
- (25) J.P. Poirier, Geophys. J. 92, 99 (1988).