A 2.5-5 m Spectroscopic Study of Hard X-ray Selected AGNs using AKARI InfraRed Camera
Abstract:
We present results of the 2.5-5 m spectroscopy of a sample of hard X-ray selected active galactic nuclei (AGNs) using the grism mode of the InfraRed Camera (IRC) on board the infrared astronomical satellite AKARI. The sample is selected from the 9-month Swift/BAT survey in the 14-195 keV band, which provides a fair sample of AGNs including highly absorbed ones. The 2.5-5 m spectroscopy provide a strong diagnostic tool for the circumnuclear environment of AGNs through the continuum shapes and emission/absorption features such as the 3.3 m polycyclic aromatic hydrocarbon (PAH) emission and the broad 3.1 m H2O ice, 3.4 m bare carbonaceous dust, 4.26 m CO2 and 4.67 m CO absorptions. As our first step, we use the 3.3 m PAH emission as a proxy for the star-formation activity and searched for possible difference of star-formation activity between type 1 (unabsorbed) and type 2 (absorbed) AGNs. We found no significant dependence of the 3.3 m PAH line luminosity, normalized by the black hole mass, on optical AGNs types or the X-ray measured column densities.
1 Description of the Research
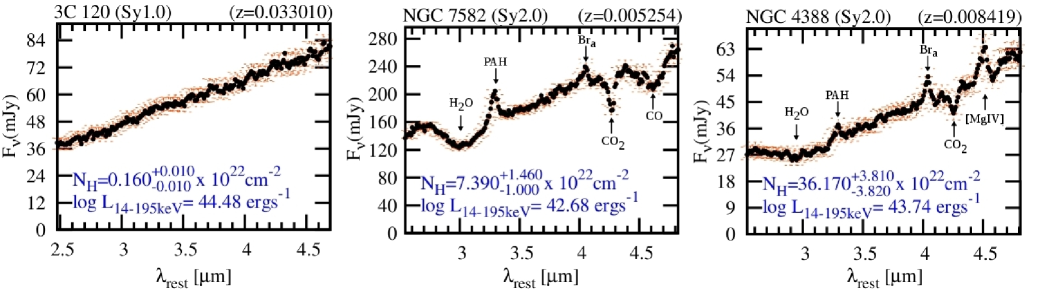
Infrared spectroscopy is a powerful tool for the diagnostic buried AGNs, because the effect of dust extinction is relatively small [2]. It allows to study sources in which both an AGN and a starburst (SB) are present. Very hard X-ray surveys such as available with Swift Burst Alert Telescope (BAT), provide efficient way of constructing a fair sample of AGNs including heavily obscured ones. The infrared 2.5-5 m spectra available with the Infrared Camera (IRC) grism mode on board AKARI provide us with rich pieces of information, which enable us to probe the environments of AGNs as well as their circum-nuclear star-formation activities through the continuum shape as well as emission/absorption lines (Fig. 1). For example, the 3.3 m polycyclic aromatic hydrocarbon (PAH) feature is a good indicator of the star-formation activities and the broad 3.1 m H2O ice, 3.4 m bare carbonaceous dust, 4.26 m CO2 and 4.67 m CO provide information on the physical properties of the absorbing material.
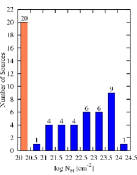
In this work, we investigate the 2.5-5 m low-resolution (R 120) spectra obtained with the IRC instrument of the Japanese space infrared observatory AKARI of a sample of 55 AGNs with various obscuring levels selected from the 9-month catalog[5] of the Swift BAT survey, which is sensitive to very high X-ray energies (14-195 keV). Our selected sample also has detailed X-ray spectroscopy (0.3-12 keV)[6, 1]. For all objects in our sample X-ray-derived neutral hydrogen column densities obtained mainly by analyzing spectra from XMM-Newton, ASCA, Suzaku, and Swift/XRT. Figure 2 (Left) shows the histogram of the sample.
As our first step, we use the 3.3 m PAH emission detected in our spectra (or its upper limits) as a proxy for the star-formation activity. We compare the PAH 3.3 m luminosities (), normalized by the blackhole mass () estimates by a scaling relation with the J and K band luminosities [4], between Type 1 (un-absorbed) and Type 2 (absorbed) AGNs.
2 Results
To test the difference of star-formation activities between different types of AGNs the following correlation analyses have been made. The regression has been made using the EM algorithm (included in the ASURV package[3]) to account for upper-limits of the .
-
1.
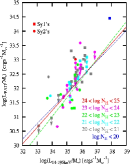
Compare the log()-log() correlations of optical Type 1 and Type 2 AGNs (Fig. 2 [Center]). Luminosities are in units of and in units of .
Type 1 (28 objects):
Type 2 (27 objects):
-
2.
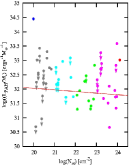
Investigate the relation between and (Fig. 2. [Right]). The result is:
3 Conclusions
We investigate the 2.5-5 m spectra of 55 bright nearby AGNs from the 9-month Swift BAT catalog using AKARI/IRC. We investigate the relation between AGN type/absorption and star formation activities. From our analysis, we have found no significant difference between the star formation and the optical AGN type. We have found no significant correlation between the neutral gas absorption towards the AGN measured by X-ray absorption and circum-nuclear starburst activity.
References
- [1] Ichikawa, K., Ueda, Y., Terashima, Y., et al., 2012, ApJ, 754,45
- [2] Imanishi, M., Nakagawa, T., Shirahata, M., Ohyama, Y., & Onaka, T. 2010, ApJ, 721, 1233
- [3] Isobe, T., Feigelson, E. D., and Nelson, P. I., ApJ, 306, 490
- [4] Mushotzky, R.F., Winter, L.M.,McIntosh, D.H.& Tueller, J. 2008, ApJ, 684, 65
- [5] Tueller, J., Mushotzky, R.F., Barthelmy, S., et al. 2008, ApJ, 681, 113
- [6] Winter, L.M., Mushotzky, R.F., Reynolds, C.S.& Tueller, J., 2009, ApJ, 690, 1322