Present Address: ]National Institute of Advanced Industrial Science and Technology (AIST), Tsukuba Central 2, 1-1-1 Umezono, Tsukuba,Ibaraki 305-8568, Japan
Beta-delayed neutron and gamma-ray spectroscopy of 17C utilizing spin-polarized 17B
Abstract
Excited states in 17C were investigated through the measurement of -delayed neutrons and rays emitted in the decay of 17B. In the measurement, three negative-parity states and two inconclusive states, were identified in 17C above the neutron threshold energy, and seven lines were identified in a -delayed multiple neutron emission of the 17B decay. From these transitions, the -decay scheme of 17B was determined. In particular, a de-excitation 1766-keV line from the first excited state of 16C was observed in coincidence with the emitted -delayed neutrons, and this changes the previously reported -decay scheme of 17B and level structure of 17C. In the present work, the -NMR technique is combined with the -delayed particle measurements using a fragmentation-induced spin-polarized 17B beam. This new scheme allows us to determine the spin parity of -decay feeding excited states based on the difference in the discrete -decay asymmetry parameters, provided the states are connected through the Gamow-Teller transition. In this work, , , and () are assigned to the observed states at 2.71(2), 3.93(2), and 4.05(2) MeV in 17C, respectively.
pacs:
21.10.Hw, 21.60.Cs, 23.40.-s, 24.70.+s, 27.20.+n, 29.27.HjI Introduction
Neutron-rich carbon isotopes are attracting because of their anomalous level structures. It has been experimentally shown that none of the odd mass neutron-rich carbon isotopes, 15-19C, have the ground-state (GS) spin parities of , despite the valence neutron expected from a naive shell model. In 15C, having the neutron number , the inversion of single-particle levels between and is suggested from the GS spin parity of 15C, TAL60 ; SUZ94_S12N9 . Intriguingly, the further neutron-rich nucleus 17C with , has shown to have . This assignment was performed through the study of GS properties based on the direct reaction BAU98 ; BAZ98 ; SAU00 ; MAD01 ; SAT08 , -delayed neutron spectroscopy of the decay of 17C SCH95 , and magnetic moment of 17C OGW02_17C . In the extremely neutron-rich nucleus 19C with , the value again becomes ; this was confirmed and discussed in connection with the formation of a neutron halo NAK99 ; BAZ95 ; MAD01 .
In these neutron-rich carbon isotopes, unlike the valence protons, which occupy the shell, the valence neutrons occupy the shell, where the - cross-shell interactions characteristically play an important role. To gain an understanding of these intriguing properties of - neutron-rich carbon isotopes, it is important to investigate not only the GS but also the structure of the excited states, because those negative-parity states can be described such that one particle in the the shell of the low-lying positive parity states is excited to the shell, and thus, their energy differences from the low-lying positive-parity states are expected to reflect directly such the effective interactions.
With regard to the excited states of 17C, the existence of three low-lying positive-parity states has been proposed at 210, 295, and 330 keV below the one-neutron threshold energy 0.729(18) MeV AU97 . An excited state observed at 295(20) keV NOL77 in the 48Ca(18O, 17C)49Ti reaction was again observed at 295(10) for the same reaction, carried out at a slightly higher beam energy FIF82 . However, the 295-keV state was interpreted to be a background (BG) event during the in-beam -ray spectroscopy performed with a 17C beam KAN05 . Two more excited states were observed at 207(15) keV and 329(5) keV in the two-step fragmentation reaction STA04 . Two corresponding energy levels were observed, i.e., 210(4) keV and 331(6) keV, in the (19C, 17C) reaction, for which values were assigned as and , respectively ELE05 . The same assignments were identified in the one-neutron removal reaction of 18C from a proton target, wherein a coupled-channel analysis was performed for the corresponding levels 210 keV and 330 keV KON09_17C , and in the lifetime measurement, in which case the M1 transition strengths were discussed for the observed 212(8)- and 333(10)-keV states SUZ08_17C . For high-lying states, thirteen positive-parity states, including the 310(30) keV level, have been observed up to 16.3 MeV in the study of the 14C(12C, 9C)17C reaction BOH04 .
Even then, only a few studies have been conducted on the negative-parity states in 17C. For studying negative-parity states in 17C, it is useful to perform the -decay study of 17B. In the light mass region of neutron-rich nuclei, the parity of -valence neutrons differs from that of -shell valence protons, whereby -decay allowed transitions feed negative-parity states MK3 . Hence, a -decay study is useful for studying neutron-rich nuclei located away from the stability line, owing to the large windows. Over the past several years, a number of such studies have been performed on the structure of light-mass neutron-rich nuclei through the time-of-flight (TOF) measurement of emitted -delayed neutrons HAR99_15B ; SCH94 ; SCH95 ; RAI96_17Bbn ; AOI02 .
In the present work, we performed the spectroscopic study of -delayed neutrons and rays in the decay of 17B in order to investigate the level structure of 17C (hereafter, -delayed neutron(s) and -delayed ray(s) are denoted as -n and -, respectively). The -n measurement of the 17B decay has thus far been reported in Ref. RAI96_17Bbn , and in this study, several -decay transitions to the excited states in 17C above the neutron threshold energy, which were followed by neutron emission, were observed. However, in the construction of the decay scheme, all transitions observed in a one-neutron (1n) emission channel were assumed to be directly connected to the GS of 16C. In order to identify the final states in 16C subsequent to the -n emissions, we also conducted -ray measurements in coincidence with the rays and neutrons. Moreover, it should be noted that this measurement was combined with a technique of fragmentation-induced spin-polarization ASAHI ; OKUNO . Thus, the GS of 17B, as an initial state of decay, was spin-polarized. The angular distribution of the decay through the Gamow-Teller (GT) transition from a spin-polarized nucleus is known to show anisotropy with respect to the polarization axis, and it is characterized by , where denotes the asymmetry parameter of the corresponding GT transition given by the value of the initial and final states and denotes the polarization of the parent nucleus. Since is common to all the transitions, the final state can be assigned such that becomes proportional to the experimentally determined values when the initial state is known. For the first time, by using this new method, the values of the excited states in 15C have been successfully assigned with the spin-polarized 15B beam MIYA03 . Further, by taking the advantage of highly spin-polarized Li and Na beams, the nuclear structures of 11Be HIR05 and 28Mg SHI12 have been studied through the spin-parity assignment of the excited states.
II Experimental procedure
II.1 Production of spin-polarized 17B beam
A spin-polarized 17B beam was produced using the same procedure as described in Ref. HU17B , in which the fragmentation-induced spin polarization technique was adopted ASAHI ; OKUNO . A beam of 17B was obtained from the fragmentation of a 22Ne projectile with an energy of 110 MeV and a current of 90 particle-nA incident on a 93Nb target having a thickness of 1.07 g/cm2. In order to obtain a spin-polarized 17B beam, the emission angles and outgoing momenta of the 17B fragments were suitably selected ASAHI ; OKUNO . Thus, fragments emitted within radial angles and azimuthal angles along with the primary beam were accepted by the RIKEN projectile-fragment separator RIPS RIPS , using a beam swinger installed upstream of the target. A range of the momentum values, i.e., 7.11 to 7.55 GeV/, was selected with the help of a slit at the intermediate momentum-dispersive focal plane. This momentum range corresponds to the range 1.01–1.07, where GeV/ is the fragment momentum corresponding to the projectile velocity. The isotope separation was given by the combined analyses of the magnetic rigidity and the momentum loss in a wedge-shaped degrader RIPS with a median thickness of 1638 mg/cm2 and a slope angle of 8.67 mrad.
The spin-polarized and isotope-separated 17B fragments were then introduced into an apparatus located at the final focus of RIPS, for the -delayed particle measurement. They were implanted in a Pt stopper located at the center of the apparatus, which consisted of a stack of four 100-m-thick Pt plates. The beam implantation was confirmed with plastic scintillators placed upstream and downstream of the Pt stopper. The the upstream counter was used to distinguish the beam particles from contaminating tritons. Under the conditions described above, RIPS provided a 17B beam with a purity of 100%, not considering tritons, and an intensity of 17.3 particles per second (pps).
II.2 Detector apparatus
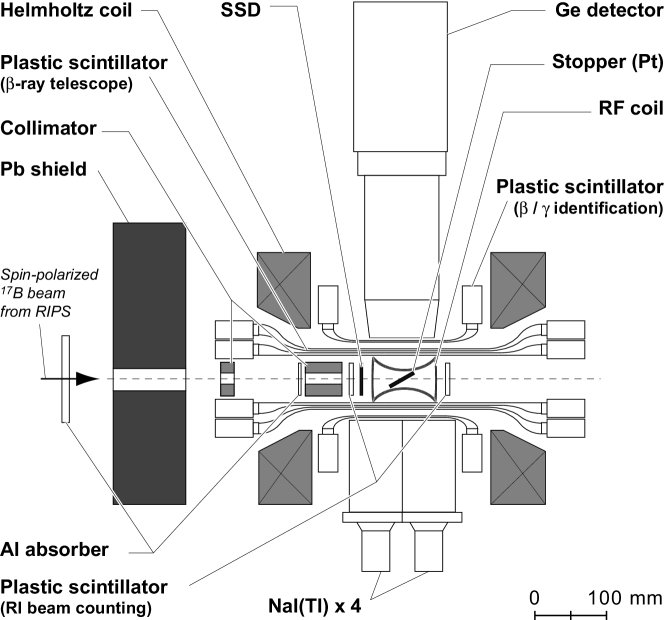
We combined the -ray detected nuclear magnetic resonance (-NMR) technique SUG66 with the -delayed particle emission measurement. A static magnetic field, mT, whose inhomogeneity was , was applied to the Pt stopper with a Helmholtz-type air coil in order to preserve the spin polarization of 17B. The effective diameter of the coil was 250 mm. -Rays emitted from the implanted fragments were detected with -ray telescopes, consisting of two plastic scintillators, located above and below the Pt stopper. To exclude BG events, such as those involving cosmic muons, coincidences with signals from the other side of the -ray telescope were checked as soon as a -ray was detected.
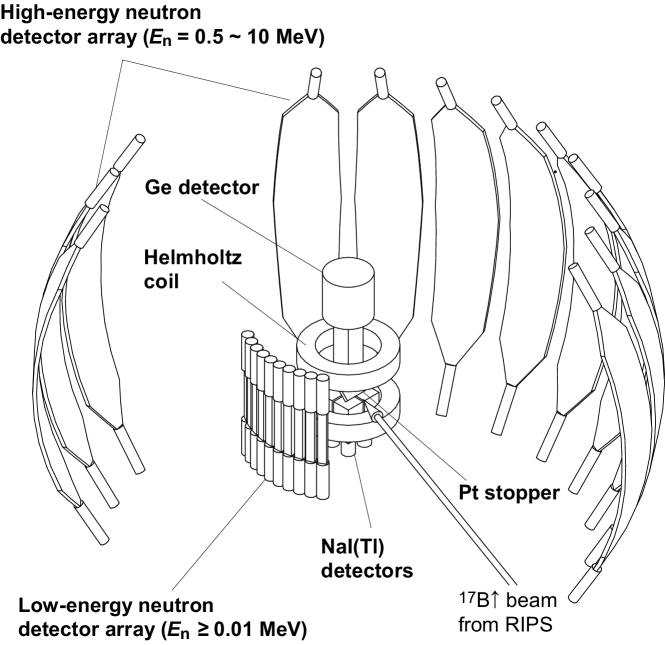
The -n emitted from the implanted 17B were measured with a high-energy neutron detector array AOI02 ; MIYA03 , consisting of a set of twelve plastic scintillators, whose shapes were curved in the vertical direction with a 150-cm radius, 160-cm arc length, and 40-cm latitudinal width in the median plane. The achieved electron-equivalent threshold energy, 3.4(27) keVee, of the neutron detector array, enabled the detection of low-energy neutrons at MeV, and an efficiency of 5.6% for 1 MeV neutrons was achieved as a result. A high-energy neutron detector array was placed 1.5 m away from the Pt stopper, as shown in Fig. 1, covering the solid angles sr. In this configuration, neutrons emitted vertical to the -ray direction were detected, which minimized the neutron-energy broadening due to -ray recoil effects. The neutron energies were determined using the TOF method, wherein the -ray signal was used as the start pulse. The signal was read out from photomultiplier tubes (PMTs) attached at each end, and both the read out signals were used to determine the correct TOF by calculating the mean time. Neutrons within the energy range MeV were analyzed with this high-energy neutron detector array.
The detection efficiency of the neutron detector array was determined using 15B and 17N beams, whose -decay branches associated with -n emission are known OWM76_17Nbn ; HAR99_15B . Using these calibration data, the efficiency was determined as a function of the energy , based on the simulation code given in Ref. CEC79 , where the reduction of photo-propagation in the plastic scintillator was taken into account. Details pertaining to the high-energy neutron detector array are given in Ref. MIYA03 . For the measurement of neutrons having an energy down to MeV, a low-energy neutron detector array AOI02 covering the solid angle 0.0374 sr was placed on a concentric circle to achieve a distance of 0.5 m from the Pt stopper, which consisted of a set of ten 45 mm 25 mm 300 mm plastic scintillators. The signal was read out from the PMTs attached at each end. The threshold energy was set to 2 keVee using the Compton edge of 137Cs.
In addition to the neutron counters, a 50 mm 70 mm Clover Ge detector JON95 and a set of four 80 mm 80 mm 152 mm NaI(Tl) detectors were placed above and below the -ray telescope, as shown in Fig. 2. The PMTs housed in the NaI(Tl) detectors are a type of fine-mesh dynodes, which can be operated under strong magnetic fields with strengths of over 1 T HAMA6614 . In front of each Ge and NaI(Tl) detector, 2-mm-thick plastic scintillators were placed in order to distinguish and rays. With the help of these plastic scintillators, NaI(Tl) detectors were used to measure not only -ray energies but also the -ray total energy, , for up to 30 MeV, which covers a of 22.68(14) MeV AU97 . The data were calibrated for a sufficiently wide range using 17N and 15B, whose values are 8.680(15) and 19.094(22) MeV, respectively AU97 .
II.3 Block diagram
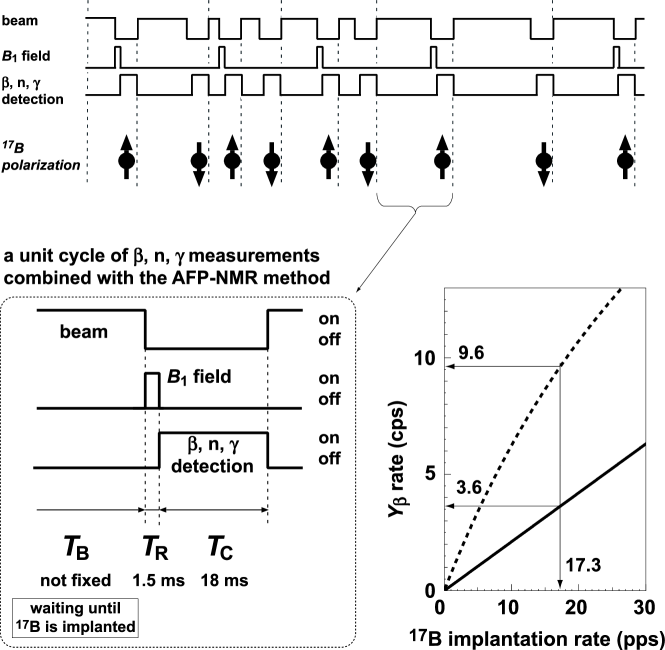
The conventional block diagram for -NMR measurements shows a beam being pulsed with a beam bombardment period of . At the beginning of the beam-off period in these measurements, the oscillating magnetic field is applied for a duration of , with its frequency swept over a Larmor frequency in order to reverse the direction of the spin polarization by means of the adiabatic fast passage (AFP) NMR method ABRAGAM . Then, rays are counted during the following period, . This unit cycle, , is repeated many times until sufficient statistics have been accumulated. Note that the time length of the unit cycle is generally set to , where is the decay constant of the nuclei of interest. Through the execution of this sequence, a maximum figure of merit given by is achieved, where is the -ray counting rate and is the nuclear spin polarization. Ideally, should be set by taking into account the spin-lattice relaxation time of the nuclei. The -ray counting rate is then given by
| (1) |
where is the beam-implantation rate during the period . In this sequence, however, 50% of the beam needs to be blocked, despite the low production yield of the 17B beam.
For more efficient measurements, the block diagram was improved in the present study, and it is illustrated in Fig. 3. The beam was not pulsed periodically at fixed durations. Instead, as soon as a 17B particle was identified by the beam-line counters equipped with RIPS, the beam bombardment was turned off for 19.5 ms. At the beginning of the beam-off period, the field 1.6 mT was applied for a duration of 1.5 ms, and in this duration, the frequency of was swept over the Larmor frequency of 17B HU17B in the frequency window = 2%. Then, the rays, in addition to rays and neutrons, were measured during a subsequent time period of 18 ms. After the beam-off period, the beam bombardment was again turned on until the next 17B particle was detected. The field was applied every two beam-off cycles, to ensure that the direction of the spin polarization would change alternately; this reduced the systematic error due to differences in the efficiencies of the two -ray telescopes and long-term beam-profile fluctuation. The yield in this beam-waiting mode is given by
| (2) |
Based on Eqs. (1) and (2), the yields of 17B were calculated, for the purpose of comparison, as a function of the intensity of a 17B beam in the fixed beam-on/off cycle mode and the beam-waiting mode, where ms was assumed as a typical sequence in the former mode. As shown in the inset of Fig. 3, counts per second (cps) for the beam-waiting mode, and it is 2.6 times larger than cps, which is observed for the fixed beam-on/off cycle mode under an actual 17B intensity of pps. Factually, 12.9-pps 17B particles were implanted at the intensity of pps because of the dead time due to the 19.5-ms beam blocking period . This effect is already considered in Eq. (2).
Another important advantage of the new beam-waiting mode is the high S/N ratio in the -ray measurements. Given the reported multiple neutron emission probabilities in the 17B decay DUF88 , 3.6 rays are emitted on an average in the -decay chain initiated by one decay. Since all decay-chain nuclei have significantly longer lifetimes than 17B, the BG rays from these nuclei are assumed to be detected with the same probability inside windows. For pps, the S/N ratio in the fixed beam-on/off mode is S(3.6 cps)N(16.8 cps) 0.22, whereas in the beam-waiting mode, the S/N ratio is 4.3 times better and has the value S(9.6 cps)N(10.5 cps) 0.92.
II.4 Principle of the spin parity assignment
The angular distribution function for the rays emitted from 17B with the spin polarization is given by
| (3) |
where denotes the angle between the direction of the emission and the axis of the nuclear polarization, and are the velocities of the particles and light, respectively, and is the asymmetry parameter. For simplicity, we use the approximation , since only a high-energy portion of the spectrum is included in the analysis. Then, the asymmetry of the -decay transition feeding neutron emissions is given by
| (4) |
Here, using the measured -n spectra recorded with the identification of the signal-detected -ray telescope, the double ratio in Eq. (4) is given by
| (5) |
where are the relevant peak counting rates in the neutron TOF spectra measured in coincidence with signals from the -ray telescopes located above (denoted by U) and below (denoted by D) the Pt stopper and are those obtained with the resonant -field application. With the obtained values, asymmetry parameters can be determined provided the polarization is known.
In the case that the spin state decays through the pure GT -decay transitions associated with the spin change , the -decay asymmetry parameter value is given by
| (9) |
By comparing the determined values to the value given in Eq. (9), the final spin parity can be determined in the case of a pure GT -decay.
In order to apply this method, it is necessary to know and one value from among the GT -decay transitions for the determination of the spin polarization . In the present experiment, is known for the GS of 17B HU17B , whereas none of the final state values are known. Therefore, similar to the assignment for 15C MIYA03 , the following method was performed.
For a given set of GT transitions to the level (=1, 2, , ), there are 3n combinations of the possible values. For each allocated value, the polarization is evaluated as , where is the measured asymmetry. For the proper combination of values, i.e., for the correct spin assignments for all relevant final states, the evaluated values need to be consistent with each other. It is therefore expected that for improper combinations of values, the expected value of will have systematic errors and the variance of will increase. In other words, a correct assignment should reveal the least variance of . This is the guiding principle for determining values simultaneously. For the th set of values, the mean spin polarization is calculated as
| (10) |
where is the statistical weight factor for each value,
| (11) |
with the experimental error for . By definition, the reduced for the th set is given as
| (12) |
where denotes the degree of freedom ( ). The above-mentioned guiding principle is that the most probable set of values should yield the least among the 3n values for all possible combinations of values. In such a case, can be regarded as the statistically expected spin polarization , whose error is defined by
| (13) |
III Analysis and Results
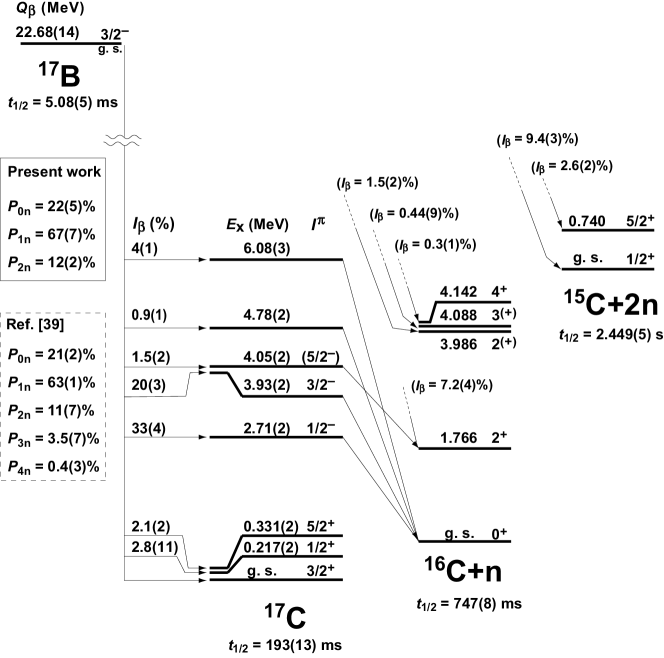
The 17B nucleus has the ground-state spin parity . Its decay, whose halflife is 5.08(5) ms and is 22.68(14) MeV AU97 , can be characterized by a -delayed multiple neutron emission DUF88 ; REE91 , for which multiplicities of up to four have been reported DUF88 . In the following analysis, the decay property was investigated by classifying the multiplicity of the emitted -n.
III.1 0n-decay branches
The 0n mode of the decay, i.e., a decay not followed by -n emission, can feed excited states in 17C below the neutron separation energy 0.729(18) MeV or the GS. Until now, the existence of three excited states has been suggested at the excitation energy values 210 keV STA04 ; ELE05 ; KON09_17C ; SUZ08_17C , 295 keV NOL77 ; FIF82 , and 331 keV STA04 ; ELE05 ; KON09_17C ; SUZ08_17C ; BOH04 , below MeV. Investigation of these three states is a central subject for the 0n channel.
III.1.1 -Ray energy spectra obtained from the - coincidence measurements
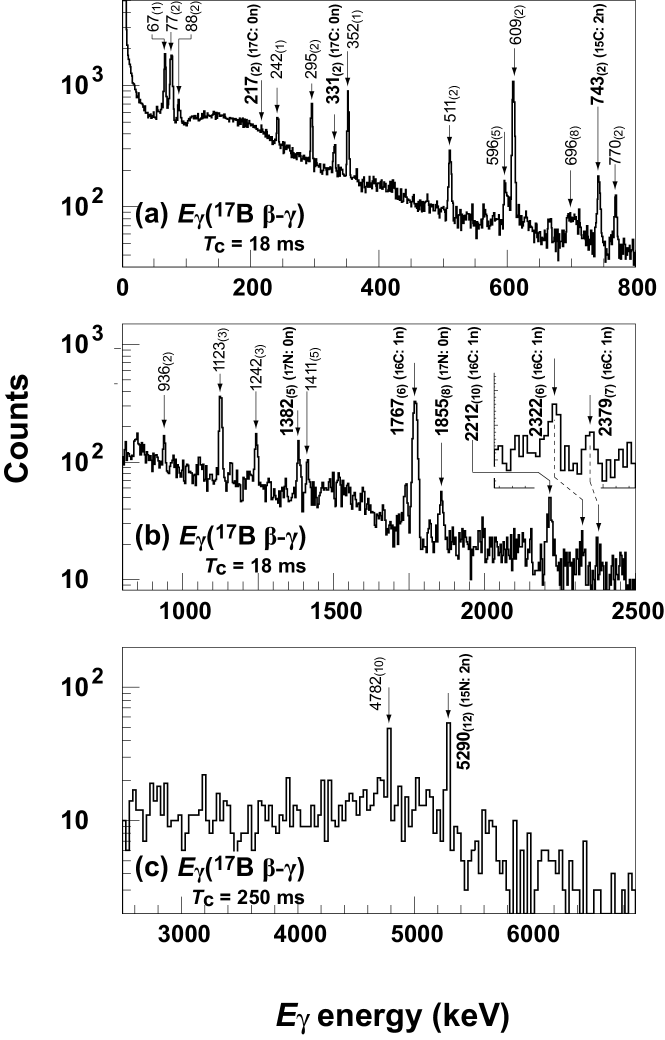
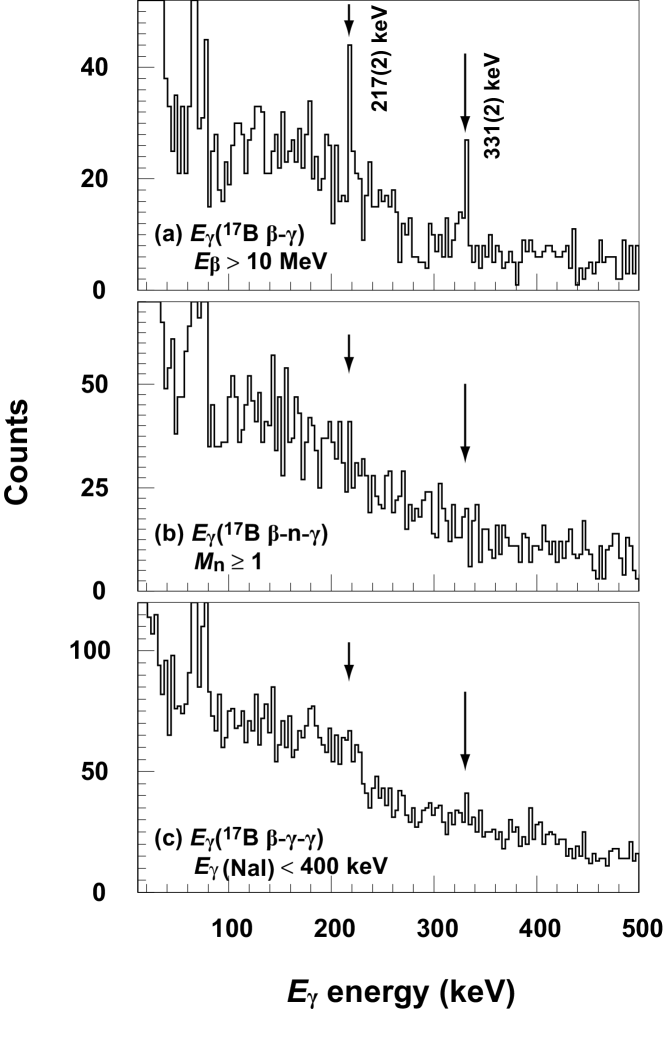
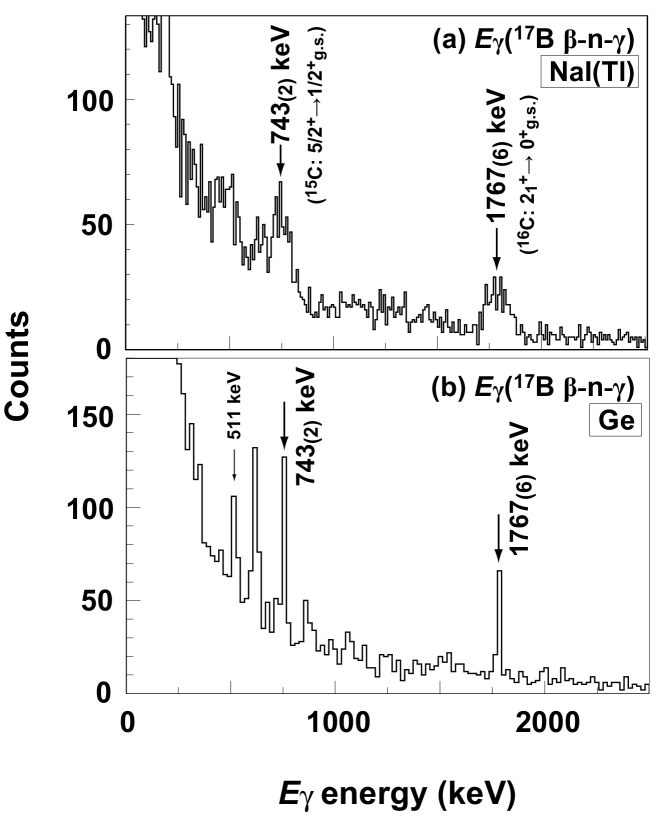
The observed -ray energy peaks below 0.729(18) MeV, measured with the Ge detector in coincidence with the ray from 17B, are summarized in Table 1. For a comparison, details of rays observed in a BG measurement without a beam and in a detector-calibration measurement with a 17N beam are also listed in Table 1. First, the rays observed in the BG measurement, i.e., 77(2), 242(1), 352(1), and 609(2) keV, as well as the 511-keV annihilation ray, can be excluded from the 17B - candidates. They can be assigned to KX or the rays from the lead parts of the experimental setup, in which some amount of the U/Th decay-chain isotopes 214Pb and 214Bi are considered to be included. The reason that the 242(1)-keV ray was not observed in the 17N measurement is not clear. This may be attributable to the short measurement time. Next, the rays observed in the 17N - measurement, i.e., and 696(8), can be also excluded. They originate from the (n, ) or (n, n’) reactions, given that their shapes are broadened and skewed towards higher energy, which is a typical feature that reveals the neutron-recoil effect in Ge detectors. Here, a 67(1)-keV peak observed in both the 17B and the 17N measurements can be assigned to the rays originating from the Pt stopper excited by the rays. The remaining -ray peaks at 295(2) and 331(2) keV, as well as a small peak at 217(2) keV, are thus the potential rays emitted from 17C subsequent to the 17B decay.
III.1.2 Properties of the peaks at 217, 295, and 331 keV
Properties of these rays were then investigated in terms of the total energy of the feeding ray, which was measured with the set of NaI(Tl) detectors and 2-mm-thick plastic scintillators described in Sec. II.2. The de-excitation rays from low-lying excited states of 17C are associated with large -ray energies, where the maximum -ray energies are MeV, owing to the small value. Thus, an spectrum was obtained, as shown in Fig. 5(a), by gating the spectrum shown in Fig. 4(a) with the -ray energy at MeV. We note that the 331(2)-keV ray was still observed, while the 295(2)-keV peak disappeared. In addition, a minor peak at keV, as seen in Fig. 4(a), is clearly observed in Fig. 5(a). Although the Th decay-chain isotope 228Ac could be a possible BG event, the 217(2)-keV ray was observed in neither the BG nor 17N measurements, suggesting that the 217(2)-keV peak as well as 331(2)-keV peak originate from the 17B decay.
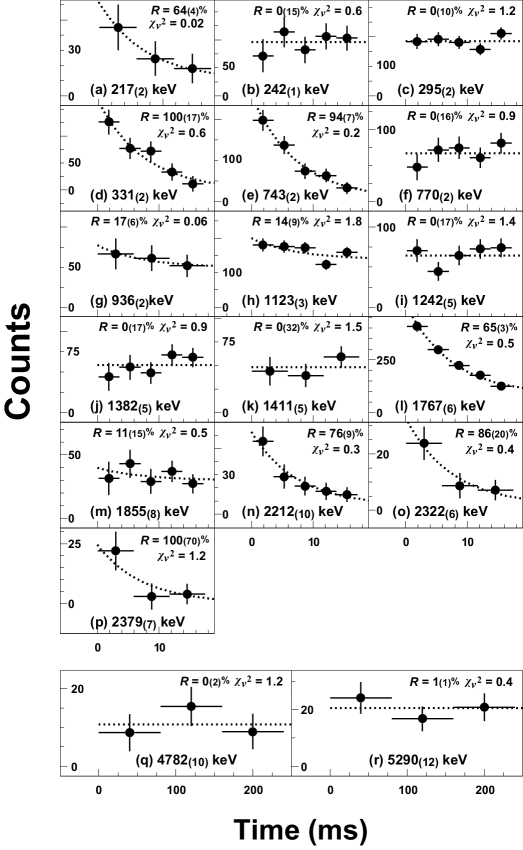
These rays were further investigated in order to determine their decay parent nuclei based on (i) the coincidence to -n emission and (ii) the time evolution of the -ray peak counting rates. For determining (i), a -ray energy spectrum obtained with the a Ge detector was plotted for -n- triple coincidence events. From the resulting spectrum shown in Fig. 5(b), no peaks were identified within the given statistics at 217(2) and 331(2) keV, indicating that these rays were not associated with neutron-emission channels in the 17B decay. As described by point (ii), the time evolution of the photo-peak counting rates was deduced to identify a parent nucleus. A time stamp recorded with was the time of a - coincidence event measured from the arrival time of a 17B particle, which started at , as shown in Fig. 3. Thus, the time evolution in this analysis provides the -decay lifetime of a parent nucleus feeding the relevant emission. The obtained time spectra for 217(2), 295(2), and 331(2) keV are shown in Figs. 6(a), (c), and (d), respectively. Dotted lines shown in the spectra represent the result of a least fitting analysis with an exponential function having a known 17B halflife, , plus a constant. The time spectra of 217(2) and 331(2) keV are well reproduced by , unlike the time spectrum of 295(2) keV, which is rather flat, suggesting a long lifetime of the feeding decay. This flat spectrum is similar to the 242(1)-keV line in Fig. 6(b), which is a BG emission line. With regard to the two points described above, we concluded that the 217(2)- and 331(2)-keV rays are emitted subsequent to the 17B decay in the 0n channel, while the 295(2)-keV rays is emitted by long-lifetime daughter isotopes produced in the -decay chain from 17B. The source of the 295(2)-keV ray was not identified due to its long lifetime, as compared with the present value of the counting period 18 ms.
Finally, an spectrum obtained from the -- triple coincidence measurement was plotted to determine whether the 217(2) and 331(2)-keV rays can be assigned to a direct transition to the GS or a cascade transition. The second -ray coincidence was detected with the set of thin plastic scintillators and NaI(Tl) detectors mentioned above, wherein the signal from the plastic scintillator was used to remove -ray events. Figure 5(c) shows an spectrum obtained in coincidence with the second ray at keV, measured with the NaI(Tl) detectors. This energy value was selected to investigate the cascade decay below the neutron threshold MeV. Since no peaks were found at the energy values 217(2) and 331(2) keV in Fig. 5(c), we concluded that these two rays are emitted from the levels 217(2) and 331(2) keV during the transition to the GS in 17C.
III.1.3 Other lines
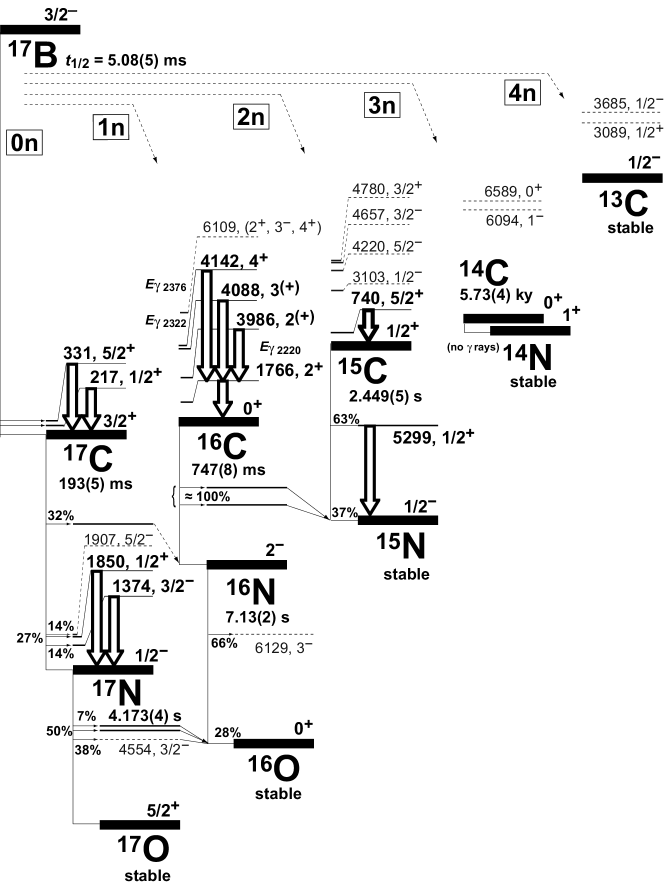
Other observed lines, whose sources are not clear, are plotted in Fig. 6. The time evolution of the lines at = 743(3), 1767(6), 2212(10), 2322(6), and 2379(7) keV, as shown in Figs. 6(e), (l), (n), (o), and (p), respectively, are well reproduced by , indicating that these lines were directly fed by the 17B decay, without the involvement of any daughter isotope decays. As shown in Fig. 7, the 743(3)-keV line was identified as the de-excitation line of the state at keV GS in 15C, while the lines at 1767(6), 2212(10), 2322(6), and 2379(7) keV were identified as the de-excitation lines from the 1766(10), 3986(7), 4088(7), and 4142(7) keV states in 16C, respectively. The line at keV observed in Fig. 4(c) agrees with the line of 4780(100) keV GS for 15C. As shown in Fig. 6(q), however, its time evolution is flat, suggesting that the feeding decay is different from the 17B (-n) decay. Its source was not identified in this study. In all -decay channels associated with -n emission, the time evolution becomes flat for the given window due to the long lifetimes of the daughter nuclei. The lines at 1382(5) and 1855(8), shown in Figs. 6(j) and (m), respectively, correspond to the de-excitation lines at 1373.8(3) and 1849.5(3) keV in 17N, which are - decays of the daughter nucleus 17C in the 0n channel of the 17B decay. Further, in the 2n channel, the line observed at 5290(12) keV was identified as the 5298.822(14)-keV line in the 15C - decay. Other peaks at 770(2), 936(2), 1123(3), and 1242(5) keV were also investigated by studying their time evolution, as shown in Figs. 6(f), (g), (h), and (i), respectively; no direct correlation of these peaks with the 17B decay was observed. They were likely emitted from the decay chain; however, the transitions that caused these peaks could not be identified in this study.
III.1.4 Transition strengths in the 0n channel
Strengths of the observed lines per 17B decay were determined using the following equation.
| (14) |
Here, is the photo peak count, (17B) are implanted 17B particles, and are, respectively, the overall detection efficiencies of the Ge detector and the -ray telescopes, including their solid angles, which are evaluated based on the simulation code of GEANT GEANT . is the probability that a decay of a parent nucleus is directly feeding a relevant --ray emission within the duration . The values were obtained from a simulation based on the following equation
| (15) | |||
where is the exponential probability density distribution with a decay constant , is its cumulative distribution function, is the inverse of the meanlife of the 17B decay, is that of the daughter’s -decay constant that directly feeds a relevant -ray emission, and is the arrival time of th 17B particle at which the gate opens after the first implantation. The probability distribution of is also given by with the average 17B beam arrival rate pps.
The transition strengths of the line, for which decay schemes were identified, were determined using Eq. (14). The resulting values, as well as the corresponding values obtained after converting them to and , are listed in Table 2. In the derivation of the value associated with the 1767(6)-keV line, the contributions from the cascade transitions from 2212(10), 2322(6), and 2379(7) keV were subtracted. It should be noted that the values for 2212(10), 2322(6), and 2379(7) keV can include the sum of other -decay transitions in the 1n channel that are followed by that particular ray emission, because these three decays could be a part of cascade decays from the higher levels.
It is known that in the 17C decay, - rays are emitted with 1373.8(3) and 1849.5(3) keV with the transition strengths % and and %, respectively TIL93 . With the values obtained from the above analysis for the discussed lines and the two mentioned transition strengths, the total 0n-channel probability can be derived by using the equation . By taking the weighted average of the resulting probabilities, % and %, we obtained %. This probability agrees with the reported 21(2)% DUF88 , within the assigned error bounds.
III.2 1n-decay branches
In the one-neutron (1n) decay channel, 17B decays into the levels above the neutron threshold 0.729(18) MeV. All of these branches are connected with the GS of 16C. If a transition is connected with an excited state in 16C, the neutron emission is further followed by the de-excitation ray emission. The subsequent decay of 16C, whose halflife is 747(8) ms AU97 , is similarly followed by the neutron emission to 15N with 100% branches in all. This described decay cascade stops at the stable nucleus 15N.
Thus, the 1n-decay channel has been studied through the measurement of -n RAI96_17Bbn , in which four excited states of 17C, i.e., 1.18, 2.25, 2.64, and 3.82 MeV, were identified using a TOF measurement, assuming the direct 1n-decay transition to the 16C GS for all branches. In the present measurement, the Ge and NaI(Tl) detectors were well tuned to detect and thoroughly investigate de-excitation rays in 16C through -n- triple coincidence measurements.
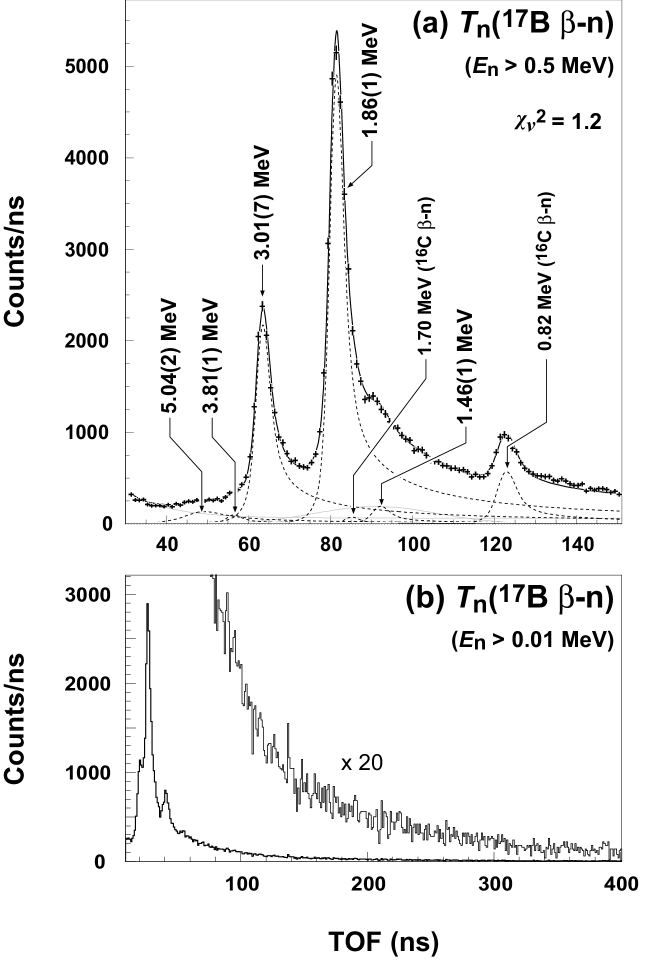
III.2.1 TOF measurement of -delayed neutrons
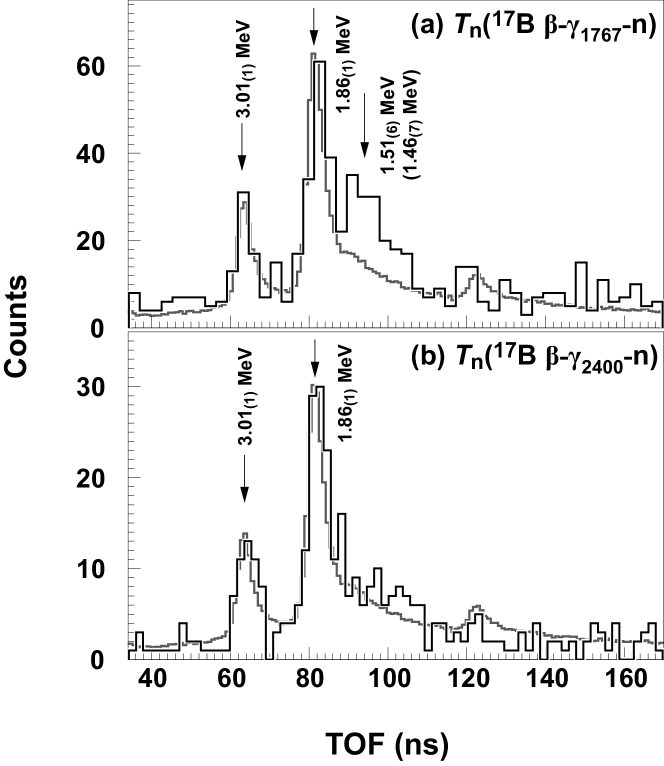
Figure 8 shows the obtained neutron TOF spectra for the emitted neutrons from the 17B decay; they are measured with (a) high-energy and (b) low-energy neutron detector arrays, and the multiplicity of the neutron is limited to . As clearly seen in Fig. 8(a), three peaks can be identified at 64, 81, and 122 ns, which correspond to the neutron kinetic energies 3.01, 1.86, and 0.82 MeV, respectively. Since it is known that in the 16C decay ( 747(8) ms), -n are emitted at 0.82(1) and 1.70(1) MeV RAI96_17Bbn , the observed 0.82-MeV peak can be assigned to 0.82(1) MeV. The other two peaks at 3.01 and 1.86 MeV can be assigned to the -n from the 17B decay. These two major peaks were also observed at almost the same energies 2.91(5) and 1.80(2) in Ref. RAI96_17Bbn .
The obtained neutron TOF spectrum shown in Fig. 8(a) was analyzed using the response function (described later in the text) of the neutron detector array. This response function was determined so as to reproduce the well studied -n from the 17N decay OWM76_17Nbn . In the present analysis, the following four factors were taken into account: (a) the level width of the initial state, (b) uncertainty in the flight path of the neutrons due to the counter misalignment and a finite beam-spot size, (c) the long low-energy tail due to the scattering of emitted neutrons from materials around the Pt stopper, and (d) uncertainty in the time resolution, such as the intrinsic time resolution of the and neutron detectors. In order to account for factor (a), the response function essentially assumes a Lorentzian function , and it includes the additional term to account for factor (c), where is empirically determined. The response function is then obtained as a Gaussian convolution of to account for factors (b) and (d). Thus, the function uses three parameters, the amplitude of peaks, the neutron kinetic energy , and the level width . The detailed description of is given in Ref. MIYA03 .
Next, peak-decomposition was conducted through the least -fitting analysis with the obtained function. In this analysis, the following three types of BGs were taken into account: (i) neutrons emitted in the multi-neutron emission channel initiated by the 17B decay, which was assumed to have a Gaussian shape with a wide width at the position 100 ns, empirically determined from a TOF spectrum of neutrons, measured with the neutron multiplicity ; (ii) scattered rays expressed by a spectral curve monotonically decreasing with ; and (iii) a constant BG. The -n emitted from the decay of 16C, for 0.82(1) and 1.70(1) MeV, were also considered, and the reported relative intensities were fixed in this case. The result of the fitting analysis is shown in Fig. 8(a) using dashed curves. Other than the two major peaks, which were determined to be at 3.01(1) and 1.86(1), the existence of minor peaks corresponding to neutron kinetic energies 5.04(2), 3.81(1), and 1.46(1) MeV was suggested. Ref. RAI96_17Bbn has reported two minor transitions at 1.43(2) and 0.42(1) MeV. The first value listed agrees with the present 1.46(1) peak, with only a small difference, although no peak corresponding to the second value was visible in the spectrum. We also investigated neutrons at a lower with the low-energy neutron array. However, in the obtained spectrum shown in Fig. 8(b), no further peaks were identified at any down to 0.01 MeV.
III.2.2 Neutron-decay branches to excited states in 16C
In order to construct the decay scheme, it is necessary to investigate connected states in 16C after neutron emission. Here, we first studied a -ray energy spectrum obtained in a -n- triple-coincidence measurement. As shown in Figs. 9(a) and (b), the de-excitation rays from the first exited state in 16C at 1766(10) keV to the GS were clearly identified as a peak in the spectrum measured using both the NaI(Tl) and Ge detectors. Another peak was also observed at 743(2) keV, which corresponds to the de-excitation rays from the 15C excited state at 740.0(15) keV to its GS following the two-neutron emission in the 2n channel of the 17B decay. To confirm the initiating decay feeding the two corresponding emissions, the time evolution of their counting rates were investigated as in the 0n-channel analysis. Both the consequently obtained time spectra, shown in Figs. 6(e) and (l), were well reproduced by , which shows that these emissions were directly fed by the 17B decay. Further, two small peaks are observed in Fig. 4(b) at 2322(6) and 2379(7), which agrees with the de-excitation lines 2322(6) and 2379(7) keV from the state at keV and the state at keV on 16C, respectively. The time-evolution analysis described above was also performed for these two lines, and the results are shown in Figs. 6(o) and (p), respectively. Although the statistics are not sufficient, they are reproduced by (17B), suggesting that the 17B decay directly feeds these two emissions through -n emissions. Although peaks should appear at 2322(6) and 2379(7) in the gated spectrum shown in Fig. 9, they are not observed due to the limited statistics.
In the next step, -n components connected to the keV state in 17C were investigated. Figure 10 shows a neutron TOF spectrum measured under the -n- coincidence condition, and in the measurement energies were set as (a) 1767 keV and (b) 2400 keV. To enable clear comparison, the normalized TOF spectrum without the window (i.e., the spectrum shown in Fig. 8(a)) is also drawn using gray lines. In both the spectra, two major peaks at 3.01(1) and 1.86(1) MeV still appear. However, this does not imply that the two peaks are connected to the 1767(6)-keV line. The peaks are caused by accidental coincidences owing to the following two reasons. First, The TOF spectrum obtained for keV, at which no Compton scattering from the 1767(6) keV rays can interfere and no other photo peaks are observed, is analogous to the spectrum in the ungated case, as shown in Fig. 10(b). In addition, the obtained counting rates of the two major peaks are 20 times smaller than those expected on the basis of the spectrum shown in Fig. 8(a) and the given NaI(Tl) efficiency. If we closely examine Fig. 10(a), however, a peak can be observed at 95 ns, which is emphasized by the 1767(6) keV gate. This peak energy, MeV, agrees with the MeV obtained in the described peak decomposition analysis of the ungated spectrum. In addition, the transition strength %, evaluated using the 1.51-MeV peak count based on Eq. (17), which accounts for the NaI(Tl) efficiency, agrees with the value % for the 1.46-MeV peak determined as described in Sec. III.2.4. It is then natural to conclude that both the peaks are identical. No peaks are observed at 5.04(2) and 3.81(1) MeV in Fig. 10(a), although peaks with statistics comparable to the peak should be observed if they are also connected to the keV state.
III.2.3 Neutron-decay branches to the 16C ground state
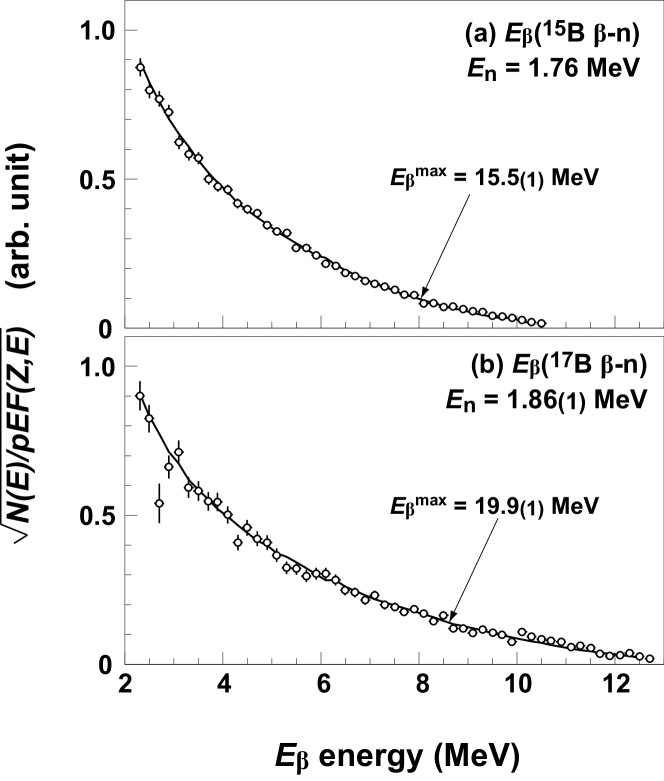
Because it was shown that only the 1.46(1)-MeV peak was connected to the 1767(6)-keV line, the two major peaks at 3.01(1) and 1.86(1) MeV, as well as the minor peaks at 5.0 and 3.8 MeV, were assigned to the direct transition to the 16C GS. As described in the following text, this assignment was verified with the MeV peak having the highest statistics, through the measurement of the end-point energy of the decay associated with this peak. Figure 11(b) shows a -ray energy spectrum of the 17B decay obtained with the combination of the NaI(Tl) and plastic scintillators in the -n measurement by gating at 1.86(1) MeV. The spectrum is expressed in the form of the Kurie plot , where and are of the total energy and momentum of the particle, is the observed -ray yield at , is the Fermi function, and is the atomic number of the parent nucleus. The obtained -ray energy spectrum was analyzed using a GEANT GEANT simulation, in which an arrowed -decay transition was assumed by taking into account its value 4.8(1), determined in the present work, as explained later. The obtained end-point energy 19.7(1) MeV agrees well with the 19.9(1) MeV value for the transition to the 16C GS calculated using the of 17B and the neutron energy 1.86(1) MeV, while it differs from MeV when the -n emission is connected to the 1767(6) keV emission line. The accuracy of the analysis was evaluated using the 15B decay measured in the present work. It is known that in the 15B decay, the transition to MeV, which has the highest transition strength in the decay, is followed by the MeV -n emission HAR99_15B ; MIYA03 . Thus, a Kurie plot was also obtained for this transition using the same experimental apparatus. As shown in Fig. 11(a), the end-point energy MeV obtained through the same procedure again agrees with the calculated value MeV, with only a slight difference in values. Due to the limited statistics, this analysis cannot be carried out for the remaining minor peaks at 5.0(3) and 3.8(1) MeV.
III.2.4 Transition strengths in the 1n channel
As mentioned above, the 17B decay in the 1n channel is 100%, followed by the successive -n emission in the decay of the daughter nucleus of 16C. Because in the 16C decay, the strength of the transition feeding the -n emission at is known to be 84.4(17)%, the total 1n decay strength of the 17B decay can be determined by
| (16) |
where is the count of the 0.82(1)-MeV peak obtained in the described -fitting analysis and and are the efficiency and the solid angle of the neutron counter array for the 0.82(1)-MeV neutron. The values of were evaluated based on Ref. CEC79 , using experimental data obtained from the measurements separately conducted with 17N and 15B beams, as described in Sec. II.2. Here, the of the -n at 1.17 MeV in the decay of 17N, which is close to 0.82(1) MeV, was determined with an accuracy of %. The same value was therefore adopted in the evaluation of for the 0.82(1)-MeV neutron as a systematic error. We thus obtained %, which agrees with the reported value % DUF88 , within the assigned error bounds.
However, for the other energies of observed -n, the accuracies of the obtained reference data were not sufficiently high. Therefore, the 1n transition strengths were determined by solving for the normalization factor in the following equation
| (17) |
where is the relative transition strength obtained with a relative value for each transition and 9.4% is the sum of the strengths of the 1n transitions that are finally followed by 1767(6) keV ray emissions, which were not included in the left-hand side in Eq. (17), with the exception of . The resultant values calculated using , as well as the values obtained by converting them to and (GT), are summarized in Table 3.
III.3 2n-decay and the higher-multiplicity channels
The 17B decay in the 2n-decay channel feeds states in 15C through the -2n emission. All 2n-decay branches are then followed by the decay of 15C ( 2.449(5) s ALB79_t15C ), where the 5290(12) keV ray is expected be emitted from the 1/2+ excited state at 5298.822(14) keV in 15N, with the branching ratio % AJ91 . The corresponding peak was observed at 5290(12) keV in the obtained Ge spectrum, as shown in Fig. 4(c), for which the deduced transition strength % is listed in Table 2. The total 2n-decay probability, , can then be determined as 12(2)%. It should be noted that this value agrees well with the value 11(7)% reported in Ref. DUF88 , within the assigned error bounds.
In the 2n channel, the ray observed at 743(2) keV in Fig. 4(a) can be assigned to the de-excitation ray from the 5/2+ first excited state at 740.0(15) keV AJ91 to the 1/2+ GS of 15C. This assignment was confirmed by observing that the time evolution of the photo-peak counts, shown in Fig. 6(e), can be well reproduced by . From the measured peak count, the sum of the strengths of the 17B -decay transitions connected to the keV state of 15C was determined to be %, as listed in Table 2. Since no lines of 15C, other than the one at 743(2) keV, were identified in the spectrum, we concluded that the 740.0(15)-keV state is directly connected to the two-neutron emission and that the GS of 15C is directly fed by the strength %. In order to construct the decay scheme of the 2n-decay channel, it is necessary to identify the sum energy of the two emitted neutrons. However, the obtained statistics provided no clear evidence of the 2n decay.
With respect to the 3n(4n)-decay branch, the -n emission from 17B feeds states in 14C(13C), for which the total transition probability is reported to be 3.5(7)% ( 0.4(3)%) DUF88 . Because the halflife of 14C is 5730 y and 13C is stable, the -decay cascade from 17B is almost stopped at the GSs. In the measurement, clear peaks were not found in the sum-energy spectra of neutrons with multiplicity 3 or 4 with the present statistics. Furthre, no -ray peaks were found at the energies associated with the de-excitation rays in 13C and 14C. Thus, both and were not determined in the present work.
III.4 Spin-parity assignment
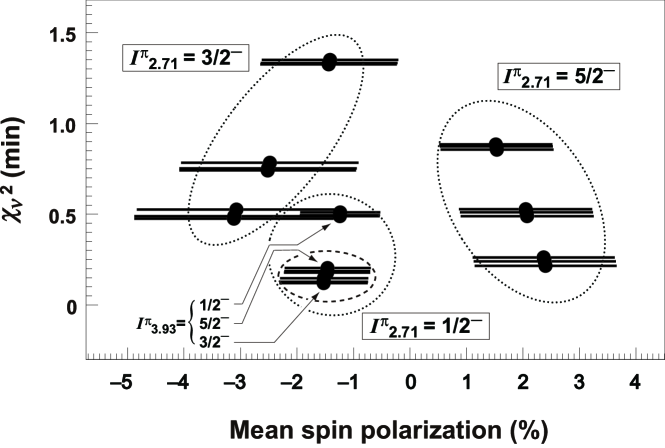
After obtaining the peak counts of the -n TOF spectra in the peak-decomposition analysis, values of the transition to 2.71(2), 3.93(2), and 4.05(2) MeV, for which two unassigned peaks were removed, were determined based on Eq. (4), and the values are listed in Table 3. In order to determine values, the least -variance method described in Sec. II.4 was applied to the obtained values. For all possible combinations of , , given by Eq. (12), were calculated together with the corresponding mean spin polarization , defined in Eq. (10). The resulting values are plotted as a function of in Fig. 12. The obtained values can be divided into three groups, as indicated by the dotted ellipses in Fig. 12: , , and %. This classification is based on the value of the 2.71(2)-MeV state owing to its highest statistics.
We first note that a negative spin polarization is expected for the 17B beam produced in the present experiment, based on the systematics observed with similar beam energies, targets, and projectile-ejectile combinations ASAHI ; OKUNO ; OGW02_17C ; HU17B ; 30AL32AL ; 17BQ ; 18N ; 1415BQ ; 1415B_MYU , for which the reaction proceeds through a far-side trajectory owing to the nuclear attractive force dominating the Coulomb repulsive force. Actually, the negative spin polarization of 15B, %, was observed with the same beam energies, targets, and projectile MIYA03 . Thus, the possibility of assigning to the 2.71(2)-MeV state can be eliminated owing to its positive polarization . Among the remaining two values, and , the former can be assigned using the obtained minimum analysis, although the possibility that can be assigned is not possible to completely ignore.
After we assigned to the 2.71(2)-MeV state, the combinations could be further divided into two groups: (i) and (ii) or assignments for the 3.93(2)-MeV state. The values of the first group are in the range of , whereas the second group has a smaller . We thus assigned to the 3.93(2)-MeV state. However, no further selection was performed, because the differences among the six combinations in the second group were extremely small. The assignment completed in this analysis is listed in Table 3, together with the asymmetry parameters calculated from the expected polarization 1.5(8) and given by the minimum set.
IV Discussion
IV.1 Further investigation for assignments
The obtained level structure of 17C was further investigated for comparison with the decays of 13B and 15B. The several negative-parity states in 13C (15C), connected with the decay of 13B (15B), are illustrated in Fig. 14, where relative strengths calculated from the reported values AJ91 are indicated by the line thickness, assuming that Fermi transition strengths are negligibly small owing to the large difference between their energies and values. In the decay of 13B, the transition strength is concentrated at the -decay branch leading to the GS of 13C, whose branching ratio is 92.1%. Including the second strongest branch with the strength 7.6%, leading to the excited state at 3684.507(19) keV, the sum of the 13B -decay transitions exhausts 100% of the total transition strength. Because the main GS configuration of 13B can be described by , given the well-established neutron magic number , the transition to the GS can be described by the single-particle GT transition , under the reasonable assumption of a configuration to the state. Then, the concentration of the transition strength to the state can be understood taking this pure single -particle state to the state, because the GT transition can only populate this configuration from the 13B GS. A similar observation applies to the 15B decay, in which the lowest negative-parity state at MeV AJ91 in 15C, which has been assigned to HAR99_15B ; MIYA03 , is fed through the strongest GT transition. Assuming a weak coupling of the 13B GS with the two valence neutrons in the orbit, the 15B GS can be written as . Then, the observed analogous characteristics of the GT transitions in the decays of 13B and 15B can be understood, provided a major contribution of the GT transition from 15B to the lowest state in 15C is largely governed by the transition in the 13B GS, where the two neutrons are kept in the orbit to couple to form . For detailed discussions, such as those on the inversion of the and states in 15C, effects of the - cross-shell interactions need to be taken into account. The same rule can be applied to the 17B decay, because the main configuration of the 17B GS should be given by . Then, the strongest GT transition can be characterized by in the 13B GS, and the final state is described by , which would be the lowest negative-parity state. Factually, among the observed -decay transitions from 17B, the strongest transition % is the branch to the MeV state in 17C, to which has been assigned in the present analysis. The relative strengths of the 17B decay are also shown in Fig. 14 in a similar manner as for 13C and 15C.
The decay branch to the state is the second strongest transition in both the decays of 13B and 15B, although the ordering of and differs for 13C and 15C due to the appearance of the - cross-shell interactions in 15C. These transitions are considered to be related to the single particle GT transition , which results in the -hole configurations in the daughter nuclei 13C and 15C. Similary to the above case, the GT transition can uniquely populate the single -hole state, suggesting its large transition strength. The same single-particle GT transition can also occur in the 17B decay. The gap energy between the - and -hole states should be comparable in both 15C and 17C, provided the spin-orbit splitting remains relatively unchanged. From this viewpoint, can be assigned to the 3.93(2)-MeV state in 17C, because the energy difference MeV between the 3.93(2)-MeV state and 2.71(2)-MeV state in 17C is comparable to 1.55 MeV, which is the difference between the and states in 15C, and also because the second strongest value was obtained for the transition to the 3.93(2)-MeV state. It should be noted that this assignment agrees with the assignment in the present analysis.
We may assign to the 4.05(2)-MeV state, which is a neighboring partner state to the 3.93(2)-MeV state, by taking into account the similarity of the level structure in this case to that of 15C, although we cannot disregard the fact that there are three possible candidates in the analysis. The obtained value for the transition to the 4.05(2)-MeV state is not sufficiently small to be definitely assigned to the GT transition. However, values to the corresponding states at 7.547 and 4.220 MeV in 13C and 15C are also as large as 5.33(10) AJ91 and 5.09(9) HAR99_15B , respectively, indicating the similarity among their transitions strengths. As investigated in the above, the GT transition uniquely populate the state having single -particle (-hole) state properties, which causes the concentration of transition strengths. However, the state cannot be formed by an unpaired particle or hole in the - shell unlike the and states. It should be a mixed configuration such as , which prevents the concentration of the transition strength. Moreover, the GT transition , which can populate these configurations, can also populate the states up to , further fragments the transition strength. Thus, the assignment to the 4.05(2)-MeV state seems reasonable, although further experimental observations are necessary for a definite assignment.
Including the above mentioned assignment, results obtained in the present work for the 17B decay are shown in Fig. 13 as the decay scheme.
IV.2 Comparison with shell-model calculations
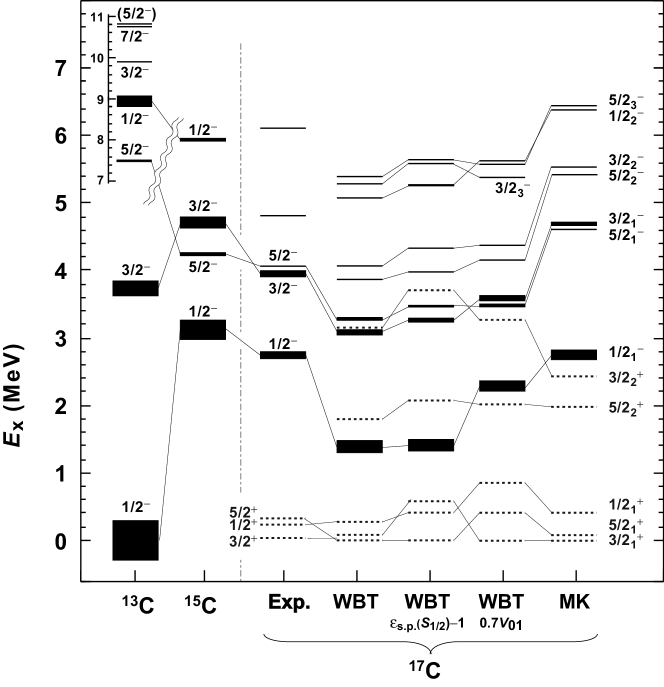
In Fig. 14, the data of the excited states of 17C observed in the present study are compared with the results of shell-model calculations OXBASH with two different sets of effective interactions, PSDWBT WBP and PSDMK MK , denoted by WBT and MK, respectively.
With respect to the low-lying positive-parity states, the GS has been experimentally assigned to BAU98 ; BAZ98 ; SAU00 ; MAD01 ; SAT08 ; SCH95 ; OGW02_17C , and the 210-keV and 331-keV states have been assigned to and ELE05 ; KON09_17C ; SUZ08_17C . Here, we assumed that the excited state at keV and the observed 217(2)-keV state are identical. The shell-model calculations predict the existence of three positive-parity states, , , and , below the neutron separation energy MeV. However, their ordering changes, depending on the choice of effective interactions. For the value of the GS, the MK interaction predicts the correctly, whereas the WBT interaction predicts . The experimental and theoretical positive-parity states in 17C are indicated by dashed lines in Fig. 14. We note that the experimentally determined ordering of and is inverted both in the MK and WBT calculations.
Next, the observed negative-parity states were compared. As expected from the above comparison for positive-parity states, the state is predicted as the lowest negative-parity state in 17C according to both the WBT and MK interactions, which thus supports the assignment of to the MeV state. The energy for this state, predicted using the MK interaction, agrees well with the observation, while it is 1 MeV lower when determined using the WBT interaction. For the next two states at 3.93(2) and 4.05(2) MeV, and were respectively assigned herein. The energy gap of their centroid, whose displacement is only 110 keV from the GS, is 6.0 MeV. Such a pair of neighboring states are also predicted using both the MK and WBT interactions. The MK interaction predicts the and states at 4.62 and 4.69 MeV, respectively, for which the centroid is 0.7 MeV higher than in the experimental observation. In contrast, the ordering is inverted in the WBT calculation, where the and states are predicted at 3.09 and 3.26 MeV, respectively. In this case, the centroid is lower by 0.8 MeV in the direction opposite to that observed in the MK interaction. If we calculate for them using the state instead of the predicted GS, the difference is found to be 0.9 MeV. Thus, the WBT interaction based calculation systematically predicts 1 MeV lower energies for all the low-lying negative-parity states.
In the light mass region, the phenomena of reduction in the single particle energy of the state are known to occur for TAL60 and SUZ94_S12N9 nuclei. However, the 1 MeV discrepancy due to the tendency of the energies of negative-parity states in 17C to be calculated as lower with the WBT interaction cannot be corrected by lowering the single particle energy. The 17C energy levels calculated by reducing the original single particle energy to MeV are also shown in Fig. 14. This modification changes the energies of the positive-parity states, and in particular, the ordering of the low-lying states, while it does not affect the energies of the negative-parity states. In fact, the energy displacement from the state is further lowered, and hence, the discrepancy from the experimental observation is rather exacerbated.
A further investigation was performed with the WBT interaction. In this study, the WBT calculation was performed, with the values reduced by 30%, for the neutrons, and herein, denotes a diagonal matrix element of a two-body effective interaction in a channel with angular momentum and isospin for particles within the orbits. The diminished pairing energy is attributed to the following three reasons. First, systematic over-binding occurs for the even mass-number C isotopes 16C, 18C, and 20C with the WBP interaction WBP , as reported in the study of binding energies for the neutron-rich C isotopes BAZ95 . Second, the weakening of the coupling between excess neutrons and the core in nuclei away from the stability line causes pairing energies to be modified. A significant amount of theoretical values of the two neutrons in the shell are originated from the renormalization of the two-body interaction due to the polarization of the core GEBROWN . Finally, it was shown in the study of the GS magnetic-moment measurement of 17B HU17B that the use of the pairing energy reduced by 30% improves agreements of the experimental and theoretical magnetic moments as well as low-lying state energies of neighboring neutron-rich nuclei. In the state structure calculated with the values, shown in Fig. 14, the energy gap between the GS and the state becomes as wide as in the experimental observation. Furthermore, the GS described by was correctly reproduced. The ordering of the other low-lying positive-parity states and is, however, inverted from the experimental observation in the calculations with both WBT () and MK interactions.
V Summary
By virture of the large window, excited states in 17C were effectively investigated through the measurement of -n and rays emitted in the decay of 17B. In the measurement, three negative-parity states and two inconclusive states, were identified above the neutron threshold energy in the 1n channel of the 17B decay. Further, two positive-parity states below the threshold were also observed. For the transitions, experimental values were determined. We note that in the 1n-channel, the 1767(6)-keV ray from the first excited state of 16C was observed in coincidence with the emitted -n, which changes the reported -decay scheme of 17B and level structure of 17C. Apart from the 1767(6)-keV lines, several de-excitation lines connected after the -n emission were identified. In the present work, the -NMR technique was combined with the -delayed particle measurements using a fragmentation-induced spin-polarized 17B beam. This new scheme allowed us to determine the spin parity of -decay feeding excited states based on the difference in the -decay asymmetry parameter, which took three discrete values depending on the final state spin for a common initial spin, if the states are connected through the GT transition. As a result, , , and () have been assigned to the observed states at 2.71(2), 3.93(2), and 4.05(2) MeV in 17C, respectively. The observed gap energy between low-lying positive and negative-parity states is 12 MeV larger than that predicted by the shell-model calculation with the WBT interaction. This discrepancy can be reduced by assuming that the pairing energy for neutrons in the shell of a neutron-rich nucleus diminishes by about 30%, although it cannot be resolved by reducing the single-particle energy.
Acknowledgments
The authors are grateful to the staffs at the RIKEN Ring Cyclotron for their support during the execution of the experiments. This work was supported in part by a Grant-in-Aid for Scientific Research from the Ministry of Education, Science, Sports and Culture. The experiment was performed at RIKEN under the Experimental Program R206n(5B).
References
- (1) L. Talmi and L. Una, Phys. Rev. Lett. 4, 469 (1960).
- (2) T. Suzuki and T. Otsuka, Phys. Rev. C 50, R555 (1994).
- (3) T. Baumann, M.J.G. Borge, H. Geissel, H. Lenske, K. Markenroth, W. Schwab, M.H. Smedberg, T. Aumann, L. Axelsson, U. Bergmann, D. Cortina-Gil, L. Fraile, M. Hellstrom, M. Ivanov, N. Iwasa, R. Janik, B. Jonson, G. Munzenberg, F. Nickel, T. Nilsson, A. Ozawa, A. Richter, K. Riisager, C. Scheidenberger, G. Schrieder, H. Simon, B. Sitar, P. Strmen, K. Summerer, T. Suzuki, M. Winkler, H. Wollnik, M.V. Zhukov, Phys. Lett. B439B, 256 (1998).
- (4) D. Bazin, W. Benenson, B.A. Brown, J. Brown, B. Davids, M. Fauerbach, P.G. Hansen, P. Mantica, D.J. Morrissey, C.F. Powell, B.M. Sherrill, and M. Steiner, Phys. Rev. C 57, 2156 (1998).
- (5) E. Sauvan, F. Carstoiu, N.A. Orr, J.C. Angelique, W.N. Catford, N.M. Clarke, M. Mac Cormick, N. Curtis, M. Freer, S. Grevy, C.Le Brun, M. Lewitowicz, E. Liegard, F.M. Marques, P. Roussel-Chomaz, M.G. Saint Laurent, M. Shawcross, J.S. Winfield, Phys. Lett. B491, 1 (2000).
- (6) V. Maddalena, T. Aumann, D. Bazin, B.A. Brown, J.A. Caggiano, B. Davids, T. Glasmacher, P.G. Hansen, R.W. Ibbotson, A. Navin, B.V. Pritychenko, H. Scheit, B.M. Sherrill, M. Steiner, J.A. Tostevin, and J. Yurkon, Phys. Rev. C 63, 024613 (2001).
- (7) Y. Satou, T. Nakamura, N. Fukuda, T. Sugimoto, Y. Kondo, N. Matsui, Y. Hashimoto, T. Nakabayashi, T. Okumura, M. Shinohara, T. Motobayashi, Y. Yanagisawa, N. Aoi, S. Takeuchi, T. Gomi, Y. Togano, S. Kawai, H. Sakurai, H.J. Ong, T.K. Onishi, S. Shimoura, M. Tamaki, T. Kobayashi, H. Otsu, Y. Matsuda, N. Endo, M. Kitayama, M. Ishihara, Phys. Lett. B660, 320 (2008).
- (8) K.W. Scheller, J. Gorres, S. Vouzoukas, M. Wiescher, B. Pfeiffer, K.-L. Kratz, D.J. Morrissey, B.M. Sherrill, M. Steiner, M. Hellstrom, J.A. Winger, Nucl. Phys. A582, 109 (1995).
- (9) H. Ogawa, K. Asahi, H. Ueno, K. Sakai, H. Miyoshi, D. Kameda, T. Suzuki, H. Izumi, N. Imai, Y.X. Watanabe, K. Yoneda, N. Fukuda, H. Watanabe, A. Yoshimi, W. Sato, N. Aoi, M. Nagakura, T. Suga, K. Yogo, A. Goto, T. Honda, Y. Kobayashi, W.-D. Schmidt-Ott, G. Neyens, S. Teughels, A. Yoshida, T. Kubo, M. Ishihara, Eur. Phys. J. A 13, 81 (2002).
- (10) T. Nakamura, N. Fukuda, T. Kobayashi, N. Aoi, H. Iwasaki, T. Kubo, A. Mengoni, M. Notani, H. Otsu, H. Sakurai, S. Shimoura, T. Teranishi, Y.X. Watanabe, K. Yoneda, M. Ishihara, Phys. Rev. Lett. 83, 1112 (1999).
- (11) D. Bazin, B.A. Brown, J. Brown, M. Fauerbach, M. Hellstrom, S.E. Hirzebruch, J.H. Kelley, R.A. Kryger, D.J. Morrissey, R. Pfaff, C.F. Powell, B.M. Sherrill, M. Thoennessen, Phy. Rev. Lett. 74, 3569 (1995).
- (12) G. Audi, O. Bersillon, J. Blachot, A.H. Wapstra, Nucl. Phys. A624, 1 (1997).
- (13) J.A. Nolen, T.S. Bhatia, H. Hafner, P. Doll, C.A. Wiedner, G.J. Wagner, Phys Lett. B71, 314 (1977).
- (14) L.K. Fifield, J.L. Durell, M.A.C. Hotchkis, J.R. Leigh, T.R. Ophel, D.C. Weisser, Nucl. Phys. A385, 505 (1982).
- (15) R. Kanungo, Z. Elekes, H. Baba, Zs. Dombrádi, Zs. Fülöp, J. Gibelin, Á. Horváth, Y. Ichikawa, E. Ideguchi, N. Iwasa, H. Iwasaki, S. Kawai, Y. Kondo, T. Motobayashi, M. Notani, T. Ohnishi, A. Ozawa, H. Sakurai, S. Shimoura, E. Takeshit, S. Takeuchi, I. Tanihata, Y. Togano, C. Wu, Y. Yamaguchi, Y. Yanagisaw, A. Yoshida, K. Yoshida, Nucl. Phys. A757, 315 (2005).
- (16) M. Stanoiu , F. Azaiez, F. Becker, M. Belleguic, C. Borcea, C. Bourgeois, B.A. Brown, Z. Dlouhy, Z. Dombradi, Z. Fulop, H. Grawe, S. Grevy, F. Ibrahim, A. Kerek, A. Krasznahorkay, M. Lewitowicz, S. Lukyanov, H. van der Marel, P. Mayet, J. Mrazek, S. Mandal, D. Guillemaud-Mueller, F. Negoita, Y.E. Penionzhkevich, Z. Podolyak, P. Roussel-Chomaz, M.G. Saint Laurent, H. Savajols, O. Sorlin, G. Sletten, D. Sohler, J. Timar, C. Timis, A. Yamamoto, Eur. Phys. J. A 20, 95 (2004).
- (17) Z. Elekes, Zs. Dombradi, R. Kanungo, H. Baba, Zs. Fulop, J. Gibelin, A. Horvath, E. Ideguchi, Y. Ichikawa, N. Iwasa, H. Iwasaki, S. Kanno, S. Kawai, Y. Kondo, T. Motobayashi, M. Notani, T. Ohnishi, A. Ozawa, H. Sakurai, S. Shimoura, E. Takeshita, S. Takeuchi, I. Tanihata, Y. Togano, C. Wu, Y. Yamaguchi, Y. Yanagisawa, A. Yoshida, K. Yoshida, Phys. Lett. B614, 174 (2005).
- (18) Y. Kondo, T. Nakamura, Y. Satou, T. Matsumoto, N. Aoi, N. Endo, N. Fukuda, T. Gomi, Y. Hashimoto, M. Ishihara, S. Kawai, M. Kitayama, T. Kobayashi, Y. Matsuda,3 N. Matsui, T. Motobayashi, T. Nakabayashi, K. Ogata, T. Okumura, H.J. Ong, T.K. Onishi, H. Otsu, H. Sakurai, S. Shimoura, M. Shinohara, T. Sugimoto, S. Takeuchi, M. Tamaki, Y. Togano, and Y. Yanagisawa, Phys. Rev. C 79, 014602 (2009).
- (19) D. Suzuki, H. Iwasaki, H.J. Onga, N. Imai, H. Sakurai, T. Nakao, N. Aoi, H. Baba, S. Bishop, Y. Ichikawa, M. Ishihara, Y. Kondoc, T. Kubob, K. Kurita, T. Motobayashi, T. Nakamura, T. Okumura, T.K. Onishi, S. Ota, M.K. Suzuki, S. Takeuchi, Y. Toganod, Y. Yanagisawa, Phys. Lett. B666, 222, (2008).
- (20) H.G. Bohlen, R. Kalpakchieva, W. von Oertzen, T.N. Massey, B. Gebauer, T. Kokalova, A.A. Ogloblin, Ch. Schulz, S. Thummerer, Nucl. Phys. A738, 333 (2004).
- (21) E.K. Warburton and D.J. Millener, Phys. Rev. C 39, 1120 (1989).
- (22) R. Harkewicz, D.J. Morrissey, B.A. Brown, J.A. Nolen, Jr., N.A. Orr, B.M. Sherrill, J.S. Winfield, J.A. Winger, Phys. Rev. C 44, 2365 (1991).
- (23) K.W. Scheller, J. Görres, J.G. Ross, M. Wiescher, R. Harkewicz, D.J. Morrissey, B.M. Sherrill, M. Steiner, N.A. Orr, J.A. Winger, Phys. Rev C 49, 46 (1994).
- (24) G. Raimann, A. Ozawa, R.N. Boyd, F.R. Chloupek, M. Fujimaki, K. Kimura, T. Kobayashi, J.J. Kolata, S. Kubono, I. Tanihata, Y. Watanabe, and K. Yoshida, Phys. Rev C 53, 453 (1996).
- (25) N. Aoi, K. Yoneda, E. Ideguchi, T. Kishida, T. Nakamura, M. Notani, H. Sakurai, T. Teranishi, Y. Watanabe, H. Wu, A. Yoshida, H. Miyatake, Y. Yamamoto, H. Ogawa, S.S. Yamamoto, M. Ishihara, Phys. Rev. C 66, 014301 (2002).
- (26) K. Asahi, M. Ishihara, N. Inabe, T. Ichihara, T. Kubo, M. Adachi, H. Takahashi, M. Kouguchi, M. Fukuda, D. Mikolas, D.J. Morrissey, D. Beaumel, T. Shimoda, H. Miyatake, and N. Takahashi, Phys. Lett. B251, 488 (1990).
- (27) H. Okuno, K. Asahi, H. Sato, H. Ueno, J. Kura, M. Adachi, T. Nakamura, T. Kubo, N. Inabe, A. Yoshida, T. Ichihara, Y. Kobayashi, Y. Ohkubo, M. Iwamoto, F. Ambe, T. Shimoda, H. Miyatake, N. Takahashi, J. Nakamura, D. Beaumel, D.J. Morrissey, W.-D. Schmidt-Ott, and M. Ishihara, Phys. Lett. B335, 29 (1994).
- (28) H. Miyatake, H. Ueno, Y. Yamamoto, N. Aoi, K. Asahi, E. Ideguchi, M. Ishihara, H. Izumi, T. Kishida, T. Kishida, T. Kubo, S. Mitsuoka, Y. Mizoi, M. Notani, H. Ogawa, A. Ozawa, M. Sasaki, T. Shimoda, T. Shirakura, N. Takahashi, S. Tanimoto, K. Yoneda, Phys. Rev. C 67, 014306 (2003).
- (29) Y. Hirayama, T. Shimoda, H. Izumi, A. Hatakeyama, K.P. Jackson, C.D.P. Levy, H. Miyatake, M. Yagi, H. Yano, Phys. Lett. B611, 239 (2005).
- (30) K. Kura, K. Tajiri, T. Shimoda, A. Odahara, T. Hori, M. Kazato, T. Masue, M. Suga, A. Takashima, T. Suzuki, T. Fukuchi, Y. Hirayama, N. Imai, H. Miyatake, M. Pearson, C.D.P. Levy, K.P. Jackson, Phys. Rev. C 85, 034310 (2012).
- (31) H. Ueno, K. Asahi, H. Izumi, K. Nagata, H. Ogawa, A. Yoshimi, H. Sato, M. Adachi, Y. Hori, K. Mochinaga, H. Okuno, N. Aoi, M. Ishihara, A. Yoshida, G. Liu, T. Kubo, N. Fukunishi, T. Shimoda, H. Miyatake, M. Sasaki, T. Shirakura, N. Takahashi, S. Mitsuoka, W.-D. Schmidt-Ott, Phys. Rev. C 53, 2142 (1996).
- (32) T. Kubo, M. Ishihara, N. Inabe, H. Kumagai, I. Tanihata, K. Yoshida, T. Nakamura, H. Okuno, S. Shimoura, and K. Asahi, Nucl. Instrum. Methods B 70, 309 (1992).
- (33) K. Sugimoto, A. Mizouchi, K. Nakai and K. Matsuta, J. Phys. Soc. Japan 21, 213 (1966).
- (34) H. Ohm, W. Rudolph, and K.-L. Kratz, Nucl. Phys. A274, 45 (1976).
- (35) R.A. Cecil, B.D. Anderson, and R. Madey, Nucl. Instrum. Methods Phys. Res. 161, 439 (1979).
- (36) P.M. Jones, L. Wei, F.A. Beck, P.A. Butler, T. Byrski, G. Duchêne, G. de France, F. Hannachi, G.D. Jones and B. Kharraja, Nucl. Instrum. Methods A 362, 556 (1995).
- (37) HAMATSU H6614-01
- (38) A. Abragam, The Principle of Nuclear Magnetism, (Clarendon, Oxford, 1961).
- (39) J.P. Dufour, R.Del Moral, F. Hubert, D. Jean, M.S. Pravikoff, A. Fleury, A.C. Mueller, K.-H. Schmidt, K. Summerer, E. Hanelt, J. Frehaut, M. Beau, G. Giraudet, Phys. Lett. B206, 195 (1988).
- (40) P.L. Reeder, R.A. Warner, W.K. Hensley, D.J. Vieira, J.M. Wouters, Phys. Rev. C 44, 1435 (1991).
- (41) R. Brun, F. Carminati, CERN Application Software Group, geant3.2, CERN Program Library Writeup Report No. W5013 (1994).
- (42) D.R. Tilley, Nucl. Phys. A565, 1 (1993).
- (43) D.E. Alburger and D.J. Millener, Phys. Rev. C 20, 1891 (1979).
- (44) F. Ajzenberg-Selove, Nucl. Phys. A523, 1 (1991).
- (45) H. Ueno, D. Kameda, G. Kijima, K. Asahi, A. Yoshimi, H. Miyoshi, K. Shimada, G. Kato, D. Nagae, S. Emori, T. Haseyama, H. Watanabe, M. Tsukui, Phys. Lett. B 615, 186 (2005).
- (46) H. Ogawa, K. Asahi, K. Sakai, T. Suzuki, H. Izumi, H. Miyoshi, M. Nagakura, K. Yogo, A. Goto, T. Suga, T. Honda, H. Ueno, Y. X. Watanabe, K. Yoneda, A. Yoshimi, N. Fukuda, Y. Kobayashi, A. Yoshida, T. Kubo, M. Ishihara, N. Imai, N. Aoi, W.-D. Schmidt-Ott, G. Neyens, S. Teughels, Phys. Rev. C 67, 064308 (2003).
- (47) H. Ogawa, K. Asahi, K. Sakai, A. Yoshimi, M. Tsuda, Y. Uchiyama, T. Suzuki, K. Suzuki, N. Kurokawa, M. Adachi, H. Izumi, H. Ueno, T. Shimoda, S. Tanimoto, N. Takahashi, W. -D. Schmidt-Ott, M. Schafer, S. Fukuda, A. Yoshida, M. Notani, T. Kubo, H. Okuno, H. Sato, N. Aoi, K. Yoneda, H. Iwasaki, N. Fukuda, N. Fukunishi, M. Ishihara, H. Miyatake, Phys. Lett. B451, 11 (1999).
- (48) H. Izumi, K. Asahi, H. Ueno, H. Okuno, H. Sato, K. Nagata, Y. Hori, M. Adachi, N. Aoi, A. Yoshida, G. Liu, N. Fukunishi, M. Ishihara, Phys. Lett. B366, 51 (1996).
- (49) H. Okuno, K. Asahi, H. Ueno, H. Izumi, H. Sato, M. Adachi, T. Nakamura, T. Kubo, N. Inabe, A. Yoshida, N. Fukunishi, T. Shimoda, H. Miyatake, N. Takahashi, W.-D. Schmidt-Ott, M. Ishihara, Phys. Lett. B354, 41 (1995).
- (50) B.A. Brown, A. Etchegoyen, and W.D.M. Rae, OXBASH, MSU Cyclotron Laboratory Report No. 524 (1986).
- (51) E.K. Warburton and B.A. Brown, Phys. Rev. C 46, 923 (1992).
- (52) D.J. Millener and D. Kurath, Nucl. Phys. A255, 315 (1975).
- (53) T.T.S. Kuo and G.E. Brown, Nucl. Phys. 85, 40 (1966).
| no | 17N | 17B | possible background | |||||
|---|---|---|---|---|---|---|---|---|
| (keV) | beam | - | - | sources | (keV) | |||
| 67(1) |
|
|||||||
| 77(2) |
|
|||||||
| 88(2) | (Pb) | 87.3 | ||||||
| 217(2) | (228Ac) | (216.0) | ||||||
| 242(1) |
|
|||||||
| 295(2) | (214Pb) | (295.2) | ||||||
| 331(2) | (228Ac) | (328.0) | ||||||
| 352(1) | 214Pb | 351.9 | ||||||
| 511(2) | annihilation | 511.0 | ||||||
| 596(5) | 596.4 | |||||||
| 609(2) | 214Bi | 609.3 | ||||||
| 696(8) | 72Ge(n,n’) | 693 | ||||||
| (keV) | decay mode | emitter | (keV) | (17C) (keV) | (%) | (%) | |
|---|---|---|---|---|---|---|---|
| 217(2) | (0n) | 17C | 217(2) | 217(2) | 2.8(11) | 2.8(11) | 6.1(2) |
| 331(2) | (0n) | 17C | 331(2) | 331(2) | 2.1(2) | 2.1(2) | 6.22(5) |
| 740(2) | (2n) | 15C | 740.0(15) | not identified | 2.6(2) | 2.6(2) | |
| 1767(6) | (1n) | 16C | 1766(10) | 4050(20) | 9.4(3) | 7.2(4) | 5.29(3) |
| 1382(5) | (0n)-(17C) | 17N | 1373.8(3) | 5.9(6) | |||
| 1855(8) | (0n)-(17C) | 17N | 1849.5(3) | 4.5(6) | |||
| 2212(10) | (1n) | 16C | 3986(7) | not identified | 1.5(2) | 1.5(2) | |
| 2322(6) | (1n) | 16C | 4088(7) | not identified | 0.44(9) | 0.44(9) | |
| 2379(7) | (1n) | 16C | 4142(7) | not identified | 0.3(1) | 0.3(1) | |
| 5290(12) | (2n)-(15C) | 15N | 5298.822(14) | 7.5(11) |
| (MeV) | (MeV) | width (MeV) | (%) | (GT) | (%) | ( analysis) | (end result) | ||||
|---|---|---|---|---|---|---|---|---|---|---|---|
| 5.04(2) | 6.08(3) | 2.5(7) | 4(1) | 5.3(1) | 0.021(3) | ||||||
| 3.81(1) | 4.78(2) | 0.3(3) | 0.9(1) | 6.1(1) | 0.003(1) | ||||||
| 1.46(1) | 4.05(2) | 0.06(6) | 1.5(2) | 6.0(1) | 0.004(1) | 6(23) | 4(15) | (1-, 3-, 5-) | (5-) | ||
| 3.01(1) | 3.93(2) | 0.16(4) | 20(3) | 4.9(1) | 0.05(1) | 0.04(99) | (3-, 5-) | 3- | |||
| 1.86(1) | 2.71(2) | 0.04(1) | 33(4) | 4.8(1) | 0.07(1) | 1.6(8) | 1.0(5) |