Tunable Dirac Fermion Dynamics in Topological Insulators
Abstract
Three-dimensional topological insulators are characterized by insulating bulk state and metallic surface state involving Dirac fermions that behave as massless relativistic particles. These Dirac fermions are responsible for achieving a number of novel and exotic quantum phenomena in the topological insulators and for their potential applications in spintronics and quantum computations. It is thus essential to understand the electron dynamics of the Dirac fermions, i.e., how they interact with other electrons, phonons and disorders. Here we report super-high resolution angle-resolved photoemission studies on the Dirac fermion dynamics in the prototypical Bi2(Te,Se)3 topological insulators. We have directly revealed signatures of the electron-phonon coupling in these topological insulators and found that the electron-disorder interaction is the dominant factor in the scattering process. The Dirac fermion dynamics in Bi2(Te3-xSex) topological insulators can be tuned by varying the composition, x, or by controlling the charge carriers. Our findings provide crucial information in understanding the electron dynamics of the Dirac fermions in topological insulators and in engineering their surface state for fundamental studies and potential applications.
pacs:
74.70.-b, 74.25.Jb, 79.60.-i, 71.20.-bTopological insulators represent a new state of matter that has an insulating bulk state but a conducting surfaceedge state which hosts an unique spin texture and a linear dispersion relation compatible with massless Dirac fermionsRevMoore1 ; RevZSC ; RevHasan . In addition to their potential applications in spintronics and quantum computingRevQXL ; RevMoore2 , the topological insulators also provide a promising platform for realizing a number of novel and exotic quantum phenomena including quantum spin Hall effectSCZhangQSHEHgTe , fractional charge and quantized currentQXLFracCharge , dynamical axion fieldLRDAxion , magnetic monopoleQXLMonopole , Majorana fermionsFLMajorana ; FLTSCCuBiSe and quantum anomalous Hall effectYRQAHE . Some of the phenomena have been observed experimentally in two-dimensional topological insulators, such as quantum spin Hall effectMolenkampQSHEHgTe and quantum Hall effectMolenkampQHEHgTe in the HgTe quantum wellsSCZhangQSHEHgTe . However, in the case of three-dimensional topological insulators like Bi2(Te, Se)3 familyFL3DTIs ; ZhongFangBiSe ; HasanBiSeARPES ; YLChen , in spite of intensive efforts from transport experimentsOngQuanOsci ; ButchBiSeTransport ; AndoDiracHole ; FisherQuanLim ; Ando2DQO , attempts to observe electronic transport signatures of the surface Dirac fermions have been hampered by a couple of obstacles. First, contrary to usual expectation that the bulk is insulating in topological insulators, the presence of defects in Bi2(Te, Se)3 system makes the bulk conductingCavaPtypeBiSe and the transport properties are then dominated by the bulk state instead of the desired surface stateButchBiSeTransport . Second, in several cases where the surface transport signatures are identified, more than one frequency or one type of charge carriers contribute to the quantum oscillationAndoDiracHole ; FisherQuanLim ; Ando2DQO , indicating the complexity of sample surface exposed to atmosphere or protection layersXJZhouBiTeSeARPES . Third, the transport mobility of charge carriers in the Bi2(Te, Se)3 topological insulators, OngQuanOsci ; Ando2DQO ; FuhrerEPCTransport , is not sufficiently high compared to those from HgTe quantum wells() MolenkampQSHEHgTe ; MolenkampQHEHgTe and graphene() NovoselovGraphene ; KimGraphene ; StormerGraphene . Although strict electron backscattering is forbidden in topological insulators due to time reversal symmetry invariance, it is important to uncover other scattering channels that limit the transport mobility of the two-dimensional Dirac fermionsFuhrerEPCTransport .
The charge transport properties are dictated by the electron dynamics in materials. In particular, the scattering of electrons by other entities such as other electrons, phonons and disorder, determines the lifetime of the quasiparticles, and thus the electron mobility and mean free path in the transport processGrimvall . Angle-resolved photoemission spectroscopy (ARPES) has become a powerful tool to directly probe such many-body effectsRevDamascelli ; RevXJZhou . Under the sudden approximation, ARPES measures a single particle spectral function
| (1) |
with k and representing electron momentum and energy, respectively. The real and imaginary parts of electron self-energy, and , carry all the information about the band renormalization and quasiparticle lifetime in an interacting systemRevDamascelli ; RevXJZhou .
There have been a few investigations on the dynamics of Dirac fermions in Bi2(Te, Se)3 topological insulators using ARPESHofmannEPCEDS ; VallaWeakEPC or helium atom surface scattering probesBatanounyHASSEPC . However, the results obtained so far are not consistent. While the electron-phonon coupling strength () was reported to be 0.25 in Bi2Se3 from temperature-dependent photoemission measurementsHofmannEPCEDS , it was claimed that the electron-phonon coupling is exceptionally weak in Bi2Se3 in another measurementVallaWeakEPC . The inconsistency comes presumably from two issues related to the ARPES study on many-body effects in topological insulators. First, the coexistence of bulk bands and surface bands near the Fermi level, due to the bulk doping by defects, complicates the identification of weak band renormalization effects in the surface bands. Second, the small momentum space and energy window of the Dirac fermions and the weak many-body effects require high precision ARPES measurements. The momentum space occupied by the surface state, 0.1 for Bi2Se3 (Fig. 1A) and 0.04 for p-type Bi2Te3 (Fig. 2A), is rather small HasanBiSeARPES ; ZXShenBiTeARPES ; XJZhouBiTeSeARPES . To overcome these problems, it is ideal to first suppress the interference of the bulk bands in the measurements. Since the as-grown Bi2Se3 is electron-doped (n-type) while Bi2Te3 can be hole-doped (p-type)XJZhouBiTeSeARPES , balancing the proportion of selenium and tellurium in Bi2(Se,Te)3 system may neutralize the bulk carrier doping and reduce the effect of the bulk bands on the surface state. Furthermore, vacuum ultra-violet (VUV) laser-based ARPESXJZhouLaserARPES can help suppress the bulk bandsXJZhouBiTeSeARPES , in addition to its super-high energy and momentum resolutions (see Laser-ARPES measurements and Fig. S2 in Supplementary Materials) that are desirable in studying many-body effects in topological insulators.
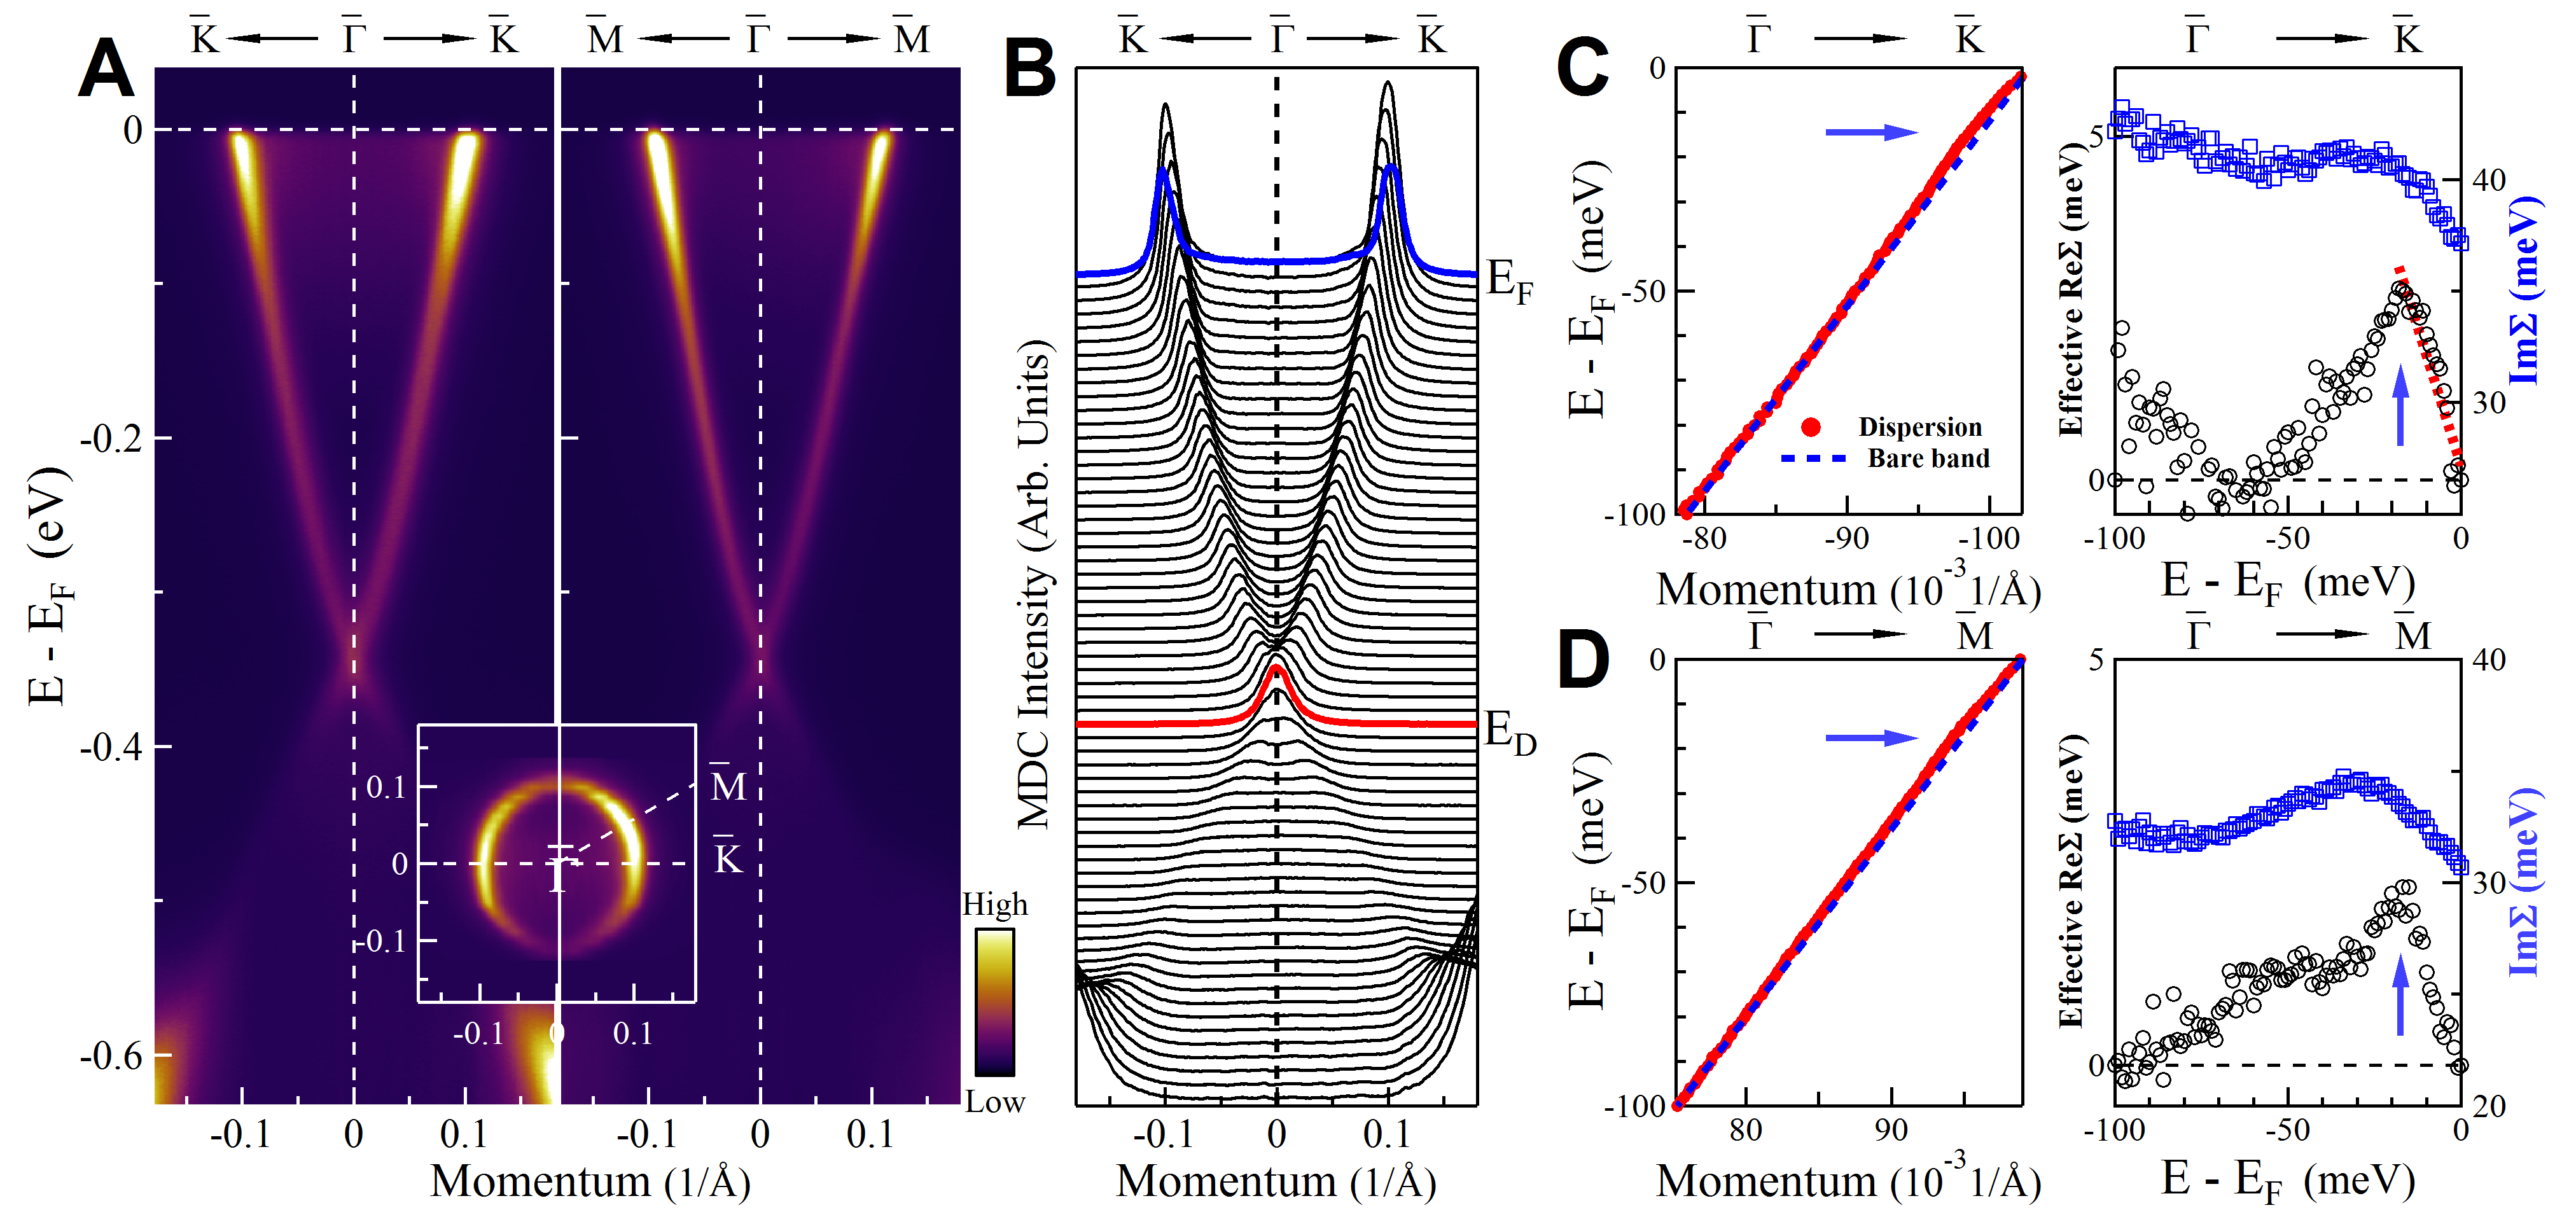
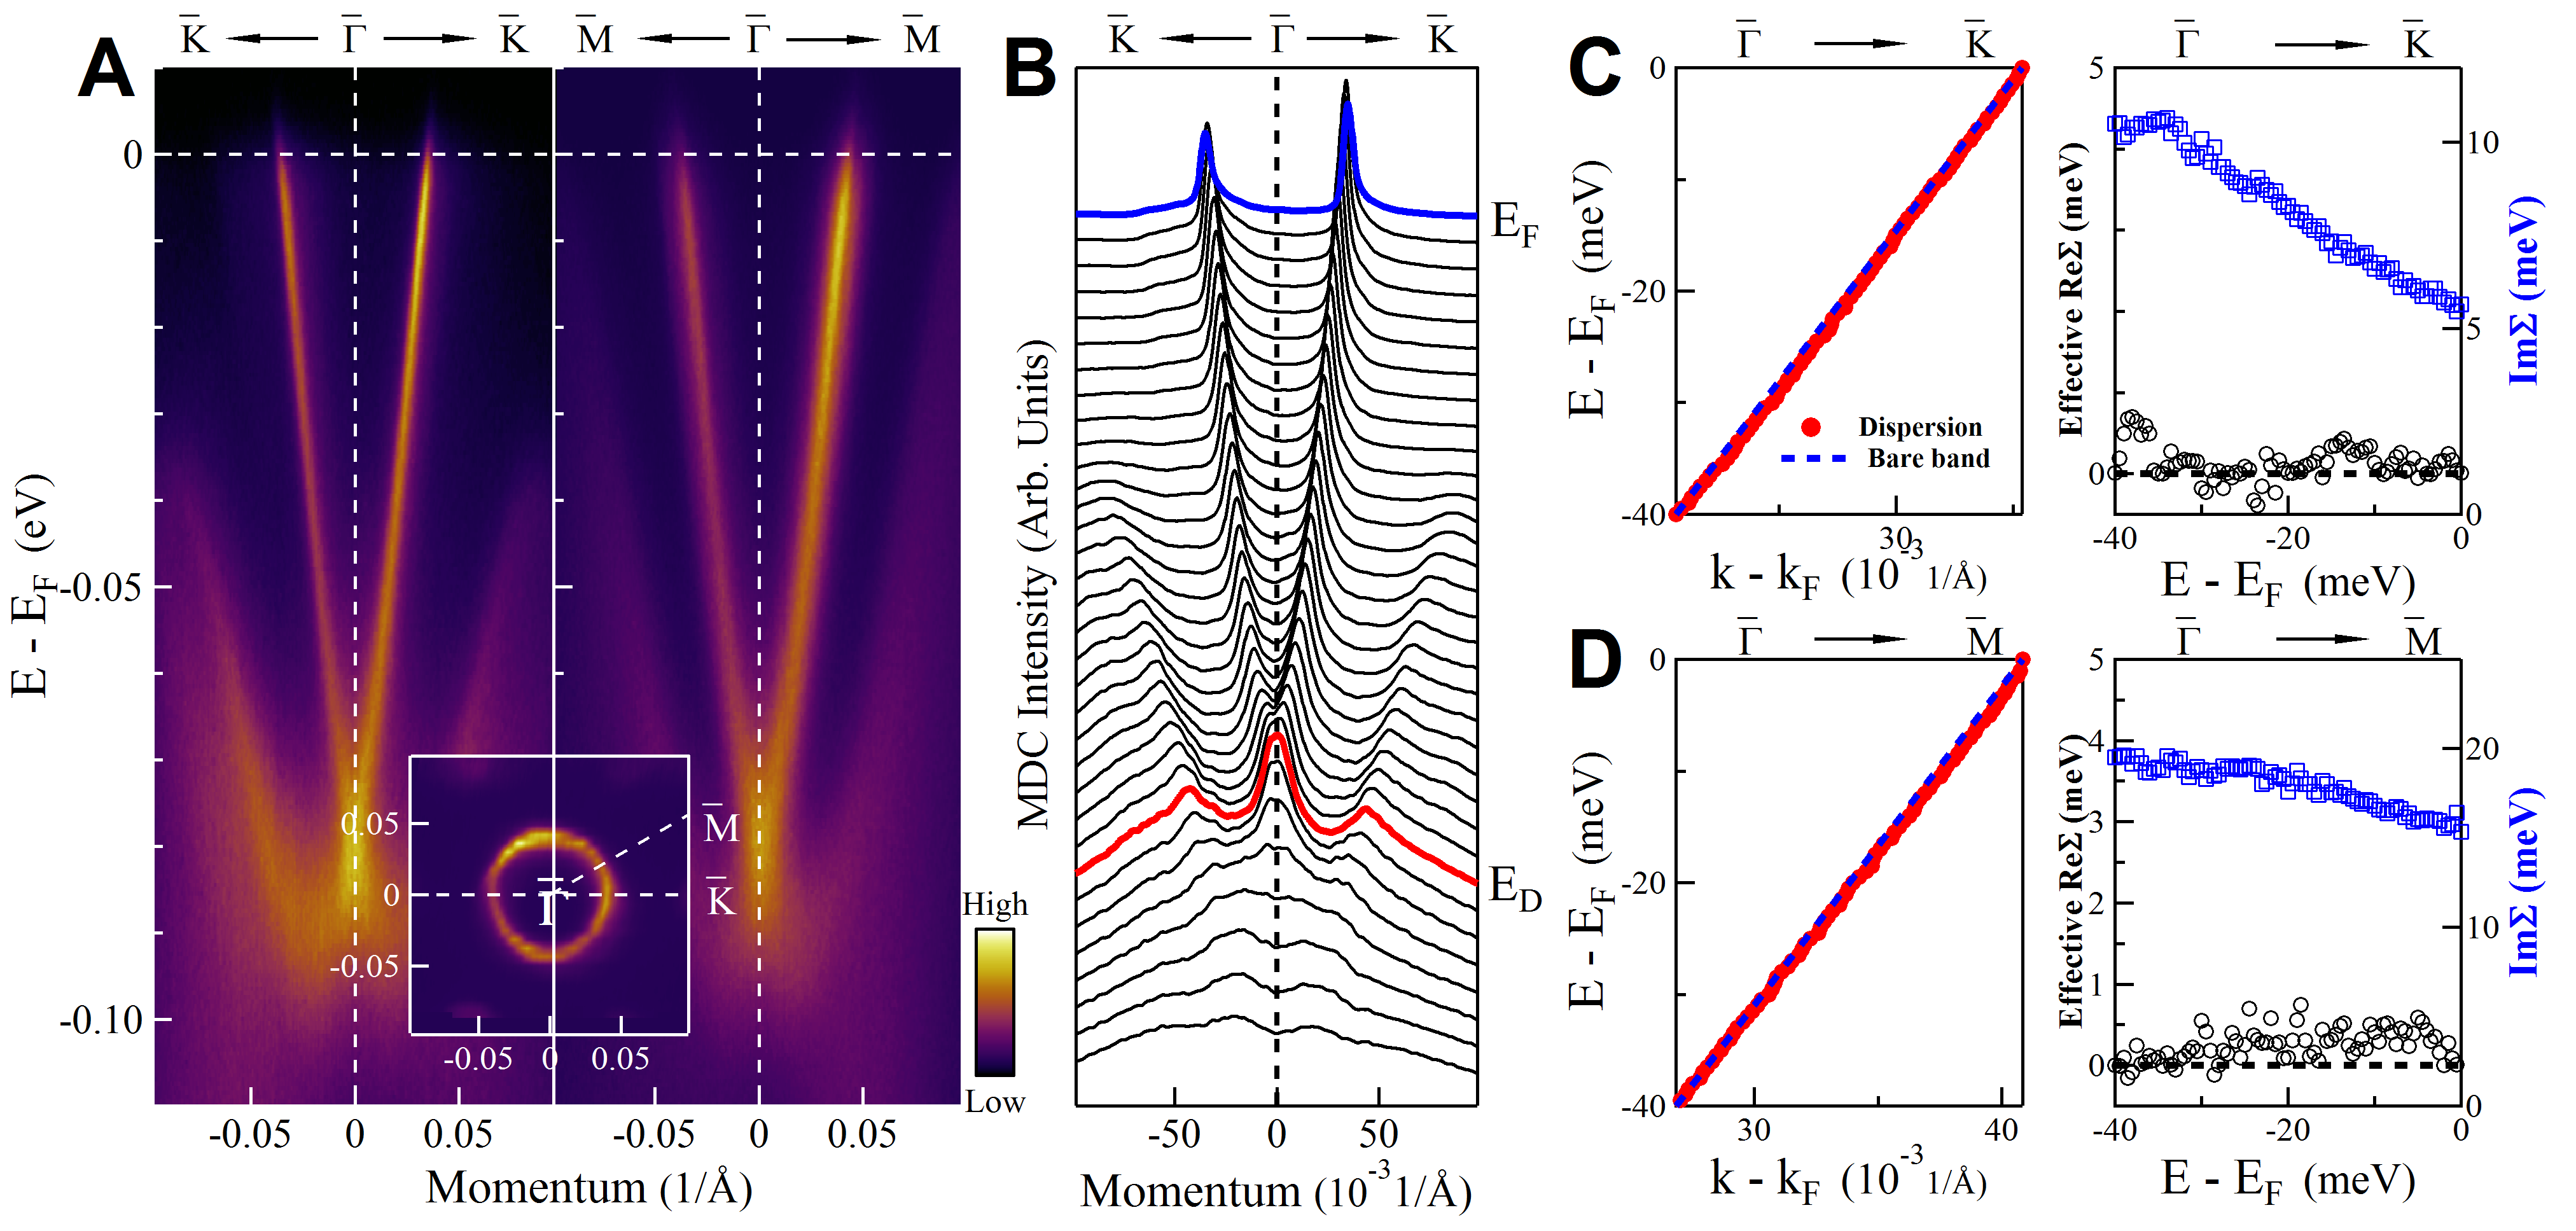
The Bi2Se3 sample shows sharp surface state band (Fig. 1A) that facilitates the investigation of the Dirac fermion dynamics in the material. The momentum distribution curves (MDCs) at different binding energies (Fig. 1B) show well-defined sharp peaks that can be fitted by Lorentzian lineshape to obtain peak position and peak width (Full-Width-at-Half-Maximum, ) (see Fig. S3 in Supplementary Materials). The obtained MDC peak position as a function of the binding energy gives the measured dispersion relation (left panels of Fig. 1C and 1D). We assume a bare band as a linear line that connects the two points on the measured dispersion, one at the Fermi level and the other at 100 meV binding energy. This is reasonable within such a small energy window and particularly for the Dirac fermions that shows a linear dispersion over a large energy range. The effective real part of the electron self-energy (Re) is obtained by subtracting the measured dispersion with the bare band, as shown in right panels of Fig. 1C and Fig. 1D (black empty circles). The imaginary part of the electron self-energy (Im) is obtained from the fitted MDC width: Im=2 with being the Fermi velocity of the bare band (right panels of Fig. 1C and Fig. 1D, blue empty squares)RevXJZhou .
The extraction of the electron self-energy provides full information for understanding the electron dynamics in a material where the electron scattering usually involves three main processes: electron-electron interaction, electron-phonon coupling, and electron-disorder interactionVallaMo ; JensenBe . The electron-disorder interaction is characterized by the imaginary part of the electron self-energy at zero energy (Fermi level) since the contribution from the electron-electron interaction and electron-phonon coupling approaches zero at the zero energy at very low temperature. The electron-phonon interaction is characterized by the band renormalization (usually a kink in dispersion, corresponding to a peak in the real part of the electron self-energy) and a drop in the imaginary part of the electron self-energy. As exemplified in Fig. 1 for Bi2Se3, there are clear indications of electron-phonon coupling revealed, such as the kink in dispersions (left panels of Fig. 1C and Fig. 1D), peak in the real part of the electron self-energy and a drop in the imaginary part of the electron self-energy (right panels of Fig. 1C and Fig. 1D). The characteristic energy scale of the phonons involved () is determined by the peak position of the real part of the electron self-energy; in the case of Bi2Se3, it is 18 meV as marked by arrows in Fig. 1C and 1D. The electron-phonon coupling strength, , can be determined by the slope of the line near the zero energy in the real part of the electron self-energy. As shown by red dashed line in the right panel of Fig. 1C, it is determined to be 0.17 for Bi2Se3. The electron-electron interaction manifests itself more clearly in the imaginary part of the electron self-energy. In a typical Fermi liquid case, its contribution is proportional to the (E-EF)2: Imee=(E-EF)2. Since the electron-phonon contribution is constant above the characteristic phonon scale, the deviation from the constant above the phonon scale gives a measure of the electron-electron interaction involved. For Bi2Se3 and the Bi2(Se,Te)3 series, we find that the electron-electron contribution is weak (0.014 for Bi2Se3), particularly when compared with the dominant electron-disorder interaction and the electron-phonon coupling. Therefore, in the following, we will mainly focus on the electron-phonon coupling and electron-disorder interaction.
As shown in Fig. 1, our measurements clearly indicate that there is an obvious electron-phonon coupling (0.17) in the electron dynamics of the Dirac fermions in Bi2Se3. It is nearly isotropic because similar behaviors are observed along the – (Fig. 1C) and – (Fig. 1D) momentum cuts. The characteristic energy scale, 18 meV, is consistent with the highest-frequency phonon mode () at 20 meV in Bi2Se3 from both theoretical calculationsWCPhononSpectrum and Raman measurementsBeckerRaman (see Fig. S7 in Supplementary Materials). This is in strong contrast to a recent report where exceptionally weak electron-phonon coupling was claimed and no dispersion kink was resolved in Bi2Se3VallaWeakEPC . We believe that the clear manifestation of electron-phonon coupling in our measurements is mainly due to much improved instrumental resolution we have achieved.
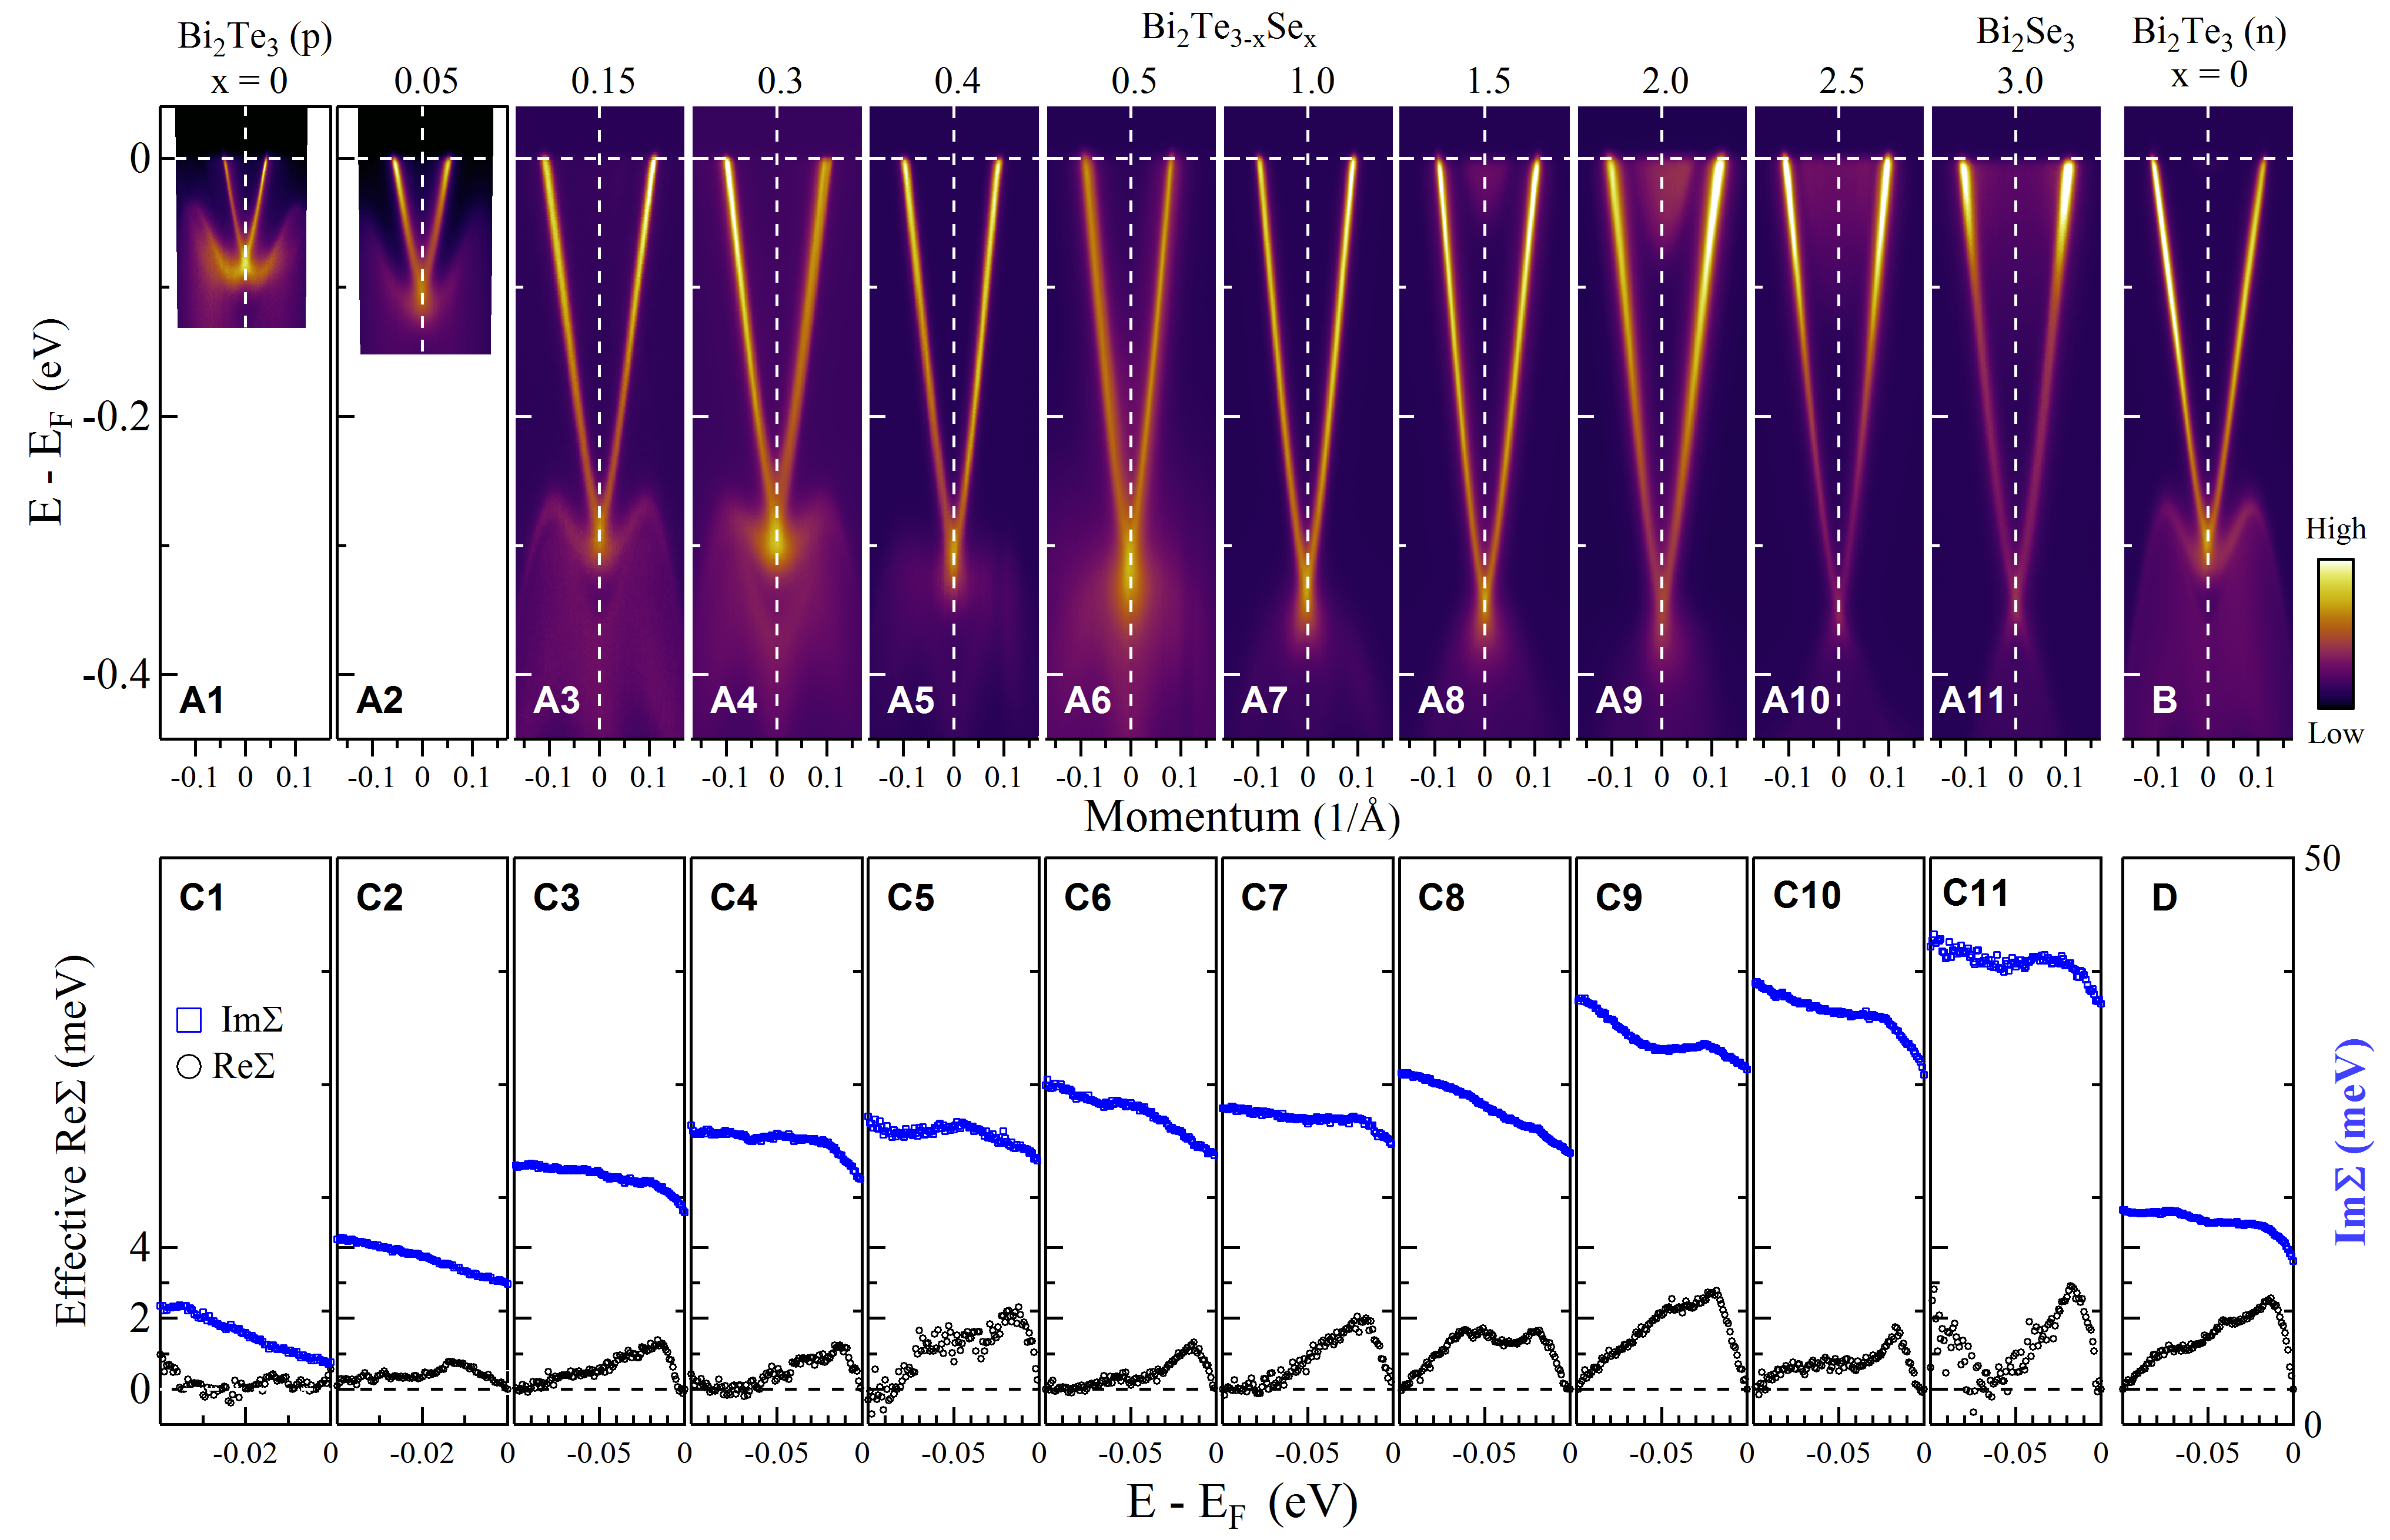
The electron-phonon coupling is extremely weak in the p-type Bi2Te3 sample, as seen in Fig. 2. This sample was prepared under similar condition as the above Bi2Se3 sample and it is p-type because the Fermi level intersects with the bulk valence bandXJZhouBiTeSeARPES . Even measured with such a super-high instrumental resolution (see Fig. S2 in Supplementary Materials), we do not resolve any clear signature of electron-phonon coupling. The measured dispersion is basically a straight line, corresponding to a real part of electron self-energy that is nearly zero (black empty circles in right panels of Fig. 2C and Fig. 2D). There is no clear drop in the imaginary part of the electron self-energy (blue empty squares in right panels of Fig. 2C and Fig. 2D). All these observations point to an extremely weak electron-phonon coupling in the p-type Bi2Te3 sample. In the mean time, the p-type Bi2Te3 also exhibits a rather weak electron-disorder scattering when compared with Bi2Se3. As seen from the right panel of Fig. 2C, the imaginary part of the electron self-energy at zero energy is only 5.6 meV along the – direction. This is significantly lower than 37 meV along the same direction in Bi2Se3 topological insulator (right panel of Fig. 1C).
The dramatically different behaviors between Bi2Se3 (Fig. 1) and p-type Bi2Te3 (Fig. 2) motivated us to further investigate the composition dependence of the Dirac fermion dynamics in the Bi2Te3-xSex series. We observe a systematic evolution of band structure, electron-phonon coupling, and electron-disorder scattering, with the change of composition x in Bi2Te3-xSex (Fig. 3). Note that all these samples are prepared under similar conditions. First, the location of the Dirac point (ED) moves monotonically to higher binding energy with increasing . For 0 0.05, the samples are p-type because the Fermi level intersects with the bulk valence band. For 0.15 1.5, the Fermi level intersects with the surface state bands only. For 1.5 3, the samples become n-type because the Fermi level intersects with the bulk conduction band. Note that the Dirac point exhibits a big jump when x changes from 0.05 to 0.15. Second, there is an overall increase of electron-disorder interaction with increasing x in Bi2Te3-xSex. This can be seen from the increase of the imaginary part of the electron self-energy and hence its value at zero energy with increasing x. This indicates that the Bi2Te3-xSex system gets more disordered with increasing x. Third, there is also an overall increase in the electron-phonon coupling strength with increasing x in Bi2Te3-xSex. Although no indication of electron-phonon coupling is observed in p-type Bi2Te3, a slight substitution of Te by Se, with x=0.05, already renders a clear observation of electron-phonon coupling in Bi2Te2.95Se0.05, as seen in the appearance of a peak in the real part of the electron self-energy (black circles in Fig. 3C2). The electron-phonon coupling strength increases from nearly zero for p-type Bi2Te3 to 0.17 for Bi2Se3.
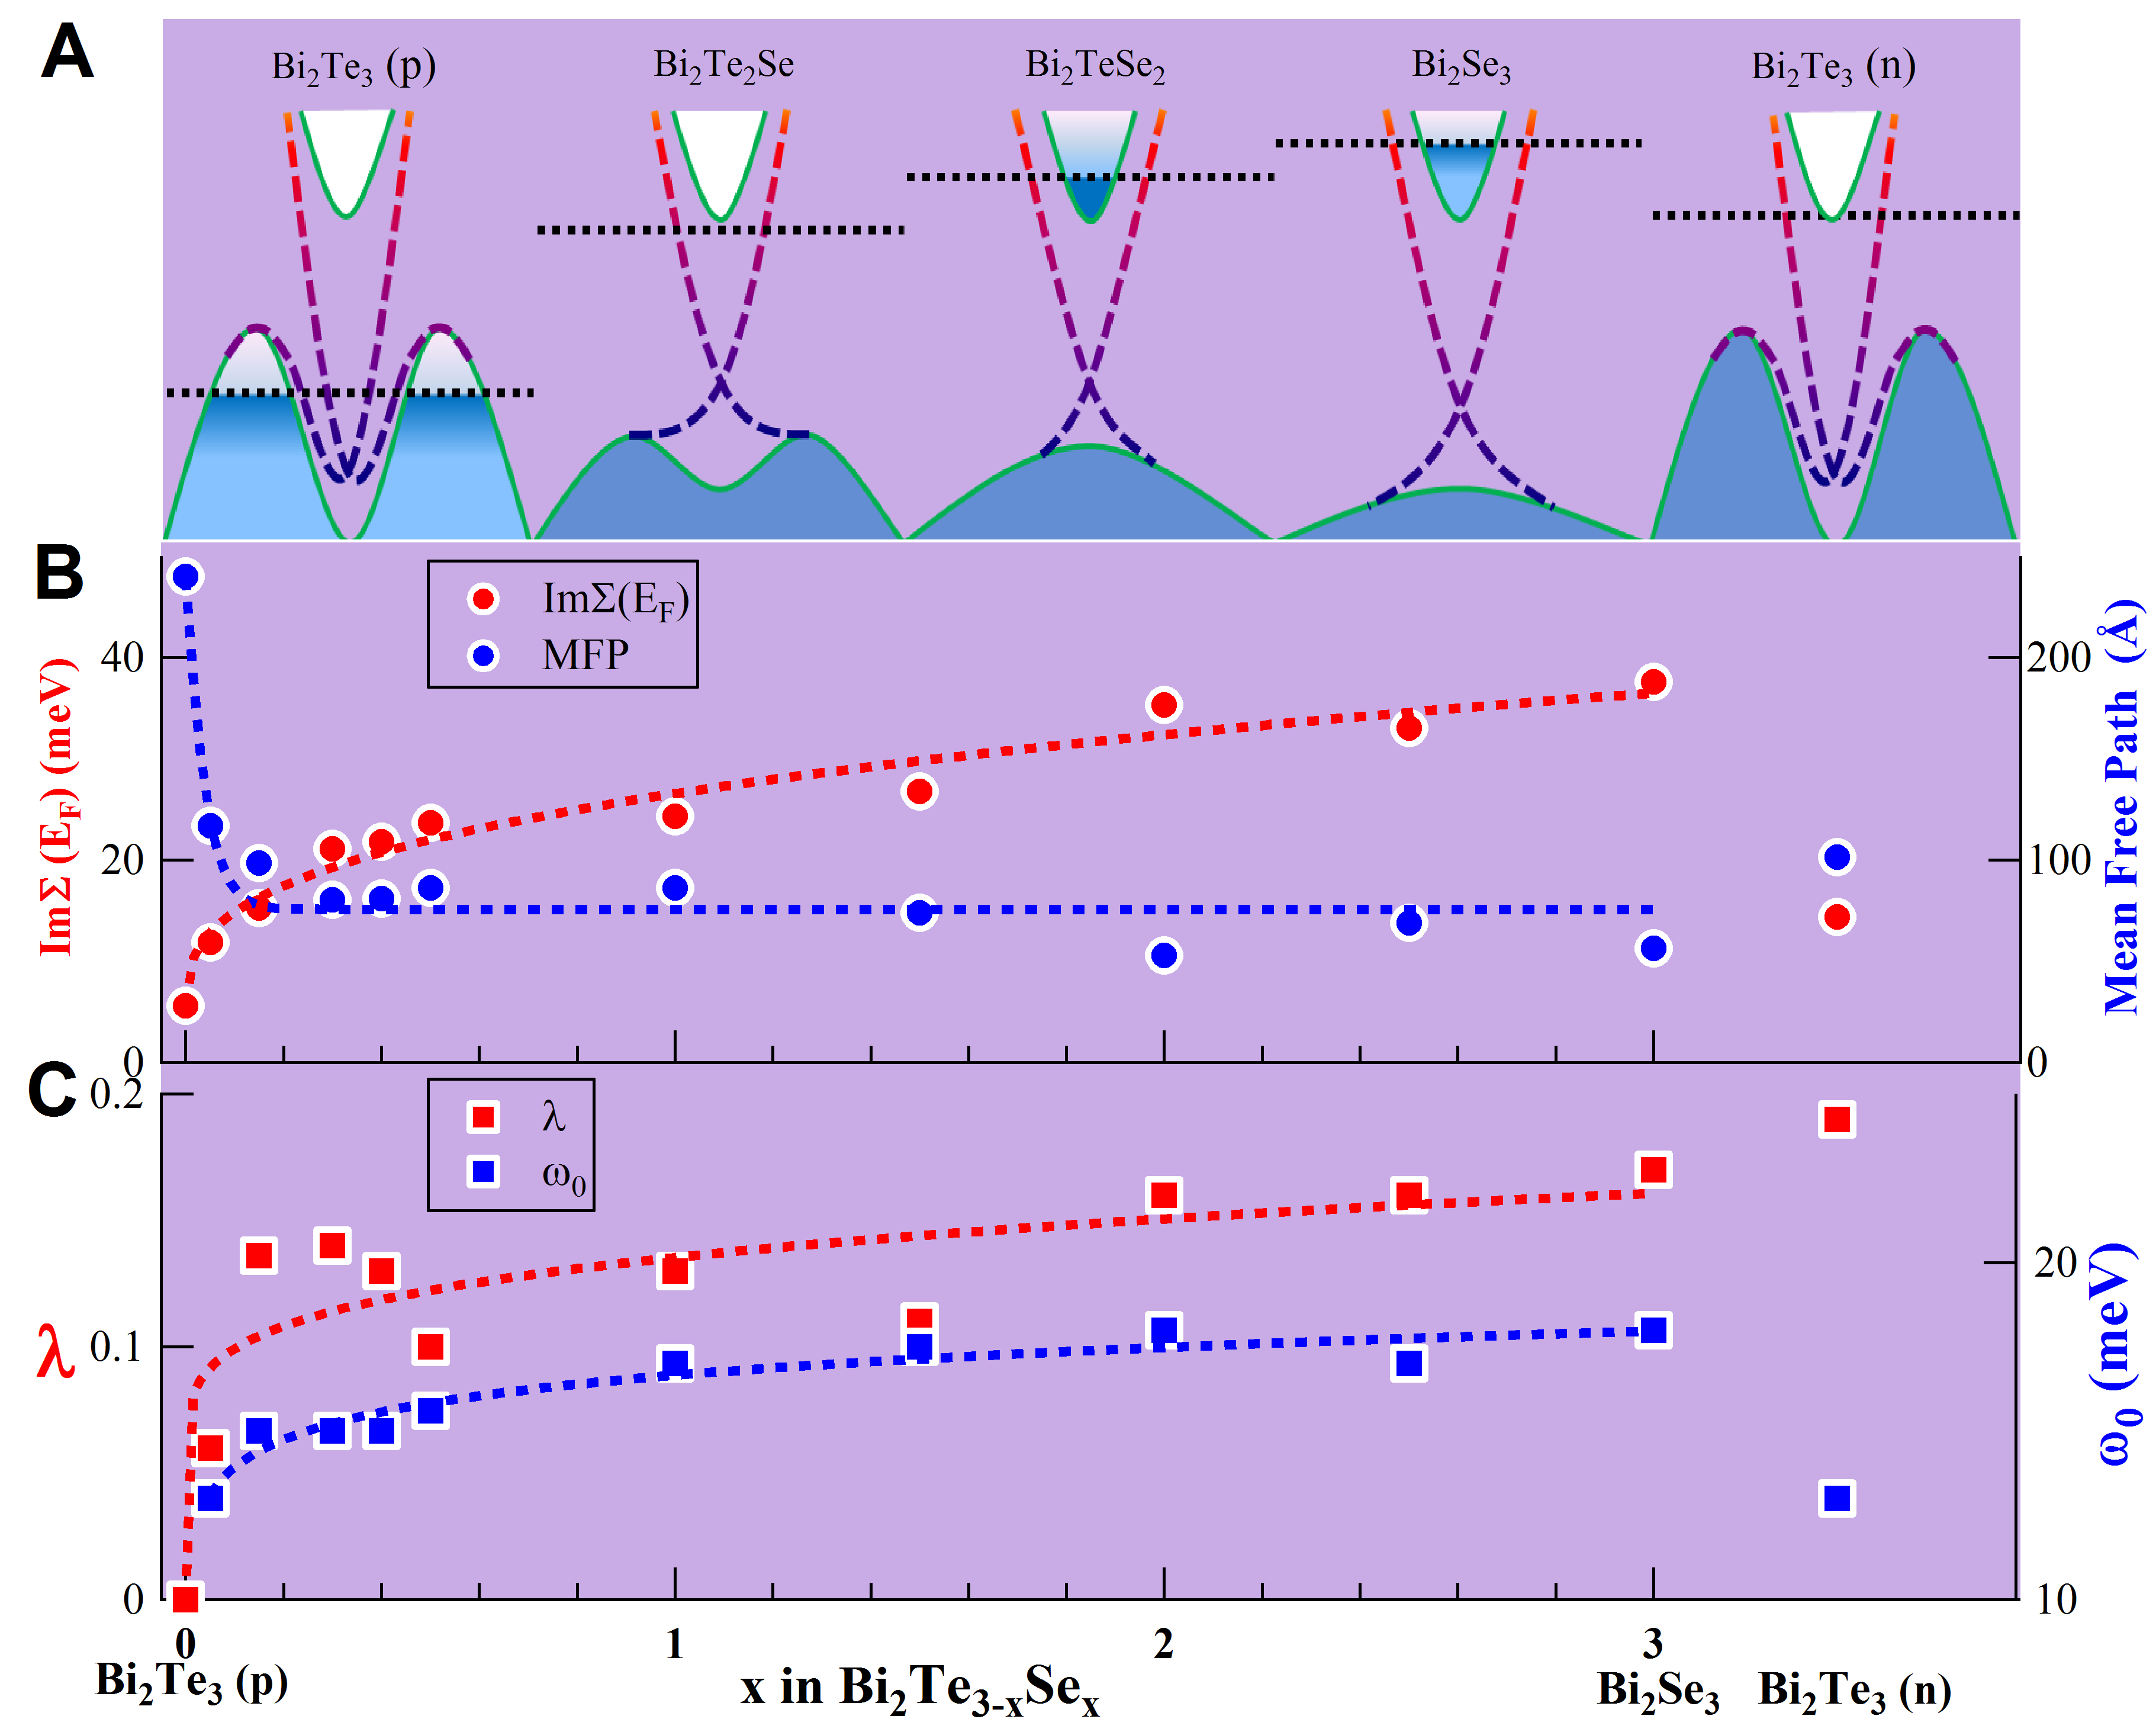
It is interesting that for the same Bi2Te3 nominal composition, when prepared under different conditions, samples can become either p-type or n-type that exhibit dramatic difference in their Dirac fermion dynamics. As shown in Fig. 3B, the Dirac point of the n-type Bi2Te3 lies nearly 310 meV below the Fermi level which differs significantly from the 85 meV location in the p-type Bi2Te3 (Fig. 3A1). Particularly, the n-type Bi2Te3 exhibits a pronounced electron-phonon coupling, as seen from the obvious peak in the real part of the electron self-energy (black circles in Fig. 3D) and a drop in the imaginary part of the electron self-energy (blue squares in Fig. 3D). The resultant electron-phonon coupling constant is 0.19, which is even slightly larger than that in Bi2Se3 (0.17). The electron-disorder scattering also increases in the n-type Bi2Te3 compared to the p-type one, as the value of the imaginary part of the electron self energy at zero energy becomes much larger (Fig. 3D). However, compared with Bi2Se3, the disorder scattering in n-type Bi2Te3 remains much weaker(Fig. 3C11). The first principle calculation, which expects a rather weak electron-phonon coupling in Bi2Te3 (0.05)HuangPhononBiTe , is hard to explain the strong electron-phonon coupling in n-type Bi2Te3 and particularly the disparity of electron-phonon coupling between the n-type and p-type Bi2Te3. As the main difference between the n-type and p-type Bi2Te3 lies in the relative position between the Dirac point and the bulk bands, it is reasonable to deduce that the bulk bands may play a role in the electron dynamics of the Dirac fermions. This is consistent with the observation that, for n-type Bi2Te3 (x=3), although its composition is rather different from Bi2Te0.15Se2.85 (x=0.15), their Dirac fermion dynamics is quite similar in both the electron-phonon coupling and electron-disorder interaction (Figs. 3 and 4). The distinction of the electron-phonon coupling between the n-type and p-type Bi2Te3 indicates that the control of the charge carrier doping can be an alternative way to tune the Dirac fermion dynamics in topological insulators.
Fig. 4 gives a quantitative summary of the electron-phonon coupling and electron-disorder scattering in the Bi2Te3-xSex system. The relative position between the Dirac point and the bulk band is depicted in Fig. 4A for a couple of typical compositions and both p- and n-type Bi2Te3. With increasing x in Bi2Te3-xSex, there is an abrupt jump in the electron-phonon coupling strength from x=0 to x=0.15, accompanied by a transition from p-type to n-type. Further increase of x leads to an overall slight increase of electron-phonon coupling (Fig. 4C). Meanwhile, the characteristic energy scale, 0, also increases with x, which is consistent with the increase of the phonon frequency from Bi2Te3 to Bi2Se3 (see Fig. S7 in Supplementary Materials). This indicates that the (Te,Se) vibrations play a major role in dictating the electron-phonon coupling strength in the Bi2Te3-xSex system. This is also consistent with the observation that the characteristic energy scale is identical in n-type and p-type Bi2Te3 because their phonon frequencies are quite similar (see Fig. S7 in Supplementary Materials) although they have different electron-phonon coupling strength. It is clear that electron-disorder scattering is dominant in the scattering process. As seen from Fig. 4B, the imaginary part of the electron self-energy at zero energy Im(EF), which gives a good measure of the electron scattering rate, shows an overall increase from the p-type Bi2Te3 for x=0 to Bi2Se3 for x=3 in the Bi2Te3-xSex system (red circles in Fig. 4B). The quasi-particle mean free path, , which can be determined from the MDC width , , first decreases abruptly from the p-type Bi2Te3 (x=0) to x=0.15, followed by an overall slight decrease with x in Bi2Te3-xTex (blue circles in Fig. 3B). The electron mobility of the Dirac fermions () is directly related to the quasi-particle mean free path, , with kF being the Fermi momentum. It is then estimated that the electron mobility in p-type Bi2Te3 is near 1000 (see Supplementary Materials). By comparison, the electron mobility in Bi2Se3 and n-type Bi2Te3 is 70 and 100 , respectively, which are significantly lower than that of p-type Bi2Te3. We note that, although the electron mobility obtained from ARPES is not strictly the same as the electron mobility in the transport properties, they have good correspondence, especially for materials with circular Fermi surface and nearly isotropic electron scattering.
The present study will provide important information for engineering the Dirac fermion dynamics in Bi2Te3-xSex topological insulators. It clearly indicates the presence of electron-phonon coupling and dominant role of the electron-disorder scattering in dictating the Dirac fermion dynamics in the system. The Dirac fermion dynamics can be tuned by varying either the composition or the charge carrier concentration. Specifically for the Bi2Te3-xSex system, our results clearly show that Bi2Te3 system is superior over Bi2Se3 in achieving higher electron mobility both due to its weak electron-phonon coupling and its weak electron-defect scattering. To further enhance the electron mobility in searching for novel quantum phenomena, it is necessary to choose a system with weak electron-phonon coupling and reduced disorder scattering.
References and Notes
References
- (1) M. Z. Hasan, C. L. Kane, Rev Mod Phys , 3045 (2010).
- (2) J. E. Moore, Nature , 194 (2010).
- (3) X. L. Qi, S. C. Zhang, Rev Mod Phys , 1057 (2011).
- (4) X. L. Qi, S. C. Zhang, Physics Today , 33 (2010).
- (5) J. Moore, Nat Phys , 378 (2009).
- (6) B. A. Bernevig, T. L. Hughes, S. C. Zhang, Science , 1757 (2006).
- (7) X. L. Qi, T. L. Hughes, S. C. Zhang, Nat Phys , 273 (2008).
- (8) R. Li, J. Wang, X. L. Qi, S. C. Zhang, Nat Phys , 284 (2010).
- (9) X. L. Qi, R. Li, J. Zang, S. C. Zhang, Science , 1184 (2009).
- (10) L. Fu, C. L. Kane, Phys Rev Lett , 096407 (2008).
- (11) L. Fu, E. Berg, Phys Rev Lett , 097001 (2010).
- (12) R. Yu et al., Science , 61 (2010).
- (13) M. Konig et al., Science , 766 (2007).
- (14) C. Brune et al., Phys Rev Lett , 126803 (2011).
- (15) L. Fu, C. L. Kane, E. J. Mele, Phys Rev Lett , 106803 (2007).
- (16) H. J. Zhang, et al., Nat Phys , 438 (2009).
- (17) Y. Xia et al., Nat Phys , 398 (2009).
- (18) Y. L. Chen et al., Science , 178 (2009).
- (19) D. X. Qu et al., Science , 821 (2010).
- (20) N. P. Butch et al., Phys Rev B , 241301 (2010).
- (21) A. A. Taskin, Z. Ren, S. Sasaki, K. Segawa, Y. Ando, Phys Rev Lett , 016801 (2011).
- (22) J. G. Analytis et al., Nat Phys , 960 (2010).
- (23) Z. Ren, A. A. Taskin, S. Sasaki, K. Segawa, Y. Ando, Phys Rev B , 075316 (2011).
- (24) Y. S. Hor et al., Phys Rev B , 195208 (2009).
- (25) C. Y. Chen et al., Proc. Natl. Acad. Sci. U.S.A. , 3694 (2012).
- (26) D. Kim et al., Phys Rev Lett , 166801 (2012).
- (27) K. S. Novoselov et al., Nature , 197 (2005).
- (28) Y. Zhang, Y.-W. Tan, H. L. Stormer, P. Kim, Nature , 201 (2005).
- (29) K. I. Bolotin et al., Solid State Commun , 351 (2008).
- (30) G. Grimvall, The Electron-Phonon Interction in Metals. (North-Holland, 1981).
- (31) A. Damascelli, Z. Hussain, Z. X. Shen, Rev Mod Phys , 473 (2003).
- (32) X. J. Zhou, T. Cuk, T. Devereaux, N. Nagaosa, Z. X. Shen, Handbook of High Temperature Superconductivity, edited by Schrieffer, J. R. (Springer, Berlin, 2006), Chap. 3.
- (33) R. C. Hatch et al., Phys Rev B , 241303 (2011).
- (34) Z. H. Pan et al., Phys Rev Lett , 187001 (2012).
- (35) X. Zhu et al., Phys Rev Lett , 186102 (2011).
- (36) Y. L. Chen et al., Science , 178 (2009).
- (37) G. D. Liu, et al., Rev Sci Instrum , 023105 (2008).
- (38) T. Valla, A. V. Fedorov, P. D. Johnson, S. L. Hulbert, Phys Rev Lett , 2085 (1999).
- (39) S. LaShell, E. Jensen, T. Balasubramanian, Phys Rev B , 2371 (2000).
- (40) W. Cheng, S. F. Ren, Phys Rev B , 094301 (2011).
- (41) W. Richter, C. R. Becker, phys. stat. sol. (b) , 619 (1977).
- (42) G. Q. Huang, EPL , 17001 (2012).
- (43) We thank Mr. Yuan Pang and Prof. Li Lu for providing us n-type Bi2Te3 single crystals, Prof. Liling Sun and Prof. Zhong-xian Zhao for their help in the characterization of the samples. We thank Mr. Quansheng Wu, Dr. Hongming Weng, Prof. Xi Dai and Prof. Zhong Fang for helpful discussions. This work is supported by the National Natural Science Foundation of China (91021006) and the Ministry of Science and Technology of China (973 program 2011CB921703).