Stacked triangular lattice: Percolation properties
Abstract
The stacked triangular lattice has the shape of a triangular prism. In spite of being considered frequently in solid state physics and materials science, its percolation properties have received few attention. We investigate several non-universal percolation properties on this lattice using Monte Carlo simulation. We show that the percolation threshold is for bonds and for sites. The number of clusters at the threshold per site is and . The stacked triangular lattice is a convenient choice to study the RGB model [Sci. Rep. 2, 751 (2012)]. We present results on this model and its scaling behavior at the percolation threshold.
pacs:
64.60.ah, 64.60.al, 89.75.DaI Introduction
Percolation is a classical model in statistical physics, exhibiting a continuous transition between a macroscopically disconnected and a connected state Stauffer and Aharony (1994); Sahimi (1994). The elements of a lattice (bonds or sites) are present with probability and absent with probability . Sites connected by bonds constitute clusters. Above a critical value , there is at least one cluster connecting two sides of a lattice with free boundary conditions. At the critical point , scale-free behavior is observed.
Many important properties of the percolation transition, such as critical exponents, correction-to-scaling exponents, and amplitude ratios are universal, and so independent on the microscopic lattice details, while others do depend on the considered lattice Stauffer and Aharony (1994); Aharony and Stauffer (1997); Jensen and Ziff (2006); Ziff (2011a, b). The non-universal properties include in particular the critical value of the occupation probability , i.e., the percolation threshold of the lattice, and the number of clusters per site at the threshold. For applications of percolation theory, it is important to know these non-universal, lattice dependent, properties with precision Sahimi (1994); Lorenz and Ziff (1998a).
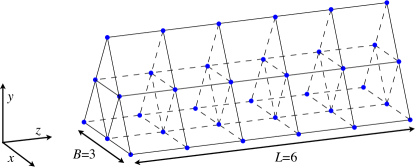
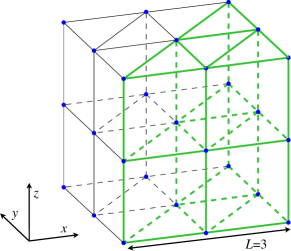
Here, we investigate the percolation properties of the stacked triangular lattice, which has the shape of a triangular prism (see Fig. 1). Although the stacked triangular lattice is used frequently for models in solid state physics, for example in studies of antiferromagnets Kawamura (1990); Boubcheur et al. (1996); Kawamura (1998); Thanh Ngo and Diep (2008) or hard-core bosons Ozawa and Ichinose (2012); Kataoka et al. (2012), its percolation properties have received far less attention; to our knowledge, only the calculation of its percolation threshold has been carried out, with spanning and wrapping probabilities van der Marck (1997a); van der Marck (1997b); Martins and Plascak (2003), giving and .
The geometry of the stacked triangular lattice is a convenient choice to study the recently introduced RGB model Schrenk et al. (2012a). This model is inspired by the challenge of sharing reservoirs, for example, when aquifers or petroleum reservoirs are concerned Hannesson (2000); van Dijke et al. (2007); Ryazanov et al. (2009); Unsal et al. (2010). The RGB model is based on the intuitive fact that partitioning a volume into two parts requires one division surface, while three parts of a volume are in contact along a simultaneous boundary consisting of lines. It has been shown that this boundary is a fractal set consisting of a single thread of fractal dimension spanning the medium surrounded by a cloud of loops of fractal dimension Schrenk et al. (2012a).
The RGB model generalizes the model of fracturing ranked surfaces Schrenk et al. (2012b) and the watershed model Fehr et al. (2011a); Daryaei et al. (2012); Fehr et al. (2009) to three dimensions and three basins. It is then closely related to loopless percolation and the random fuse model in strong disorder Manna and Subramanian (1996); Schrenk et al. (2012b); Moreira et al. (2012), which exhibit the same fractal dimension Fehr et al. (2012) also observed for optimum paths, minimum spanning trees Cieplak et al. (1994); Barabási (1996); Porto et al. (1997); Dobrin and Duxbury (2001), optimum-path cracking Andrade, Jr. et al. (2009); Oliveira et al. (2011), and fractal cluster boundaries of discontinuous percolation models Araújo and Herrmann (2010); Schrenk et al. (2011). Conceptually, there is also a relation to the water retention model, where a fractal depletion zone arises, for which, however, a higher fractal dimension of about has been reported Knecht et al. (2012); Baek and Kim (2012).
The organization of this work is as follows. Section II defines the RGB model on the stacked triangular lattice, along with the first results. In Section III, the percolation thresholds for site and bond percolation on the stacked triangular lattice are determined with improved precision. These results are used in Section IV to analyze the percolation properties and the RGB model at the percolation threshold. Conclusions are drawn in Section V.
II RGB model
The stacked triangular lattice of height and lateral size consists of stacked layers of triangular lattices of length (see Fig. 1). Therefore, it has sites and, with free boundary conditions, bonds.
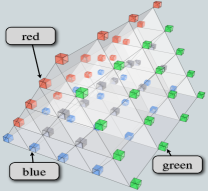
On this lattice, the RGB model, introduced recently in Ref. Schrenk et al. (2012a), can be formulated as follows. Initially, all bonds are unoccupied, such that there are clusters of unitary size. Some special sites (typically in the boundaries) are selected and labeled as red, green, or blue, such that every site has at most one color. We consider an initial site coloring as shown in Fig. 2(a): The three rectangular faces of the prism are divided into three parts of the same area as shown in the figure, such that sites in the same face have the same color.
Starting from this setup, there are two equivalent ways to simulate the RGB model. Similar to invasion percolation Wilkinson and Willemsen (1983); Lenormand (1989), one can consider that the lattice is invaded simultaneously from all initially colored sites, with the constraint that clusters of different colors can not merge Schrenk et al. (2012a). Here, as an alternative, we consider the following procedure, which can be defined in the language of random percolation. Starting from the same initial condition, the following steps are iterated until all have been selected:
(1) Select a bond uniformly at random from the list of bonds that have not been considered;
(2) Consider the colors of the two sites that this bond would connect:
(2.1) If at least one of the two sites has no color or both colors are the same, the bond is occupied, merging the two sites into the same cluster or closing a loop. In the case that one of these clusters has color while the second one is uncolored, all sites in the second cluster become colored with , and the two clusters merge.
(2.2) Else, i.e., in case occupying the selected bond would merge two clusters with different colors, the bond is not occupied and it is identified as a bridge bond Schrenk et al. (2012b).
| (a) | (b) |
|---|---|
 |
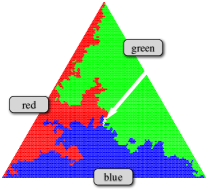 |
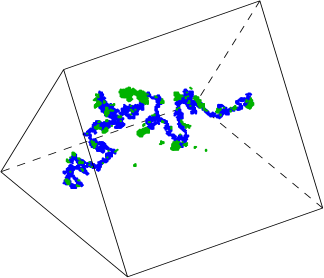
After all bonds have been selected, each one is either occupied or has been identified as bridge bond, and the sites in the lattice are split into three clusters, corresponding to the three colors: red, green, and blue [see Fig. 2(b)]. These three clusters are compact, but their boundaries are highly corrugated. To quantify this observation, we define an RGB site as a site with at least three of its neighboring sites carrying distinct colors. For a given configuration of colored sites, we can then measure the total number of RGB sites, , in the lattice. In addition, we know the total number of bridge bonds, , forming the division surfaces which separate pairs of colored clusters. Finally, as can be observed in Fig. 3, due to the special geometry of the stacked triangular lattice and the chosen initial coloring conditions (see Fig. 2), the set of all RGB sites always contains a spanning path of RGB sites connecting the two triangular faces of the lattice. One can use the burning method to determine the length, , of the shortest path of RGB sites connecting the two triangular faces Herrmann et al. (1984).
| (a) |
 |
| (b) |
 |
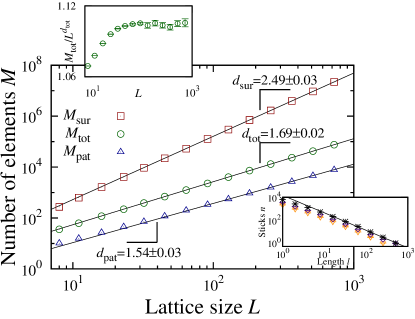
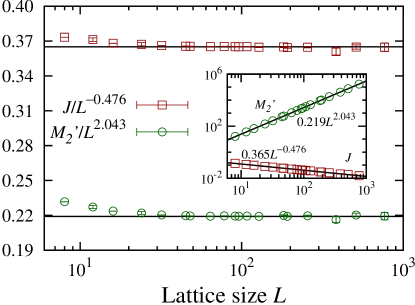
Figure 4 shows the results of measuring , , and on lattices of different sizes with and averaging over many realizations. To keep track of the cluster properties, we considered the labeling scheme proposed by Newman and Ziff Newman and Ziff (2000, 2001); Ziff (2010), related to the Hoshen-Kopelman algorithm Hoshen and Kopelman (1976). The algorithm proposed in Ref. Ziff (1998) was used to generate random numbers. Unless indicated, error bars are smaller than the symbol size. For large lattice sizes the total number of RGB sites scales with as with fractal dimension , as shown in Fig. 4. These results are confirmed by the analysis of the local slopes of the data and they are compatible with the fractal dimension obtained in Ref. Schrenk et al. (2012a) using an alternative definition of the RGB set. The length of the shortest path of RGB sites connecting the two triangular faces of the lattice scales as with . Using the yardstick method Tricot et al. (1988), we obtain within error bars the same result, (see lower inset of Fig. 4). We note that is larger than the fractal dimension of the minimum path in three-dimensional critical percolation, Zhou et al. (2012), as well as the one of the optimum path in strong disorder Buldyrev et al. (2004). Finally, the size of the surfaces separating the three clusters , measured as the total number of bridge bonds, is observed for large lattices to behave as . The fractal dimension , measured in Fig. 4, is compatible with the best known value for the three-dimensional watershed fractal dimension, Fehr et al. (2012, 2011b).
III Determining the percolation threshold
The RGB model is known to exhibit a crossover point described by a negative exponent at the percolation threshold for the lattice Schrenk et al. (2012a). To investigate this phenomenon, it is necessary to know with good accuracy. In the following, we improve the estimates of the thresholds, obtaining for bond and for site percolation, compatible, although with more precision, with previous estimates van der Marck (1997a); van der Marck (1997b); Martins and Plascak (2003).
As discussed in Section II, the stacked triangular lattice is convenient for simulating the RGB model. The percolation threshold only depends on the dimension and topology of the lattice, but not on the boundary conditions. Thus, for numerical convenience, to determine the percolation threshold and other non-universal properties, we consider two joined stacked triangular lattices (see Fig. 5), resulting in one simple-cubic lattice with one additional bond per square in the -plane. Consequently, a site with coordinates is connected not only to its six nearest neighbors, as in the cubic lattice, but also to the sites at and . This lattice, with periodic boundary conditions, has bonds and sites.
denotes the fraction of occupied bonds or sites. We analyze the lattice size dependence of several threshold estimators (see Fig. 6 and Table 1 and 2). In a lattice of sites, the order parameter of the percolation transition is defined as the fraction of sites in the largest cluster (of size ),
| (1) |
In the thermodynamic limit, at the percolation threshold, the rate of change of the order parameter diverges Stanley (1971); Binney et al. (1992). Therefore, we consider as one estimator the average fraction of occupied bonds or sites at which the largest change in occurs Nagler et al. (2011); Schrenk et al. (2011); Manna (2012); Chen and D’Souza (2011); Schrenk et al. (2012c); Reis et al. (2012); Nagler et al. (2012); Zhang et al. (2012); Chen et al. (2012); Chi and Cai (2012).
| Estimator | Estimate | Error | ||
|---|---|---|---|---|
| Combined |
| Estimator | Estimate | Error | ||
|---|---|---|---|---|
| Combined |
The second moment of the cluster size distribution is defined as,
| (2) |
where the sum runs over all clusters and is the number of sites in cluster . The second moment excluding the contribution of the largest cluster is,
| (3) |
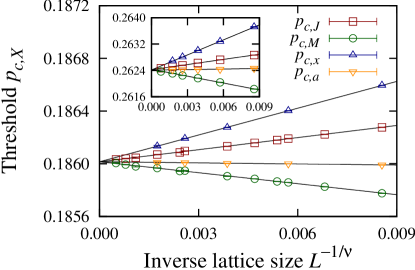
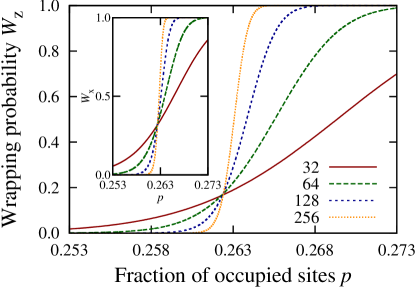
and we use the average position of the peak in for finite lattices as the second estimator. Finally, we also consider the probability that at least one cluster wraps around the lattice (with periodic boundary conditions) Newman and Ziff (2000, 2001); Ziff (2010); Machta et al. (1995, 1996). We define as the probability that at least one cluster wraps the lattice in -direction and as the probability that at least one cluster wraps the lattice in -direction. Since for the stacked triangular lattice, the -direction is not equivalent to the - and the -directions (see Fig. 1 and 5), one in general can not expect and to have the same quantitative behavior. To estimate the percolation threshold, we consider the fractions of occupied bonds , , and , where the given sample first wraps in -, -, or any direction, respectively. For large lattices, the wrapping probability curves are expected to intersect at values of close to the percolation threshold (see Fig. 7). Therefore, we also consider the fraction of occupied bonds , where two wrapping probability curves for subsequent lattice sizes, and intersect (see Table 3). To keep track of wrapping clusters, we followed the procedure outlined, e.g., in Refs. Machta et al. (1995, 1996); Newman and Ziff (2001); Ziff (2010). Our final estimates of the percolation thresholds of the stacked triangular lattice are
| (4) |
for bond and
| (5) |
| (a) | |||||||||||||||||||||||||||||||||||
|
|||||||||||||||||||||||||||||||||||
| (b) | |||||||||||||||||||||||||||||||||||
|
While recording the threshold estimators and , i.e., the average value of where the largest change in and occurs, we also measured the average values of the largest change in , denoted by , and the maximum of , denoted by (see Fig. 8). One observes that for large lattices, the measured quantities scale as and . Assuming that Manna (2012) and , where , , and are the critical exponents related with the order parameter, the susceptibility, and the correlation length, respectively, this is consistent with the known values of these ratios for percolation in three dimensions, and Deng and Blöte (2005); Grassberger (1992); Jan and Stauffer (1998); Lorenz and Ziff (1998a); Ballesteros et al. (1999).
IV Percolation and RGB sites
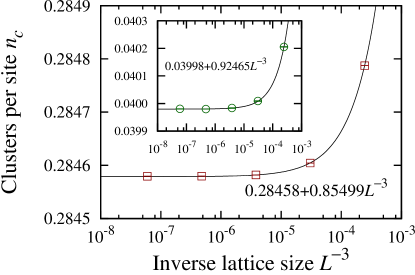
Having determined the percolation threshold , we use it to measure the number of clusters per site at , and , which for critical percolation is known to be a lattice-dependent constant Ziff et al. (1997); Temperley and Lieb (1971); Baxter et al. (1978) and which, in addition, can be considered to determine the percolation threshold for loopless bond percolation Manna and Subramanian (1996); Ziff (2009); Schrenk et al. (2012c).
Figure 9 shows the data for and . Extrapolating to the thermodynamic limit, we obtain for bond percolation
| (6) |
and
| (7) |
for site percolation. We remark that is slightly higher than the simple-cubic lattice value of Lorenz and Ziff (1998b). In loopless bond percolation, bonds that would close a loop, i. e. that would connect two sites which are already part of the same cluster, remain unoccupied. Therefore, in comparison with classical bond percolation, the value of the percolation threshold differs in general, , but for every given configuration the obtained clusters are identical to the ones in classical percolation. It follows that the number of clusters at the threshold is identical, . Consider a loopless bond percolation process, starting from an initial condition where all bonds are unoccupied, , such that there are clusters of unit size. With increasing , every bond that becomes occupied merges two distinct clusters into one tree, since it can not close a loop. If there are occupied bonds, the number of clusters is . At the threshold, , there are
| (8) |
clusters. Therefore,
| (9) |
For example, on the two-dimensional square lattice, this yields Ziff (2009). While on the square lattice , on the stacked triangular lattice , as can be seen either by considering the modified simple-cubic lattice with additional bonds (see Fig. 5), or by taking the large limit of . Therefore, we can derive from our result in Eq. (6), for the loopless bond percolation threshold:
| (10) |
In a similar language as the one used for the percolation model, we can understand the evolution of the set of RGB sites in the RGB model, by analyzing its behavior with an increasing fraction of selected bonds Schrenk et al. (2012a), starting from the initial condition shown in Fig. 2(a). To analyze the evolution of the RGB model similarly to a bond percolation process, we consider the following: For bond percolation, is the fraction of occupied bonds. Let us define for the RGB model that is the fraction of bonds that are either occupied or have already been labeled as bridge bonds. Then the description of the RGB model in Section II starts with and the results presented there are for the case . The inset of Fig. 10 shows the rescaled total number of RGB sites as function of the fraction of selected bonds . One observes that below the bond percolation threshold, vanishes for large lattice sizes . Above , is finite and the data points for different lattice sizes overlap, showing that the fractal dimension of the set of RGB sites is . With the distance to , is found to scale as , where we obtain for the RGB site growth exponent.
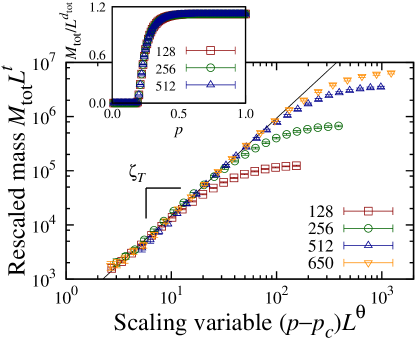
This peculiar behavior raises the question of how the set of RGB sites behaves at the percolation threshold. In Ref. Schrenk et al. (2012a), it was found that at , , with
| (11) |
where is the fractal dimension of the surfaces dividing pairs of colors at . Since the division surfaces at the percolation threshold are formed out of bridge bonds that would, once occupied, form a spanning cluster, is the critical bridge bond fractal dimension. Coniglio has shown that this fractal dimension equals , where is the correlation length critical exponent of percolation Coniglio (1989); Scholder (2009). For three-dimensional percolation, Deng and Blöte (2005) and one obtains . These results imply that while the size of the division surfaces diverges at the threshold, the number of RGB sites decreases as a power law in the lattice size. Thus, in the thermodynamic limit the set of RGB sites is empty. These findings can be summarized in the following crossover scaling for the number of RGB sites:
| (12) |
where the scaling behavior of in and implies Schrenk et al. (2012a). The scaling function fulfills for . In the main plot of Fig. 10, the Ansatz in Eq. (12) is confirmed. The quality of the scaling is seen from the increase of the overlap region of curves for different lattice sizes, with the lattice size.
V Final remarks
Concluding, we have used the special geometry of the stacked triangular lattice to study the recently introduced RGB model Schrenk et al. (2012a). We also calculated more precise values for the bond and site percolation thresholds of this lattice, which could be useful for models in solid state physics using the same lattice. In addition, we determined the number of clusters per site for critical percolation on the stacked triangular lattice and investigated the scale-free behavior of the RGB model at the critical point. In the future, it would also be interesting to extend the RGB model to higher numbers of colors and dimensions.
Acknowledgements.
We acknowledge financial support from the ETH Risk Center, the Brazilian institute INCT-SC, and grant number 319968 of the European Research Council.References
- Stauffer and Aharony (1994) D. Stauffer and A. Aharony, Introduction to Percolation Theory, 2nd ed. (Taylor & Francis, London, 1994).
- Sahimi (1994) M. Sahimi, Applications of Percolation Theory (Taylor & Francis, London, 1994).
- Aharony and Stauffer (1997) A. Aharony and D. Stauffer, J. Phys. A: Math. Gen. 30, L301 (1997).
- Jensen and Ziff (2006) I. Jensen and R. M. Ziff, Phys. Rev. E 74, 020101(R) (2006).
- Ziff (2011a) R. M. Ziff, Phys. Rev. E 83, 020107(R) (2011a).
- Ziff (2011b) R. M. Ziff, Physics Procedia 15, 106 (2011b).
- Lorenz and Ziff (1998a) C. D. Lorenz and R. M. Ziff, Phys. Rev. E 57, 230 (1998a).
- Kawamura (1990) H. Kawamura, Prog. Theor. Phys. Suppl. 101, 545 (1990).
- Boubcheur et al. (1996) E. H. Boubcheur, D. Loison, and H. T. Diep, Phys. Rev. B 54, 4165 (1996).
- Kawamura (1998) H. Kawamura, J. Phys.: Condens. Matter 10, 4707 (1998).
- Thanh Ngo and Diep (2008) V. Thanh Ngo and H. T. Diep, Phys. Rev. E 78, 031119 (2008).
- Ozawa and Ichinose (2012) H. Ozawa and I. Ichinose, Phys. Rev. A 86, 015601 (2012).
- Kataoka et al. (2012) K. Kataoka, Y. Kuno, and I. Ichinose, J. Phys. Soc. Jpn. 81, 124502 (2012).
- van der Marck (1997a) S. C. van der Marck, Phys. Rev. E 55, 1228 (1997a).
- van der Marck (1997b) S. C. van der Marck, Phys. Rev. E 55, 1514 (1997b).
- Martins and Plascak (2003) P. H. L. Martins and J. A. Plascak, Phys. Rev. E 67, 046119 (2003).
- Schrenk et al. (2012a) K. J. Schrenk, N. A. M. Araújo, and H. J. Herrmann, Sci. Rep. 2, 751 (2012a).
- Hannesson (2000) R. Hannesson, Energy J. 21, 105 (2000).
- van Dijke et al. (2007) M. I. J. van Dijke, M. Piri, J. O. Helland, K. S. Sorbie, M. J. Blunt, and S. M. Skjæveland, Water Resour. Res. 43, W12S05 (2007).
- Ryazanov et al. (2009) A. V. Ryazanov, M. I. J. van Dijke, and K. S. Sorbie, Transp. Porous Med. 80, 79 (2009).
- Unsal et al. (2010) E. Unsal, S. K. Matthäi, and M. J. Blunt, Comput. Geosci. 14, 527 (2010).
- Schrenk et al. (2012b) K. J. Schrenk, N. A. M. Araújo, J. S. Andrade Jr., and H. J. Herrmann, Sci. Rep. 2, 348 (2012b).
- Fehr et al. (2011a) E. Fehr, D. Kadau, J. S. Andrade, Jr., and H. J. Herrmann, Phys. Rev. Lett. 106, 048501 (2011a).
- Daryaei et al. (2012) E. Daryaei, N. A. M. Araújo, K. J. Schrenk, S. Rouhani, and H. J. Herrmann, Phys. Rev. Lett. 109, 218701 (2012).
- Fehr et al. (2009) E. Fehr, J. S. Andrade Jr., S. D. da Cunha, L. R. da Silva, H. J. Herrmann, D. Kadau, C. F. Moukarzel, and E. A. Oliveira, J. Stat. Mech. , P09007 (2009).
- Manna and Subramanian (1996) S. S. Manna and B. Subramanian, Phys. Rev. Lett. 76, 3460 (1996).
- Moreira et al. (2012) A. A. Moreira, C. L. N. Oliveira, A. Hansen, N. A. M. Araújo, H. J. Herrmann, and J. S. Andrade, Jr., Phys. Rev. Lett. 109, 255701 (2012).
- Fehr et al. (2012) E. Fehr, K. J. Schrenk, N. A. M. Araújo, D. Kadau, P. Grassberger, J. S. Andrade Jr., and H. J. Herrmann, Phys. Rev. E 86, 011117 (2012).
- Cieplak et al. (1994) M. Cieplak, A. Maritan, and J. R. Banavar, Phys. Rev. Lett. 72, 2320 (1994).
- Barabási (1996) A.-L. Barabási, Phys. Rev. Lett. 76, 3750 (1996).
- Porto et al. (1997) M. Porto, S. Havlin, S. Schwarzer, and A. Bunde, Phys. Rev. Lett. 79, 4060 (1997).
- Dobrin and Duxbury (2001) R. Dobrin and P. M. Duxbury, Phys. Rev. Lett. 86, 5076 (2001).
- Andrade, Jr. et al. (2009) J. S. Andrade, Jr., E. A. Oliveira, A. A. Moreira, and H. J. Herrmann, Phys. Rev. Lett. 103, 225503 (2009).
- Oliveira et al. (2011) E. A. Oliveira, K. J. Schrenk, N. A. M. Araújo, H. J. Herrmann, and J. S. Andrade Jr., Phys. Rev. E 83, 046113 (2011).
- Araújo and Herrmann (2010) N. A. M. Araújo and H. J. Herrmann, Phys. Rev. Lett. 105, 035701 (2010).
- Schrenk et al. (2011) K. J. Schrenk, N. A. M. Araújo, and H. J. Herrmann, Phys. Rev. E 84, 041136 (2011).
- Knecht et al. (2012) C. L. Knecht, W. Trump, D. ben-Avraham, and R. M. Ziff, Phys. Rev. Lett. 108, 045703 (2012).
- Baek and Kim (2012) S. K. Baek and B. J. Kim, Phys. Rev. E 85, 032103 (2012).
- Wilkinson and Willemsen (1983) D. Wilkinson and J. F. Willemsen, J. Phys. A: Math. Gen. 16, 3365 (1983).
- Lenormand (1989) R. Lenormand, Proc. R. Soc. Lond. A 423, 159 (1989).
- Herrmann et al. (1984) H. J. Herrmann, D. C. Hong, and H. E. Stanley, J. Phys. A: Math. Gen. 17, L261 (1984).
- Tricot et al. (1988) C. Tricot, J. F. Quiniou, D. Wehbi, C. Roques-Carmes, and B. Dubuc, Revue Phys. Appl. 23, 111 (1988).
- Newman and Ziff (2000) M. E. J. Newman and R. M. Ziff, Phys. Rev. Lett. 85, 4104 (2000).
- Newman and Ziff (2001) M. E. J. Newman and R. M. Ziff, Phys. Rev. E 64, 016706 (2001).
- Ziff (2010) R. M. Ziff, Phys. Rev. E 82, 051105 (2010).
- Hoshen and Kopelman (1976) J. Hoshen and R. Kopelman, Phys. Rev. B 14, 3438 (1976).
- Ziff (1998) R. M. Ziff, Comput. Phys. 12, 385 (1998).
- Zhou et al. (2012) Z. Zhou, J. Yang, Y. Deng, and R. M. Ziff, Phys. Rev. E 86, 061101 (2012).
- Buldyrev et al. (2004) S. V. Buldyrev, S. Havlin, E. López, and H. E. Stanley, Phys. Rev. E 70, 035102(R) (2004).
- Fehr et al. (2011b) E. Fehr, D. Kadau, N. A. M. Araújo, J. S. Andrade Jr., and H. J. Herrmann, Phys. Rev. E 84, 036116 (2011b).
- Stanley (1971) H. E. Stanley, Introduction to Phase Transitions and Critical Phenomena (Oxford University Press, New York, 1971).
- Binney et al. (1992) J. J. Binney, N. J. Dowrick, A. J. Fisher, and M. E. J. Newman, The Theory of Critical Phenomena (Oxford University Press, New York, 1992).
- Nagler et al. (2011) J. Nagler, A. Levina, and M. Timme, Nat. Phys. 7, 265 (2011).
- Manna (2012) S. S. Manna, Physica A 391, 2833 (2012).
- Chen and D’Souza (2011) W. Chen and R. M. D’Souza, Phys. Rev. Lett. 106, 115701 (2011).
- Schrenk et al. (2012c) K. J. Schrenk, A. Felder, S. Deflorin, N. A. M. Araújo, R. M. D’Souza, and H. J. Herrmann, Phys. Rev. E 85, 031103 (2012c).
- Reis et al. (2012) S. D. S. Reis, A. A. Moreira, and J. S. Andrade Jr., Phys. Rev. E 85, 041112 (2012).
- Nagler et al. (2012) J. Nagler, T. Tiessen, and H. W. Gutch, Phys. Rev. X 2, 031009 (2012).
- Zhang et al. (2012) Y. Zhang, W. Wei, B. Guo, R. Zhang, and Z. Zheng, Phys. Rev. E 86, 051103 (2012).
- Chen et al. (2012) W. Chen, Z. Zheng, and R. M. D’Souza, EPL 100, 66006 (2012).
- Chi and Cai (2012) L. Chi and X. Cai, Int. J. Mod. Phys. C 23, 1250083 (2012).
- Deng and Blöte (2005) Y. Deng and H. W. J. Blöte, Phys. Rev. E 72, 016126 (2005).
- Machta et al. (1995) J. Machta, Y. S. Choi, A. Lucke, T. Schweizer, and L. V. Chayes, Phys. Rev. Lett. 75, 2792 (1995).
- Machta et al. (1996) J. Machta, Y. S. Choi, A. Lucke, T. Schweizer, and L. M. Chayes, Phys. Rev. E 54, 1332 (1996).
- Grassberger (1992) P. Grassberger, J. Phys. A: Math. Gen. 25, 5867 (1992).
- Jan and Stauffer (1998) N. Jan and D. Stauffer, Int. J. Mod. Phys. C 9, 341 (1998).
- Ballesteros et al. (1999) H. G. Ballesteros, L. A. Fernández, V. Martín-Mayor, A. Muñoz Sudupe, G. Parisi, and J. J. Ruiz-Lorenzo, J. Phys. A: Math. Gen. 32, 1 (1999).
- Ziff et al. (1997) R. M. Ziff, S. R. Finch, and V. S. Adamchik, Phys. Rev. Lett. 79, 3447 (1997).
- Temperley and Lieb (1971) H. N. V. Temperley and E. H. Lieb, Proc. R. Soc. Lond. A 322, 251 (1971).
- Baxter et al. (1978) R. J. Baxter, H. N. V. Temperley, and S. E. Ashley, Proc. R. Soc. Lond. A 358, 535 (1978).
- Ziff (2009) R. M. Ziff, Phys. Rev. Lett. 103, 045701 (2009).
- Lorenz and Ziff (1998b) C. D. Lorenz and R. M. Ziff, J. Phys. A: Math. Gen. 31, 8147 (1998b).
- Coniglio (1989) A. Coniglio, Phys. Rev. Lett. 62, 3054 (1989).
- Scholder (2009) O. Scholder, Int. J. Mod. Phys. C 20, 267 (2009).