The Critical Importance of Russell’s Diagram
Abstract
The idea of dwarf and giants stars, but not the nomenclature, was first established by Eijnar Hertzsprung in 1905; his first diagrams in support appeared in 1911. In 1913 Henry Norris Russell could demonstrate the effect far more strikingly because he measured the parallaxes of many stars at Cambridge, and could plot absolute magnitude against spectral type for many points. The general concept of dwarf and giant stars was essential in the galactic structure work of Harlow Shapley, Russell’s first graduate student. In order to calibrate the period-luminosity relation of Cepheid variables, he was obliged to fall back on statistical parallax using only 11 Cepheids, a very sparse sample. Here the insight provided by the Russell diagram became critical. The presence of yellow K giant stars in globular clusters credentialed his calibration of the period-luminosity relation by showing that the calibrated luminosity of the Cepheids was comparable to the luminosity of the K giants. It is well known that in 1920 Shapley did not believe in the cosmological distances of Heber Curtis’ spiral nebulae. It is not so well known that in 1920 Curtis’ plot of the period-luminosity relation suggests that he didn’t believe it was a physical relation and also he failed to appreciate the significance of the Russell diagram for understanding the large size of the Milky Way.
Ninety years ago, when the Royal Astronomical Society was celebrating its centennial, the RAS President, A.S. Eddington selected six great landmarks of astronomical progress in that century. He included the determination of stellar parallax, the discovery of Neptune, the rise of spectroscopic astronomy, and from the decade of relevance to our conference, the measurement of the angular diameter of Betelgeuse with Michelson’s interferometer. How astonishing to have this last item on the list, a measurement now so obscure that most of today’s astronomy graduate students have never heard of it! “It seems to me,” Eddington declared, “to be worthy of a place in this select list as a triumph of scientific achievement which is second to none.”111Eddington (1922, pp. 815-7)
While today we may be reluctant to include this measurement in such a list, it behooves us to parse its meaning a bit more to place its significance in the astronomical ferment of the teens of the 20th century, the time of Lowell, Slipher, Hale, Hertzsprung, Russell, Shapley, Curtis, Eddington, and Kapteyn, to name a few of the leaders.
In 1897 in vol 28 of the Harvard College Observatory Annals, Antonia Maury and Annie J. Cannon had presented the first fruits of their spectral classification work. Annie Cannon’s scheme was a refinement of the letter categories started earlier by Wilhelmina Fleming under E. C. Pickering’s general supervision222Cannon (1901). Cannon added the numbers, so that classes G0, G1, and G2 in principle followed F8 and F9, although not all the numbers were actually defined. This was to become the basis of the Henry Draper Catalogue, issued in volumes 91 to 99 of the Harvard Annals (1918–24). Maury’s scheme had 22 categories designated with Roman numerals, each with three subdivisions, a, b, and c – too complicated and clumsy for widespread use, most astronomers concluded.333Maury (1897) The Danish astronomer Eijnar Hertzsprung, then working in Leiden, thought otherwise and wrote to Pickering in 1908 that “In my opinion the separation by Antonia Maury of the c and ac-stars is the most important advancement in stellar classification since the trials by Vogel and Secchi . . . . To neglect the c-properties in classifying stellar spectra, I think, is nearly the same thing as if the zoologist, who has detected the deciding differences between a whale and a fish, would continue in classifying them together.”444E. Hertzsprung to E. C. Pickering, 22 July 1908, Pickering papers, Harvard University Archives.
In any event, Maury’s classifications enabled Hertzsprung to make an interesting analysis in 1905. What he showed was that the rare three dozen stars in Maury’s subclasses c and ac, seemed intrinsically brighter than those in classes a and b. Since it would have been difficult to get reliable parallaxes for the intrinsically brighter and more distant stars, Hertzsprung drew his conclusion statistically using proper motions.555An English translation by Harlow Shapley and Vincent Icke of Hertzsprung’s 1905 paper is printed in Lang & Gingerich (1979, pp. 209-211). This should have been seen as a peculiar and provocative result by the astronomical community, except that not many saw it. Hertzsprung had buried it and his follow-up paper of 1907 in a journal for photographic technology, Zeitschrift für wissenschaftliche Photographie.666Hertzsprung (1905, p. 86) and Hertzsprung (1907, p. 429). Some years later, when Eddington found it, he chided Hertzsprung, saying, “One of the sins of your youth – to publish important papers in inaccessible places.”777A. S. Eddington to E. Hertzsprung, 7 August 1925, quoted in Nielsen (1964, p. 236).
It must have taken a few decades for the physical reasons for the subclass c characteristics to be understood. The normal diffuseness of the hydrogen lines in B, A, and F stars is caused by the Stark effect, where the electric fields generated by passing ions disturb the atomic excitation levels in the hydrogen atoms. The effect is enhanced by the comparative density of main sequence stars. Giant or supergiant stars have much lower particle densities in their atmospheres, so the atomic excitation levels are much less disturbed, and the spectral lines are distinctly sharper. Note that Maury classified 649 brighter northern stars in her monograph, of which only 35 were labeled c or ac, all in spectral types that showed conspicuous hydrogen lines.
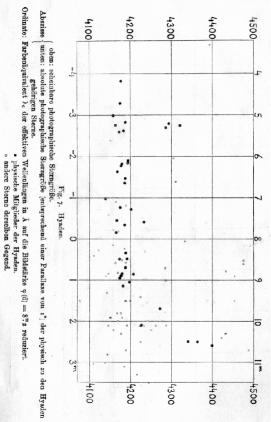
In a third paper, printed in 1911 in the Potsdam Astrophysical Observatory’s Publications888Hertzsprung (1911) Hertzsprung actually included diagrams, plotting apparent magnitude against color for stars in the Pleiades and Hyades. Because the stars in each cluster could be assumed to be at the same distance, this was equivalent to plotting the absolute magnitude against spectral type. But the Pleiades cluster has no giants or supergiants, so its diagram showed no bifurcation. In contrast, a few giants, scarcely even a handful, were present in the Hyades, once again showing a two-fold division of stars within their spectral types, but hardly dramatically so (see Figure 1).
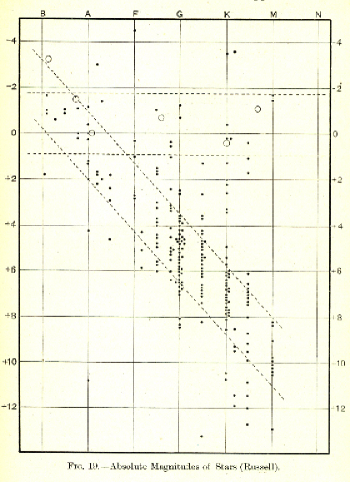
Several years later, in 1913, Henry Norris Russell could demonstrate the effect far more strikingly 999Russell (1913) because by that time he had access to the parallax for many stars, and thus he could plot absolute magnitude against spectral type with a substantial number of points. Russell distinguished the stars into dwarfs and giants, attributing the nomenclature to Hertzsprung, who had not in fact used such a designation in either of his Zeitschrift papers 101010Hertzsprung (1905, 1907) or in the Potsdam publication.111111Hertzsprung (1911)
Many years ago I directly queried Hertzsprung about his possible invention of the dwarf-giant nomenclature, and he replied: “I hasten to say that I have avoided the expressions ‘giant’ and ‘dwarf’, because the stars are not very different in mass, but in density. They are more or less ‘swollen’.” Near the end of a popular lecture given at the end of 1908 (and published the following year in Himmel und Erde)121212Schwarzschild (1909, pp. 433-451) Karl Schwarzschild used the term giants (Giganten) repeatedly, but not dwarf. So it is quite possible that Russell himself invented the paired usage of both giant and dwarf.
This nomenclature was promptly picked up by Observatory by entitling Russell’s report to the June 1913 meeting of the Royal Astronomical Society simply “‘Giant’ and ‘Dwarf’ Stars.”131313Russell (1913) Russell and several other American astronomers had stopped in London on their way to the International Solar Union meeting in Bonn. The RAS session gave Russell a much larger audience than at the Astronomy and Astrophysics Society of America meeting in Atlanta at the end of the year where what might be termed the official introduction of the Russell diagram took place. Subsequently he published his paper with the diagram in Popular Astronomy 141414Russell (1914a) and in Nature 151515Russell (1914b, c, d) – the earlier Observatory report noted that there had been slides, but didn’t reproduce them (see Figure 2).
For the moment it is enough to notice that much of astronomy was in flux in this decade, from the source of stellar energy and its relevance to stellar evolution, to the place of the spiral nebulae and structure of the Milky Way. An unexpected discovery by J. C. Kapteyn, of star streaming, announced in 1904 at the St. Louis World’s Fair,161616Kapteyn’s report, ”Statistical Methods in Stellar Astronomy” is published in International Congress of Arts and Sciences, St. Louis, 4, 396-425. The following year he attended the British Association for the Advancement of Science meeting in Capetown, and then published his principal paper, ”Star Streaming,” in Report of the British Association for the Advancement of Science, section A, 257-265. indicated that the motion of stars in the Milky Way was not random. The physical basis for this effect would not be understood until Shapley’s model of the Milky Way provided a basis for knowledge of galactic rotation. But star streaming would provide a central focus of Eddington’s first book, Stellar Movements and the Structure of the Universe, published in 1914171717(Eddington 1914), and in this book was one of the earliest presentations of Russell’s diagram. Russell had displayed his diagram to a crowded meeting the Royal Astronomical Society in June of 1913, and soon thereafter Eddington had asked Russell for a copy. It played an important role in the chapter where Eddington related stellar movements to spectral classes.
In his book Eddington wrestled at length with the observation that early-type stars had distinctly smaller space velocities than K and M stars, and this was after removing effects of solar motion. Ultimately it became an issue of luminosities. In the parallax work, the M stars were the least luminous, whereas in the radial velocity work, the stars were systematically selected by magnitude since the brighter stars were more congenial to spectrographic analysis, and this picked up more highly luminous stars, stars that we now know to be giant stars. “The leading contribution to this problem,” Eddington wrote as the book was in its final stages of preparation, “is the hypothesis of ‘giant’ and ‘dwarf’ stars put forward by Hertzsprung and Russell. They consider each spectral type to have two divisions, which are not in reality closely related.” And there in his book, across from that paragraph, is a typographically very clean rendition of the diagram that Russell had sent him. This was the beginning of the resolution of Eddington’s stellar motions paradox, but it would require both the knowledge of galactic rotation and of stellar populations before the puzzle would really be solved.
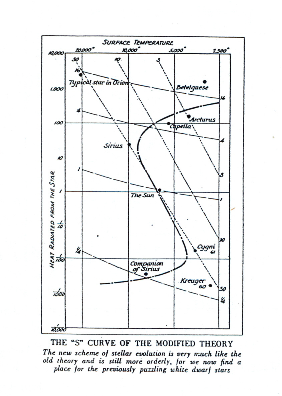
For Russell the diagram provided a convenient way to illustrate his ideas about stellar evolution. In introducing his diagram, he noted that the stellar densities increased from the giant branch down the dwarf sequence, that is, what we call the main sequence. “If that is also the order of advancing age, we are led at once back to Norman Lockyer’s hypothesis that a star is hottest near the middle of its history, and that the redder stars fall into two groups, one of rising and the other of falling temperature,” he wrote. “The giant stars then represent successive stages in the heating up of a body, and must be more primitive the redder they are; the dwarf stars represent successive stages in later cooling, and the reddest of these are the farthest advanced.” Eventually Eddington’s mass-luminosity relation would add evidence for this evolutionary march down the main sequence, but that would come a decade later. When Eddington demonstrated that the main sequence was essentially a mass sequence it seemed to follow that the stars had to move down the main sequence as they gradually converted their active mass into energy. Figure 3 comes from Russell’s 1925 paper 181818Russell (1925), and for the first time includes a white dwarf in the evolutionary track. I think Russell could hardly have imagined then what a powerful evolutionary tool his diagram would eventually become in the hands of Walter Baade and Martin Schwarzschild and their students including Sandage, Arp and Baum.
The issue of the naming of the diagram smoldered for years. This visual tool was for three decades generally referred to as “the Russell diagram,” although in 1933 Bengt Strömgren introduced the designation Hertzsprung-Russell diagram, abbreviated H.-R. in a paper in the Zeitschrift für Astrophysik,191919Strömgren (1933) although in his famous paper there on the hydrogen content of stars he had in the previous year used “Russell diagram.”202020Strömgren (1932) In the 1940s it was renamed the H-R diagram on the style sheet of the Astrophysical Journal, this done by co-editor Subrahmanyan Chandrasekhar to satisfy the relentless hectoring from fellow Chicago faculty member, Gerard Kuiper.212121DeVorkin (2000, p. 329) Chandra, however, had already adopted Strömgren’s designations with a chapter headed “Strömgren’s Interpretation of the Hertzsprung-Russell Diagram” and the use of the abbreviation H.R. within the chapter itself in his 1939 book Stellar Structure.222222Chandrasekhar (1939)
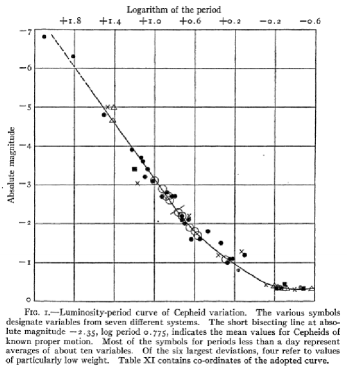
But meanwhile, back in the nineteen-teens, the general concept of dwarf and giant stars was essential in the galactic structure work of Harlow Shapley, Russell’s thesis student, now transplanted to Mount Wilson Observatory. His research at Princeton had included observations and analysis of 90 eclipsing binaries, essentially raising the number of binary star orbits by an order of magnitude. Now, with the 60-inch reflector, he could attack the problem of variable stars in globular clusters, and this led to the calibration of Henrietta Leavitt’s period-luminosity relation. Since none of the field Cepheids in the Milky Way were close enough for trigonometric parallaxes, Shapley was obliged to fall back on statistical parallax using the proper motions of 11 Cepheids, which is a pretty sparse sample. In a paper written in November, 1917, Shapley discussed his calibrated period-luminosity diagram (see Figure 4), beautifully and unbelievably smoothed by averaging triplets of the basic set of eleven Cepheids and thus adjusting their absolute magnitudes.232323Shapley (1918) Earlier, in his graduate studies at Princeton, he had demonstrated that the common assumption that the Cepheids were spectroscopic binary stars led to the ridiculous conclusion that one star was inside the other!242424Shapley (1914)
His counter-suggestion, a pulsation hypothesis, meant that the Cepheids were physical objects. Because Shapley firmly believed that a physical law connected the pulsation periods of these stars and luminosities, he felt his smoothing procedure was fully justified.
Now the insight provided by the Russell diagram, including the giant-dwarf distinction, became critical. The brightest stars in the globular clusters included Cepheid variables and yellow K stars. Shapley recognized that the yellow K stars were giant stars, whose absolute magnitudes were approximately known from giant galactic field stars. This credentialed his calibration of the period luminosity relation by showing that the calibrated luminosity of the Cepheids was comparable to the luminosity of the K giants. Without referring specifically to the Russell diagram, he nevertheless used the understanding it provided for this comparison in another paper of his 1917 series (but which was not published until 1919 because he was overwhelming the Astrophysical Journal with research results).252525Shapley (1919)
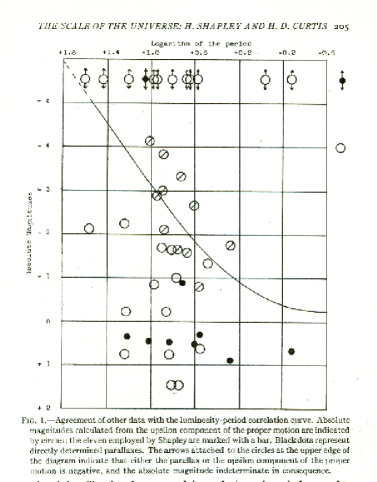
In the celebrated Shapley-Curtis debate sponsored by the National Academy of Sciences in Washington in April, 1920, Heber D. Curtis blasted Shapley’s period-luminosity diagram for the Cepheid variables. That the results of Shapley’s avant-garde statistical parallax technique had not convinced him is clearly shown in his own version of the putative relationship, which looks like the target of a beginner marksman, essentially a scatter diagram (see Figure 5).262626Curtis (1921, pp. 194-217) His diagram suggests he didn’t believe in the period-luminosity relation!
In the revised post-debate version of his 1920 encounter with Curtis, Shapley pushed back, stating that his estimates of the distance scale in the Milky Way did not depend on the calibration of the Cepheid variable stars, but could be established through the giant stars.272727Shapley (1921, pp. 171-193) Of course the understanding of the Russell diagram and the concept of giant and dwarf stars was essential. Shapley wrote:
An argument much insisted upon by Curtis is that the average absolute magnitude of stars around the sun is equal to or fainter than solar brightness, hence, that average stars we see in clusters are also dwarfs. Or, put in a different way, he argues that since the mean spectral class of a globular cluster is of solar type and the average solar-type star near the sun is of solar luminosity, the stars photographed in globular clusters must be of solar luminosity, hence not distant. This deduction, he holds, is in compliance with [the] proposition [of] uniformity throughout the universe. But in drawing the conclusions, Curtis apparently ignores, first, the very common existence of red and yellow giant stars in stellar systems. And second . . . in treating a distant system we naturally first observe its giant stars. . . .
Suppose that an observer, confined to a small valley, attempts to measure the distances of surrounding mountain peaks. Because of the short base line allowed him, his trigonometric parallaxes are valueless except for the nearby hills. On the remote peaks, however, his telescope shows green foliage. First, he assumes approximate botanical uniformity throughout all visible territory. Then he finds the average height of all plants immediately around him (conifers, palms, asters, clovers, etc.) is one foot. Correlating this average height of all plants visible against the sky line on the distant peaks he obtains values of the distances. If, however, he had used some method of distinguishing various floral types, he would not have mistaken pines for asters and obtained erroneous results for the distances of the surrounding mountains.
This critical understanding, then, depended on the efficacy of Russell’s dwarf and giant distinction, which was about to be verified by direct measurement of the giant size of Betelgeuse with a Michelson interferometer attached to the 100-inch reflector at Mt. Wilson. It is well known that in 1920 Shapley no longer believed in the cosmological distances of Curtis’ spiral nebulae, which were based largely on novae. It is not so well known that in 1920 Curtis failed to appreciate the significance of the Russell diagram for understanding the large size of the Milky Way, and the key role of the period-luminosity relation.
In 1924, after Hubble found his first Cepheid in M31, it was to Shapley that he wrote for the calibrated period-luminosity curve.282828E. Hubble to H. Shapley, 19 February 1924, Shapley papers, Harvard University Archives.
Within just a few years both Curtis and Shapley fundamentally changed their views concerning the size of the Milky Way and the nature of the spirals. In 1966 I took my English colleague Michael Hoskin for an oral history interview with Shapley, and we found that the 81-year-old astronomer could scarcely even imagine a time when he thought spirals were not distant galaxies. Tempus fugit! Beware of oral history interviews!
References
- Cannon (1901) Cannon, A. J. 1901, Spectra of Bright Southern Stars Photographed with the 13-inch Boyden Telescope as part of the Henry Draper Memorial, Annals of Harvard College Observatory, 28, 131
- Chandrasekhar (1939) Chandrasekhar, S. 1939, An Introduction to the Study of Stellar Structure (The University of Chicago press)
- Curtis (1921) Curtis, H. D. 1921, The Scale of the Universe, Part II, Bulletin of the National Research Council, 2, 194
- DeVorkin (2000) DeVorkin, D. H. 2000, Henry Norris Russell: Dean of American Astronomers (Princeton University Press)
- Eddington (1914) Eddington, A. S. 1914, Stellar Movements and The Structure of The Universe (Macmillan and Co.)
- Eddington (1922) — 1922, A Century of Astronomy, Nat, 109, 815
- Hertzsprung (1905) Hertzsprung, E. 1905, Zur Strahlung der Sterne. I, Zeitschrift für wissenschaftliche Photographie, Photophysik und Photochemie
- Hertzsprung (1907) — 1907, Zur Strahlung der Sterne. II, Zeitschrift für wissenschaftliche Photographie, Photophysik und Photochemie
- Hertzsprung (1908) — 1908, Letter to E. C. Pickering, 22 July 1908, Pickering papers, Harvard University Archives
- Hertzsprung (1911) — 1911, Über die Verwendung Photographischer Effektiver Wellenlaengen zur Bestimmung von Farbenaequivalenten, Publikationen des Astrophysikalischen Observatoriums zu Potsdam, 22. Bd., 1. Stuck = Nr.63
- Hubble (1924) Hubble, E. 1924, Letter to H.Shapley, 19 February 1924, Shapley papers, Harvard University Archives
- Lang & Gingerich (1979) Lang, K., & Gingerich, O. 1979, Hertzsprung: On the Radiation of Stars, A Source Book in Astronomy and Astrophysics, 1900-1975 (Harvard University Press)
- Maury (1897) Maury, A. C. 1897, Spectra of Bright Stars Photographed with the 11-inch Draper Telescope as part of the Henry Draper Memorial, Annals of Harvard College Observatory, 28, 1
- Nielsen (1964) Nielsen, A. V. 1964, Contributions to the History of the Hertzsprung-Russell Diagram, Centaurus, 9, no.4, 219
- Russell (1913) Russell, H. N. 1913, “Giant” and “dwarf” stars, The Observatory, 36, 324
- Russell (1914a) — 1914a, Relations Between the Spectra and Other Characteristics of the Stars, Popular Astronomy, 22, 275
- Russell (1914b) — 1914b, Relations Between the Spectra and other Characteristics of the Stars. I. Historical, Nat, 93, 227
- Russell (1914c) — 1914c, Relations Between the Spectra and other Characteristics of the Stars. II. Brightness and Spectral Class, Nat, 93, 252
- Russell (1914d) — 1914d, Relations Between the Spectra and other Characteristics of the Stars. III., Nat, 93, 281
- Russell (1925) — 1925, The Problem of Stellar Evolution, Nat, 116, 209
- Schwarzschild (1909) Schwarzschild, K. 1909, Über das System der Fixsterne, Himmel und Erde, 21, 433
- Shapley (1914) Shapley, H. 1914, On the Nature and Cause of Cepheid Variation, ApJ, 40, 448
- Shapley (1918) — 1918, Studies based on the Colors and Magnitudes in Stellar Clusters. VI. On the Determination of the Distances of Globular Clusters, ApJ, 48, 89
- Shapley (1919) — 1919, Studies Based on the Colors and Magnitudes in Stellar Clusters. IX. Three Notes on Cepheid Variation, ApJ, 49, 24
- Shapley (1921) — 1921, The Scale of the Universe, Part I, Bulletin of the National Research Council, 2, 171
- Strömgren (1932) Strömgren, B. 1932, The Opacity of Stellar Matter and the Hydrogen Content of the Stars, ZAp, 4, 118
- Strömgren (1933) — 1933, On the Interpretation of the Hertzsprung-Russell-Diagram. Mit 4 Abbildungen, ZAp, 7, 222