Electronic structure, phonon spectra and electron-phonon interaction in HfB2
Abstract
The electronic structure, Fermi surface, angle dependence of the cyclotron masses and extremal cross sections of the Fermi surface, phonon spectra, electron-phonon Eliashberg and transport spectral functions, temperature dependence of electrical resistivity of the HfB2 diboride were investigated from first principles using the fully relativistic and full potential linear muffin-tin orbital methods. The calculations of the dynamic matrix were carried out within the framework of the linear response theory. A good agreement with experimental data of electron-phonon spectral functions, electrical resistivity, cyclotron masses and extremal cross sections of the Fermi surface was achieved.
pacs:
75.50.Cc, 71.20.Lp, 71.15.RfI Introduction
Ceramics based on transition metal borides, nitrides, and carbides have extremely high melting points (2500 ∘C) and are referred to as ultra-high temperature ceramics. Upadhya et al. (1997); Fahrenholtz et al. (2007) Among them, diborides such as ZrB2 and HfB2 have a unique combination of mechanical and physical properties: high melting points (3000 ∘C); high thermal and electrical conductivity; chemical inertness against molten metals; great thermal shock resistance. Upadhya et al. (1997); Fahrenholtz et al. (2007); Mroz (1994) Thus, although carbides typically have the highest melting points (3500 ∘C), the diborides ZrB2 and HfB2 are more attractive candidates for high-temperature thermomechanical structural applications at temperatures 3000 ∘C. Upadhya et al. (1997); Fahrenholtz et al. (2007) Potential applications include thermal protective structures for leading-edge parts on hypersonic re-entry space vehicles, Upadhya et al. (1997); Brown (1997) propulsion systems, Upadhya et al. (1997); Brown (1997) furnace elements, Kuwabara (2002) refractory crucibles, Kuwabara (2002) and plasma-arc electrodes. Kuwabara (2002); Norasetthekul et al. (1999)
The discovery of superconductivity in MgB2 at 39 K by Akimitsu Nagamatsu et al. (2001) has lead to booming activity in the physics community and activated a search for superconductivity in other diborides. Natural candidates for this search are AB2-type light metal diborides (A = Li, Be, Al). However, up to now superconductivity has not been reported in the majority of these compounds. Gasparov et al. (2001) Only very recently has superconductivity below 1 K ( = 0.72 K) been reported in BeB2.75. Young et al. (2001) According to Ref. Buzea and Yamashita, 2001 no superconducting transition down to 0.42 K has been observed in powders of diborides of transition metals (A = Ti, Zr, Hf, V, Ta, Cr, Mo, U). Only NbB2 is expected to superconduct with a rather low transition temperature ( 1 K), and contradictory reports about superconductivity up to =9.5 K in TaB2 can be found in Ref. Buzea and Yamashita, 2001. Finally, the reported =7 K in ZrB2 encourages further studies of these diborides. Gasparov et al. (2001)
Presently, a number of experimental studies exist dealing with the physical properties of HfB2 such as thermal and electrical properties, Wuchina et al. (2004); Zagozdzon-Wosik et al. (2006); Zhang et al. (2011a); Mallik et al. (2012) mechanical, Dub et al. (2011) and elastic properties, Wiley et al. (1969) the de Haas-van Alphen (dHvA) measurements of the Fermi surface, Pluzhnikov et al. (2007) optical ellipsometry measurements, Yang et al. (2007) magnetic susceptibility, Grechnev et al. (2009); Fedorchenko et al. (2009) and NMR measurements. Lue and Lai (2005) First-principles calculations of the electronic structure of diborides including HfB2 have been also presented. Vajeeston et al. (2001); Zhang et al. (2008); Grechnev et al. (2009); Fedorchenko et al. (2009); Zhang and X.-L.Cheng (2010); Zhang et al. (2010); Deligoz et al. (2010); Zhang et al. (2011b); Li et al. (2011); Lawson et al. (2011)
Lawson et al. Lawson et al. (2011) studied the electronic structure and lattice properties of HfB2 and ZrB2 in a frame of the density functional theory (DFT). Lattice constants and elastic constants were determined. Computations of the electronic density of states, band structure, electron localization function, etc. show the diverse bonding types that exist in these materials. They also suggest the connection between the electronic structure and the superior mechanical properties. Lattice dynamical effects were considered, including phonon dispersions, vibrational densities of states, and specific heat curves. Point defect (vacancies and antisites) structures and energetics are also presented. Vajeeston et al. Vajeeston et al. (2001) investigated the electronic structure of HfB2 using the tight-bonding linear muffin-tin orbital method, they claimed that metal-metal and metal-boron interactions are less significant than the covalent interaction of boron atoms. The bonding nature, elastic property and hardness were investigated by Zhang et al. Zhang et al. (2008) for HfB2 as well as ZrB2 using the first principles total-energy plane-wave pseudopotential (PW-PP) method. They also reported the elastic anisotropy, Poisson’s ratio, hardness and Debye temperature in HfB2 and ZrB2. Deligoz et al. Deligoz et al. (2010) investigated the structural parameters (the lattice constants and bond length) and phonon dispersion relations in HfB2 and TaB2 compounds using the first-principles total energy calculations. The secondary results on the temperature-dependent behavior of thermodynamical properties such as entropy, heat capacity, internal energy, and free energy were also presented. Zhang et al. Zhang et al. (2010) investigated the ideal tensile and shear strengths of TiB2, ZrB2 and HfB2 by first-principles stress-strain calculations. Due to the nonlinearity of the stress response at large stains, the plastic anisotropy cannot be derived from elastic constants. Based on the relative stiffness of boron hexagons, a bond length indicator was obtained to characterize the preference for basal or prismatic slip in diborides. Zhang et al. Zhang and X.-L.Cheng (2010); Zhang et al. (2011b) investigated theoretically the pressure dependence of elastic constants, bulk modulus and elastic anisotropy of HfB2. The pressure dependence of structural property shows that the effect of pressure is little on the structure of HfB2. They find high pressure greatly changes the profile of the density of states (DOS), but it hardly changes the DOS value at Fermi level. Meanwhile, the Mulliken population analyses are investigated. It was suggested that as the pressure increases, a number of charge transfer from Hf to B atoms. Through quasi-harmonic Debye model, the variations of the Debye temperature, heat capacity and thermal expansion with pressure and temperature were obtained and discussed.
Fedorchenko and Grechnev with coauthors Fedorchenko et al. (2009); Grechnev et al. (2009) measured the temperature dependences of the magnetic susceptibility and its anisotropy for single crystals of transition-metal diborides MB2 (M = Sc, Ti, V , Zr, Hf) in the temperature interval 4.2 - 300 K. A transition into the superconducting state was not found in any of the diborides studied, right down to liquid-helium temperature. It was found that the anisotropy is weakly temperature-dependent, a nonmonotonic function of the filling of the hybridized conduction band. First-principles calculations of the electronic structure of diborides and the values of the paramagnetic contributions spin and Van Vleck to their susceptibility show that the behavior of the magnetic anisotropy is due to the competition between Van Vleck paramagnetism and orbital diamagnetism of the conduction electrons. Authors of Ref. Wuchina et al., 2004 determined the thermal conductivity, thermal expansion, Young’s modulus, flexural strength, and brittle-plastic deformation transition temperature for HfB2 as well as for HfC0.98, HfC0.76, and HfN0.92 ceramics. The thermal conductivity of modified HfB2 exceeded that of the other materials by a factor of 5 at room temperature and by a factor of 2.5 at 820 ∘C. The transition temperature of HfB2 was 1100 ∘C. Pure HfB2 was found to have a strength of 340 MPa in 4 point bending, that was constant from room temperature to 1600 ∘C, while a HfB2 + 10% HfCx had a higher room temperature bend strength of 440 MPa, but that dropped to 200 MPa at 1600 ∘C. The results of the theoretical modeling suggest that HfB2 should survive the high thermal stresses generated during the nozzle test primarily because of its superior thermal conductivity. Yang et al. Yang et al. (2007) used in situ spectroscopic ellipsometry to analyze HfB2 thin films. By modeling the film optical constants with a Drude-Lorentz model, the film thickness, surface roughness, and electrical resistivity were measured. By modeling the real-time data in terms of film thickness and surface roughness, the film nucleation and growth morphology were determined as a function of substrate type, substrate temperature, and precursor pressure. Li et al. Li et al. (2011) studied the thermodynamics of the oxidation of HfB2 at temperatures of 1000, 1500, 2000, and 2500 K using volatility diagrams. They found that HfB2 exhibits oxidation behavior similar to ZrB2. Zhang et al. Zhang et al. (2011a) investigated experimentally the thermal and electrical transport properties of various spark plasma-sintered HfB2 and ZrB2 based polycrystalline ceramics over the 298-700 K temperature range. Measurements of thermal diffusivity, electrical resistivity, and Hall coefficient were reported, as well as the derived properties of thermal conductivity, charge carrier density, and charge carrier mobility. Hall coefficients were negative confirming electrons as the dominant charge carrier. A Wiedemann-Franz analysis confirms the dominance of electronic contributions to heat transport. The thermal conductivity was found to decrease with increasing temperature. The properties of the Fermi surface of ScB2, ZrB2, and HfB2 single crystals were studied by Pluzhnikov et al. Pluzhnikov et al. (2007) using the de Haas-van Alphen effect. The angular dependences of the frequencies of the dHvA oscillations in the planes (), (), and (0001) and the values of their effective cyclotron masses were measured. The frequencies of the oscillations found lie in the interval T and the measured cyclotron masses lie in the range .
Despite a lot of publications, there are still many open questions related to the electronic structure and physical properties of HfB2 diboride. The most theoretical efforts were devoted to the lattice and mechanical properties of HfB2. There is no theoretical expalanation of the Fermi surface as well as angle dependence of the cyclotron masses and extremal cross sections of the Fermi surface, electron-phonon interaction and electrical resistivity in HfB2. The aim of this work is a complex investigation of the electronic structure, Fermi sutface, angle dependence of the cyclotron masses and extremal cross sections of the Fermi surface, phonon spectra, electron-phonon Eliashberg and transport spectral functions, and temperature dependence of electrical resistivity of the HfB2 diboride. The paper is organized as follows. Section II presents the details of the calculations. Section III is devoted to the electronic structure as well as the Fermi surface, angle dependence of the cyclotron masses and extremal cross sections of the Fermi surface, phonon spectra, electron-phonon interaction and electrical resistivity using the fully relativistic and full potenrial LMTO band structure methods. The results are compared with available experimental data. Finally, the results are summarized in Sec. IV.
II Computational details
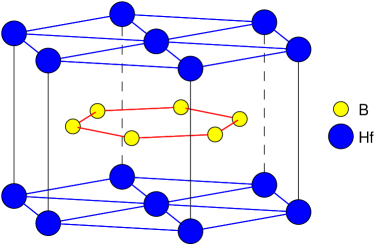
Most known transition-metal (M) diborides MB2 are formed by group III-VI transition elements (Sc, Ti, Zr, Hf, V, Nb, and others) and have a layered hexagonal C32 structure of the AlB2-type with the space group symmetry (number 191). It is simply a hexagonal lattice in which closely-packed transition metal layers are present alternative with graphite-like B layers (Fig. 1). These diborides cannot be exactly layered compounds because the inter-layer interaction is strong even though the M layers alternate with the B layers in their crystal structure. The boron atoms lie on the corners of hexagons with the three nearest neighbor boron atoms in each plane. The M atoms lie directly in the centers of each boron hexagon, but midway between adjacent boron layers. Each transition metal atom has twelve nearest neighbor B atoms and eight nearest neighbor transition metal atoms (six are on the metal plane and two out of the metal plane). There is one formula unit per primitive cell and the crystal has simple hexagonal symmetry (). By choosing appropriate primitive lattice vectors, the atoms are positioned at Hf (0,0,0), B (), and B () in the unit cell. The distance between Hf-Hf is equal to . This structure is quite close packed, and can be coped with efficiently and accurately by the atomic sphere approximation method. However, for precise calculation of the phonon spectra and electron-phonon interaction, a full potential approximation should be used.
The Eliashberg function (the spectral function of the electron-phonon interaction) expressed in terms of the phonon linewidths has the form Allen (1972)
| (1) |
The line-widths characterize the partial contribution of each phonon:
| (2) |
The electron-phonon interaction constant is defined as:
| (3) |
It can also be expressed in terms of the phonons line-widths:
| (4) |
were N() is the electron density of states per atom and per spin on the Fermi level () and is the electron-phonon interaction matrix element. The double summation over Fermi surface in Eq.(2) was carried out on dense mesh (793 point in the irreducible part of the BZ)
Calculations of the electronic structure and physical properties of the HfB2 diborides were performed using fully relativistic LMTO method Antonov et al. (1995) with the experimentally observed lattice constants: =3.141 Å and =3.47 Å for HfB2. Stuemke and Petzow (1975) For the calculation of the phonon spectra and electron-phonon interaction a scalar relativistic FP-LMTO method Savrasov and Savrasov (1996) was used. In our calculations we used the Perdew-Wang Perdew and Wang (1992) parameterization of the exchange-correlation potential in general gradient approximation. BZ integrations were performed using the improved tetrahedron method. Blöchl et al. (1994) Phonon spectra and electron-phonon matrix elements were calculated for 50 points in the irreducible part of the BZ using the linear response scheme developed by Savrasov. Savrasov and Savrasov (1996) The 5 and 5 semi-core states of HfB2 were treated as valence states in separate energy windows. Variations in charge density and potential were expanded in spherical harmonics inside the MT sphere as well as 2894 plane waves in the interstitial area with 88.57 Ry cut-off energy for HfB2. As for the area inside the MT spheres, we used 3k LMTO basis set energy (-0.1, -1, -2.5 Ry) with one-center expansions inside the MT-spheres performed up to = 6.
III Results and discussion
III.1 Energy band structure

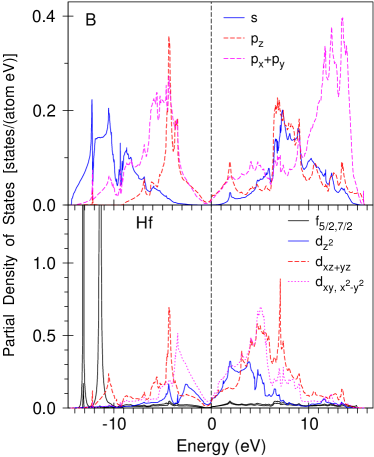
Figure 2 presents the energy band structure and total density of states of HfB2. The partial DOSs HfB2 are shown in Fig. 3. Our results for the electronic structure of HfB2 are in agreement with earlier calculations. Fedorchenko et al. (2009); Deligoz et al. (2010); Fu et al. (2010) A common feature for all transition metal diborides is the deep DOS minimum (pseudo-gap) at the Fermi energy separating the valence band and the conduction band. According to Pasturel et al., Pasturel et al. (1985) a pseudo-gap arises because of a strong chemical interaction. The M-B covalent bonding is believed to be responsible for this effect. The Hf 4 states in HfB2 are situated at the 14.5 eV to 10 eV. The Hf 5 states are the dominant features in the interval from 12.5 eV to 14 eV. These tightly bound states show overlap with B 2 and, to a lesser extent, with B 2 states both above and below , implying considerable covalency. Higher-energy states between 9 eV and 17 eV above appear to arise from Hf 6 and 6 states hybridized with B 2 states. The crystal field at the Hf site ( point symmetry) causes the splitting of Hf orbitals into a singlet () and two doublets ( and ) and ( and ). The crystal field at the B site ( point symmetry) causes the splitting of B orbitals into a singlet () and a doublet ( and ). B states occupy a bottom of valence band between 14.6 eV and 3.0 eV and hybridize strongly with B and and Hf and states located at 12.5 eV to 0.5 eV. B and occupied states are located between 12.5 eV and 0.5 eV. B states occupied a smaller energy interval from 7.5 eV to 0.5 eV with a very strong and narrow peak structure at around 4 eV.
III.2 Fermi surface
The Fermi surfaces (FS) of ScB2, HfB2 and HfB2, were studied by Pluzhnikov et al. Pluzhnikov et al. (2007) using the dHvA effect.
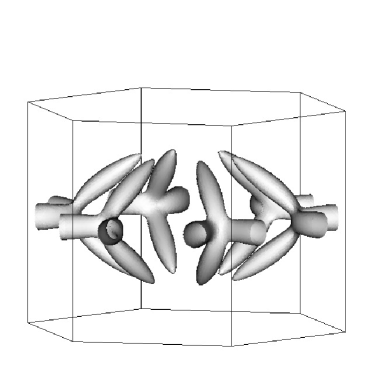
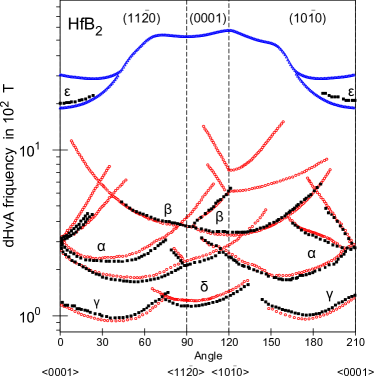
Theoretical calculations show a ring-like electron FS around the symmetry point (Fig. 4) and of a wrinkled dumbell-like hole FS at the A point (Fig. 5) in HfB2. The electron and hole Fermi surfaces have threefold and sixfold symmetries, respectively. Figure 6 shows the calculated cross section areas in the plane perpendicular direction and crossed symmetry point for hole FS (upper panel) and crossed point for electron FS (lower panel) of HfB2.
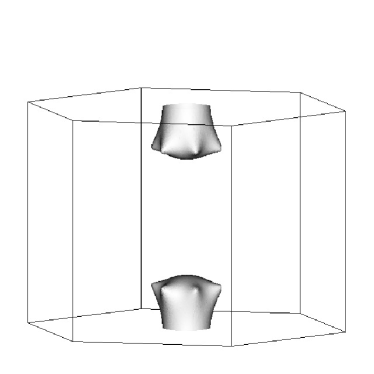
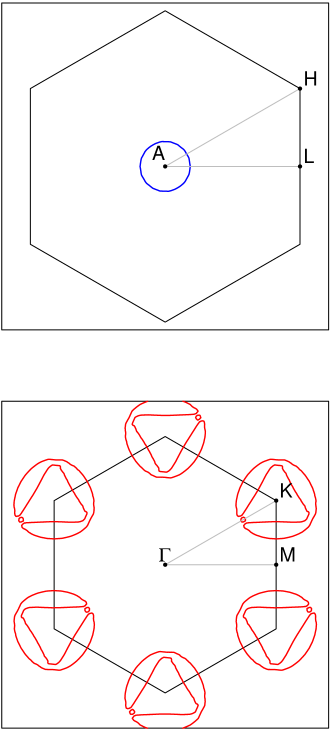
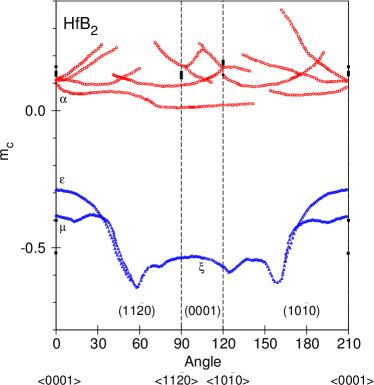
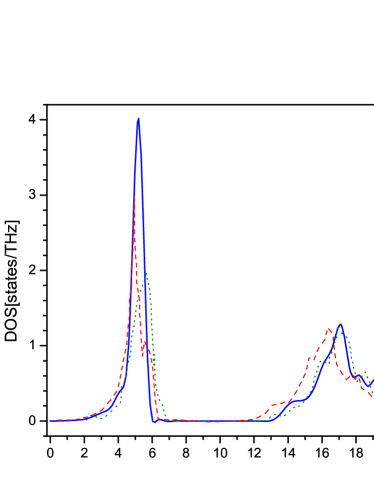
Figure 7 represents angular variations of the experimentally measured dHvA frequencies Pluzhnikov et al. (2007) for HfB2 in comparison with the first-principle calculations for field direction in the (), (), and (0001) planes. The observed frequencies of , , , and oscillations belong to electron FS around the point. The , , and orbits belong to the hole wrinkled dumbbell FS. The frequencies have four branches at the () plane and three branches at the () plane. The lower frequencies have one branch in both the planes. The theory reasonably well reproduces the frequencies measured experimentally. However, there are still some discrepancies. The orbits have an additional two branches at higher frequencies at the (), and (0001) planes not observed experimentally. The experiment for high frequencies detected only orbits in vicinity of the direction in HfB2. We found the , and orbits similar to the corresponding orbits observed experimentally in isostructural and isovalent ZrB2. Pluzhnikov et al. (2007) These orbits have not been detected in the dHvA experiment. Pluzhnikov et al. (2007) One of the possible reasons for that is the relatively large cyclotron masses for these orbits. Figure 8 shows the theoretically calculated angular dependence of the cyclotron masses () and the experimentally measured masses () for high symmetry directions in HfB2. The cyclotron effective masses were determined from the temperature dependences of the amplitudes of the dHvA oscillations. The cyclotron masses for the , , and orbits in HfB2 are much higher than the corresponding low-frequency oscillations , , and . The fact that the masses for electron Fermi surface are significantly larger than for the hole Fermi surface may explain a negative experimentally measured Hall coefficient Zhang et al. (2011a) and confirms electrons as the dominant charge carriers in HfB2. A Wiedemann-Franz analysis also indicate the dominance of electronic contributions to heat transport. Zhang et al. (2011a)
We note that band cyclotron effective masses are renormalized by the electron-phonon interaction , where is the constant of the electron-phonon interaction. By comparing the experimentally measured cyclotron masses with band masses we can estimate the . It is strongly varied on the orbit type and magnetic direction. We estimate the constant of the electron-phonon interaction to be equal to 0.18-0.23 for the orbits and 0.36 and 0.75 for the and orbits, respectively, with H. For the and directions the for the orbits are reduced, respectively, to 0.10 and 0.12 values.
III.3 Phonon spectra
The unit cell of HfB2 contains three atoms, which gives in general case a nine phonon branches. Figure 9 shows theoretically calculated phonon density of state for HfB2 (full blue curve). The DOS for HfB2 can be separated into three distinct regions. Based on our analysis of relative directions of eigenvectors for each atom in unit cell, we find that the first region (with a peak in phonon DOS at 5.2 THz) is dominated by the motion of Hf. This region belongs to the acoustic phonon modes. The second wide region (14-20 THz) results from the coupled motion of Hf and the two B atoms in the unit cell. The , , phonon modes (see Table 1) lie in this area. The phonon DOS in the third region extends from 22 THz to 26 THz. This is due to the movement of boron atoms and is expected since boron is lighter than Hf. The covalent character of the B-B bonding is also crucial for the high frequency of phonons. The in-plane E2g mode belongs to this region. The second and third regions represent optical phonon modes in crystals. The most significant feature in the phonon DOS is a gap around 6-13 ThZ. This gap is a consequence of the large mass difference between B(10.8 a.u.) and Hf (178.49 a.u.), which leads to decoupling of the transition metal and boron vibrations.
| reference | ||||
|---|---|---|---|---|
| our results | 13.76 | 15.03 | 17.12 | 25.17 |
| SIESTADeligoz et al. (2010) | 14.10 | 15.19 | 15.87 | 24.49 |
| VASPLawson et al. (2011) | 13.34 | 14.00 | 16.40 | 24.16 |
| ABINITLawson et al. (2011) | 12.92 | 13.85 | 16.01 | 23.59 |
Currently, there are no data concerning the experimentally measured phonon DOS in HfB2. So we compare our results with theoretically calculated phonon DOS by Deligoz et al. Deligoz et al. (2010) and Lawson et al. Lawson et al. (2011) (Fig. 9 and Table 1). Calculations of Deligoz et al. Deligoz et al. (2010) were based on the density functional formalism and generalized gradient approximation. They used the Perdew-Burke-Ernzerhof functional Perdew et al. (1996) for the exchange-correlation energy as it is implemented in the SIESTA code. Ordejon et al. (1996) This code calculates the total energies and atomic Hellmann-Feynman forces using a linear combination of atomic orbitals as the basis set. The basis set consists of finite range pseudoatomic orbitals of the Sankey-Niklewsky type Sankey and Niklewski (1989) generalized to include multiplezeta decays. The interactions between electrons and core ions are simulated with the separable Troullier-Martins N. Troullier (1991) normconserving pseudopotentials. In other words, they used the so-called ”frozen phonon” technique and built an optimized rhombohedral supercell with 36 atoms. This method is inconvenient for calculating phonon spectra for small q-points as well as for compounds with large number of atoms per unit cell. Lawson et al. Lawson et al. (2011) used two different codes to calculated the phonon spectra. VASP, the supercell method, based un the projected augmented wave potentials. Second method, ABINIT, used Fritz Haber Institute pseudopotentials in the Troulliers-Martin form. VASP results of Lawson et al. Lawson et al. (2011) is slightly closer to our calculation with respect to ABINIT data. There is a good agreement between our calculations and the results of Deligoz et al. Deligoz et al. (2010) in a shape and energy position of the second peak in the phonon DOS. There is an energy shift towards smaller energies of the first and third peaks of the Lawson et al. Lawson et al. (2011) calculations in comparison with the Deligoz et al. Deligoz et al. (2010) data with our results are just in between these two calculations.
III.4 Electron-phonon interaction
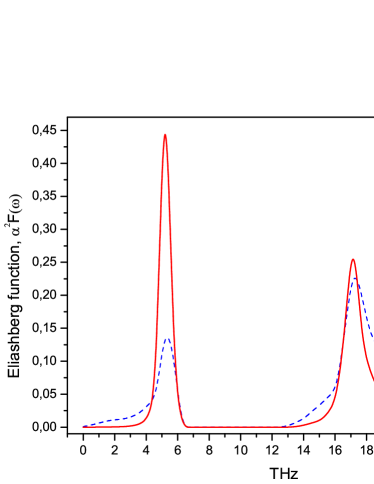
Figure 10 shows theoretically calculated Eliashberg functions for HfB2 as well as electron-phonon prefactor (definition of this function is merely ratio . There is no difference between main peaks positions of phonon spectra and electron-phonon coupling function. Electron-phonon prefactor has three peaks: 5.2 THz, 17.1 THz and 21.3 THz (the corresponding peaks in the phonon DOS are situated at the 5.2 THz, 17.1 THz, and 23.4 THz frequencies). The has strongly varying character. Therefore the electron-phonon coupling can not be factorized into independent electronic and phonon parts. The matrix element of electron-phonon interaction cannot be represented in form and hence well known McMillan approximation McMillan (1968) is not valid for HfB2. By integrating the Eliashberg function we estimate the averaged electron-phonon constants =0.17. The constant of the electron-phonon interaction also can be estimated by comparison the theoretically calculated DOS at the Fermi level with the electron specific heat coefficient . , where =1.0 mJ·mole-1K-2 for HfB2. Tyan et al. (1969) HfB2 possesses quite small value of the DOS at the Fermi level of 0.4 states/(cell eV), it gives the theoretically calculated =0.8 mJ·mole-1K-2 and =0.2 with qualitative agreement with =0.17.
III.5 Electrical resistivity
In the pure metals (excluding low-temperature region), the electron-phonon interaction is the dominant factor governing electrical conductivity of the substance. Using lowest-order variational approximation, the solution for the Boltzmann equation gives the following formula for the temperature dependence of :
| (5) |
where, the subscript specifies the direction of the electrical current. In our work, we investigate two direction: [0001] (c-axis or z direction) and [100] (a-axis or x-direction). is the average square of the component of the Fermi velocity, .
Mathematically, the transport function differs from only by an additional factor , which preferentially weights the backscattering processes.
| (6) |
| (7) |
| (8) |
The low-temperature electrical resistivity is the result of electron-electron interaction, size effects, scattering on impurities, etc., however, for high temperatures it is necessarily to take into account the effects of anharmonicity and the temperature smearing of the Fermi surface. In our calculations =654.4 K for -axis, and 679.9 for -axis for HfB2.
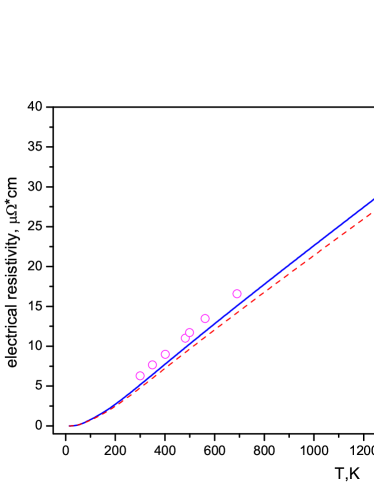
Figure 11 represents the theoretically calculated temperature dependence of electrical resistivity of HfB2 for the direction (full blue curve) and the basal direction (dashed red curve) and experimental measurements for polycrystalline HfB2. Gasch (2011) Specimen of ceramic HB2 was obtained by spark plasma sintering method and had good ratio of experimental and theoretically calculated density Our results are in good agreement with the experiment. The small discrepancy does not exceed accuracy of calculation. We obtained anisotropy ratio of electrical resistivity at T=300K: = 1.079. Actually this fact indicates that for HfB2 anisotropy is not clearly expressed.
IV Summary
We have studied the electronic structure and physical properties of HfB2 using fully relativistic and full potential linear muffin-tin orbital methods. We study the electron and phonon subsystems as well as the electron-phonon interaction in this compound.
We investigated the Fermi surface, angle dependence of the cyclotron masses, and extremal cross sections of the Fermi surface of HfB2 in details. Theoretical calculations show a ring-like electron FS in HfB2 around the symmetry point and a wrinkled dumbbell-like hole FS at the A point. Theory reproduces the experimentally measured dHvA frequencies in HfB2 reasonably well. We found that masses for low-frequency oscillations , , , and are less than 0.25. Masses for high-frequency oscillations , , and lie in the range from 0.3 to 0.65 . The experiment for high frequencies detected only orbits in vicinity of the direction in HfB2. We found the , and orbits similar to the corresponding orbits observed experimentally in isostructural and isovalent ZrB2. These orbits have not been detected in the dHvA experiment. One of the possible reasons for that is the relatively large cyclotron masses for these orbits.
Calculated phonon spectra and phonon DOSs for HfB2 is in good agreement with previous calculations. We did not found regions with high electron-phonon interaction or phonon dispersion curves with soft modes in HfB2. This is in agreement with the fact that no trace of superconductivity was found in these borides. The averaged electron-phonon interaction constant was found to be rather small =0.17 for HfB2. We calculated the temperature dependence of the electrical resistivity in HfB2 in the lowest-order variational approximation of the Boltzmann equation. We found rather small anisotropic behavior of the electrical resistivity in HfB2 to be in good agreement with experimental observation.
Acknowledgments
This work was supported by the National Academy of Sciences of Ukraine in the framework of the State Target Scientific and Technology Program ”Nanotechnology and Nanomaterials” for 2010-2014 (No. 0277092303) and Implementation and Application of Grid Technologies for 2009-2013 (No. 0274092303).
References
- Upadhya et al. (1997) K. Upadhya, J.-M. Yang, and W. P. Hoffmann, Am. Ceram. Soc. Bull. 76, 51 (1997).
- Fahrenholtz et al. (2007) W. G. Fahrenholtz, G. E. Hilmas, I. G. Talmy, and J. A. Zaykoski, J. Am. Ceram. Soc. 90, 1347 (2007).
- Mroz (1994) C. Mroz, Am. Ceram. Soc. Bull. 73, 141 (1994).
- Brown (1997) A. S. Brown, Aerospace Am. 35, 20 (1997).
- Kuwabara (2002) K. Kuwabara, Bull. Ceram. Soc. Jpn. 37, 267 (2002).
- Norasetthekul et al. (1999) S. Norasetthekul, P. T. Eubank, W. L. Bradley, B. Bozkurt, and B. Stucker, J. Mater. Sci. 34, 1261 (1999).
- Nagamatsu et al. (2001) J. Nagamatsu, N. Nakagawa, T. Muranaka, Y. Zenitani, and J. Akimitsu, Nature (London) 410, 63 (2001).
- Gasparov et al. (2001) V. A. Gasparov, N. S. Sidorov, I. I. Zverkova, and M. P. Kulakov, JETP Lett. 73, 532 (2001).
- Young et al. (2001) D. P. Young, P. W. Adams, J. Y. Chan, and F. R. Fronczek, preprint cond-mat/0104063 (2001).
- Buzea and Yamashita (2001) C. Buzea and T. Yamashita, Supercond. Sci. Technol. 14, R115 (2001).
- Wuchina et al. (2004) E. Wuchina, M. Opeka, S. Causey, K. Buesking, J. Spain, A. Cull, J. Routbort, and F. Guitierrez-Mora, J. Materials Science 39, 5939 (2004).
- Zagozdzon-Wosik et al. (2006) W. Zagozdzon-Wosik, I. Rusakova, C. Darne, Z.-H. Zhang, P. V. D. Heide, and P. Majhi, J. Microscopy-oxford 223, 227 (2006).
- Zhang et al. (2011a) L. Zhang, D. A. Pejakovic, J. Marschall, and M. Gasch, J. American Ceramic Society 94, 2562 (2011a).
- Mallik et al. (2012) M. Mallik, A. J. Kailath, K. K. Ray, and R. Mitra, J. Europ. Ceramic Society 32, 2545 (2012).
- Dub et al. (2011) S. N. Dub, A. A. Goncharov, S. S. Ponomarev, V. B. Filippov, G. N. Tolmacheva, and A. V. Agulov, Journal Of Superhard Materials 33, 151 (2011).
- Wiley et al. (1969) D. Wiley, W. R. Manning, and O. Hunter, J. Less-common Metals 18, 149 (1969).
- Pluzhnikov et al. (2007) V. B. Pluzhnikov, I. V. Svechkarev, A. V. Dukhnenko, A. V. Levchenko, V. B. Filippov, and A. Chopnik, Low Temp. Phys. 33, 350 (2007).
- Yang et al. (2007) Y. Yang, S. Jayaraman, B. Sperling, D. Y. Kim, G. S. Girolami, and J. R. Abelson, J. Vacuum Science and Technology A 25, 200 (2007).
- Grechnev et al. (2009) G. E. Grechnev, A. V. Fedorchenko, A. V. Logosha, A. S. Panfilov, I. V. Svechkarev, V. B. Filippov, A. B. Lyashchenko, and A. V. Evdokimova, J. Appl. Crystallogr. 481, 75 (2009).
- Fedorchenko et al. (2009) A. V. Fedorchenko, G. E. Grechnev, A. S. Panfilov, A. V. Logosha, I. V. Svechkarev, V. B. Filippov, A. B. Lyashchenko, and A. V. Evdokimova, Low Temp. Phys. 35, 82 (2009).
- Lue and Lai (2005) C. S. Lue and W. J. Lai, Phys. status solidi B 242, 1108 (2005).
- Vajeeston et al. (2001) P. Vajeeston, P. Ravindran, C. Ravi1, and R. Asokamani, Phys. Rev. B 63, 045115 (2001).
- Zhang et al. (2008) X. Zhang, X. Luo, J. Han, J. Li, and W. Han, Comput. Mat. Sci. 44, 411 (2008).
- Zhang and X.-L.Cheng (2010) J.-D. Zhang and X.-L.Cheng, Physica B 405, 3532 (2010).
- Zhang et al. (2010) X. Zhang, X. Luo, J. Li, P. Hu, and J. Han, Scripta Materialia 62, 625 (2010).
- Deligoz et al. (2010) E. Deligoz, K. Colakoglu, and Y. O. Ciftci, Computational Materials Science 47, 875 (2010).
- Zhang et al. (2011b) J.-D. Zhang, X.-L. Cheng, and D.-H. Li, J. Alloys Comp. 509, 9577 (2011b).
- Li et al. (2011) H. Li, L. Zhang, Q. Zeng, and L. Cheng, Journal Of Phase Equilibria And Diffusion 32, 422 (2011).
- Lawson et al. (2011) J. W. Lawson, C. W. Bauschlicher, and M. S. Daw, J. American Ceramic Society 94, 3494 (2011).
- Allen (1972) P. B. Allen, Phys. Rev. B 6, 2577 (1972).
- Antonov et al. (1995) V. N. Antonov, A. Y. Perlov, A. P. Shpak, and A. N. Yaresko, J. Magn. Magn. Mater. 146, 205 (1995).
- Stuemke and Petzow (1975) M. Stuemke and G. Petzow, Zeitschrift fuer Metallkunde 66, 292 (1975).
- Savrasov and Savrasov (1996) S. Y. Savrasov and D. Y. Savrasov, Phys. Rev. B 54, 16470 (1996).
- Perdew and Wang (1992) J. Perdew and Y. Wang, Phys. Rev. B 45, 13244 (1992).
- Blöchl et al. (1994) P. E. Blöchl, O. Jepsen, and O. K. Andersen, Phys. Rev. B 49, 16223 (1994).
- Fu et al. (2010) H. Fu, M. Teng, X. Hong, and Y. L. aand T. Gao, Physica B 405, 846 (2010).
- Pasturel et al. (1985) A. Pasturel, C. Colinet, and P. Hichter, Physica B 132, 177 (1985).
- Perdew et al. (1996) J. P. Perdew, K. Burke, and M. Ernzerhof, Phys. Rev. Lett. 77, 3865 (1996).
- Ordejon et al. (1996) P. Ordejon, E. Artacho, and J. M. Soler, Phys. Rev. B 53, R10441 (1996).
- Sankey and Niklewski (1989) O. F. Sankey and D. J. Niklewski, Phys. Rev. B 40, 3979 (1989).
- N. Troullier (1991) J. M. N. Troullier, Phys. Rev. B 43, 1993 (1991).
- McMillan (1968) W. L. McMillan, Phys. Rev. B 167, 331 (1968).
- Tyan et al. (1969) Y. S. Tyan, L. E. Toth, and Y. A. Chang, J. Phys. Chem. Solids 30, 785 (1969).
- Gasch (2011) M. Gasch, J. Am. Ceram. Soc. 94, 2562 (2011).