Multiscale model for the effects of adaptive immunity suppression on the viral therapy of cancer
Abstract
Oncolytic virotherapy - the use of viruses that specifically kill tumor cells - is an innovative and highly promising route for treating cancer. However, its therapeutic outcomes are mainly impaired by the host immune response to the viral infection. In the present work, we propose a multiscale mathematical model to study how the immune response interferes with the viral oncolytic activity. The model assumes that cytotoxic T cells can induce apoptosis in infected cancer cells and that free viruses can be inactivated by neutralizing antibodies or cleared at a constant rate by the innate immune response. Our simulations suggest that reprogramming the immune microenvironment in tumors could substantially enhance the oncolytic virotherapy in immune-competent hosts. Viable routes to such reprogramming are either in situ virus-mediated impairing of CD T cells motility or blockade of B and T lymphocytes recruitment. Our theoretical results can shed light on the design of viral vectors or new protocols with neat potential impacts on the clinical practice.
1 Introduction
Recently, cancer replaced heart disease as the leading cause of death among the United States citizens younger than 85 years [1] and will probably become the leading one in some other parts of the world within a few years [2]. In the past decades we have witnessed an extraordinary progress on imaging, diagnosis, and research in the molecular biology of cancer, but its medical treatment, especially of tumors at unresectable locations, metastasis or recurrent neoplasias, still has many limitations [3]. Even the advent of molecularly targeted therapies has led to modest improvements for the majority of patients with advanced cancers [4]. Due to the complexity of tumor growth pathways, increasing resistance and tumor progression still is the rule for patients with metastatic disease. Hence, new pathway-independent therapeutic agents represent a central alternative. Among them, oncolytic viruses are unique since they can be amplified by infected cells, armed to selectively infect and kill cancer cells and induce an immune response against the tumor [5].
Several oncolytic viruses exhibiting safety and selective replication in tumors are under current evaluation in pre-clinical and clinical trails [6, 7]. However, durable objective responses are relatively rare because their in vivo antitumor efficiencies are mainly impaired by the host immune response [8] that prevents successful virus spreading and tumor remission [9]. In a clinical context, the therapeutic outcome is a drastically reduced direct oncolytic activity, much less than those suggested by experimental models. Initially, upon virus administration, the innate immunity plays a significant role in limiting virotherapeutic efficiency [10, 11]. Indeed, in gliomas treated with herpes simplex viruses (HSV), the recruitment of infiltrating monocytic cells has been associated with intratumoral clearance of over of HSV-derived viral particles shortly after delivery [12]. Subsequently, the adaptive immune response develops and becomes dominant after days post-infection [13]. This cellular and humoral immune response involves the recruitment of antigen-specific B cells and T cells to the infected tissue.
As can be noticed, various fundamental issues and technical hurdles must be understood and overcome in order to enhance the efficacy of oncolytic virotherapy. It is imperative to enlarge our current understanding concerning the complex and coupled dynamics of the growing tumor, the host immune response and the oncolytic viruses. The nonlinearities and complexities inherent to such dynamics call for mathematical approaches [14, 15]. Quantitative models can reveal the major parameters affecting therapeutic outcomes, guide new essays by indicating relevant physiological processes for further investigation, and prevent excessive experimentation needed to develop effective treatments.
In the present paper, we report on theoretical findings derived from a multiscale agent-based model for oncolytic virotherapy. Such findings point out implications for the design of new replication-competent viruses or combined therapy aimed to modulate the immune response. In section 2, the model is described. It takes explicitly into account the individual, discrete nature of the oncolytic viruses and includes the host adaptive immune response against the viruses. In section 3, the simulation results are discussed. In section 4, current or viable strategies to enhance the virotherapy efficacy against solid tumors consistent with our simulation results are emphasized. Finally, some conclusions are drawn in section 5.
2 A multiscale agent-based model for oncolytic virotherapy
The proposed model is an extension of our work on oncolytic virotherapy [16, 17, 18] and involves multiple agents and processes involved at distinct time and length scales.
2.1 The tissue
The tissue is modeled by a square lattice fed through a single capillary vessel at the top of the lattice. Six different cell types (normal and dead cells, uninfected and infected cancer cells, B and T lymphocytes) and an oncolytic virus are considered. Each cell and virus are represented by individual agents and their populations in a site described by , , , , , , and , respectively. Only one cell can occupy a given site, except uninfected or infected cancer cells that can pile up because tumor cell’s division is not constrained by contact inhibition. Antibody molecules directed against the oncolytic virus are also considered and described by its concentration . Since the viruses and antibodies are very small particles in comparison with cells, there is no constraint on their populations or concentrations at any site.
The nutrients, diffusing from the capillary vessel throughout the tissue, are divided into two groups: those essential to maintain the basic cell functions, whose deprivation can induce death () and those that limit cell replication but are not demanded for cell survival (). Both nutrient types are described by continuous fields , which evolve in space and time accordingly the simplest (linear with constant coefficients) dimensionless reaction-diffusion equations
| (1) |
with distinct uptake rates for normal and cancer cells and a characteristic length scale for nutrient diffusion [19]. The local populations of normal and cancer cells are or and , respectively. Equation (1) obeys a periodic boundary condition along the direction parallel to the capillary and a Neumann boundary condition at the border of the tissue (). At the capillary (), the concentration is (continuous and fixed supply).
2.2 Cancer growth
The tumor grows from a single malignant cell according to a stochastic dynamics whose probabilities depend on the local nutrient concentration. Each uninfected cancer cell, randomly selected with equal chance, can carry out one of four actions:
1- Mitotic replication, with a probability
| (2) |
an increasing function of the nutrient concentration per cancer cell, . The daughter cell randomly occupies one of its normal or necrotic nearest neighbor sites, where there exists any, or otherwise piles up at its mother site.
2- Death, with a probability
| (3) |
that increases with the scarcity of nutrients essential to sustain the cell metabolism.
3- Migration, with a probability
| (4) |
that increases with the local population of cancer cells and the nutrient concentration per cell. The migrating cell moves to one of its nearest-neighbor sites chosen at random, interchanging its position with a normal or dead cell if there exists any. The interchanged normal cell is eliminated when it arives at a site still occupied by other cancer cells. A probability increasing with the nutrient concentration is justified by the necessity of nutrients for cell motility and, in addition, by the degradation of the extracellular matrix near the tumor surface that releases several chemicals that promote cell migration and proliferation. This hypothesis is consistent with experimental data in multicellular tumor spheroids [20] and was previously used in other mathematical models [21, 22].
2.3 Oncolytic virotherapy
The virotherapy begins when the tumor attains cells and consists in a single virus injection. In the direct intratumoral administration, viruses are uniformly spread over the entire tumor at a given multiplicity of infection (MOI). Thus, viruses are initially released. This approach corresponds to the experimental protocols used in severe combined immune deficient (SCID) mice [23] and in vitro assays [24, 25].
After virus administration, each uninfected cancer cell, randomly selected with equal chance, can become infected with a probability
| (5) |
an increasing function of the local viral load per cell, controlled by the parameter . The model assumes perfect viral selectivity for cancer cells, thereby the infection of normal cells by oncolytic viruses is neglected. The number of viruses that infect a given cell is selected from a Poisson distribution,
| (6) |
where is the typical viral entry [26]. The model assumes that an infected cancer cell neither divides nor migrates because its slaved cellular machinery is focused on virus replication. It is also assumed that infected cancer cells sustain their metabolism until lysis and die only by lysis. The death by lysis occurs with a probability
| (7) |
where is the time elapsed since the cell infection and is the characteristic time for cell lysis. The lysis of each infected cancer cell releases
| (8) |
free viruses to the extra-cellular medium. Here, the maximum virus burst size and are model parameters. At the time of lysis, the new free viruses remain on the site of the lysed cell. At each time step, these free viruses either spread through the tissue by performing independent random walks comprising steps or are cleared at a rate . The clearance rate embodies the innate immune responses and non immune mechanisms of virus inactivation.
2.4 Antiviral immune response
Concerning the adaptive immune response, the model assumes that B and CD T cells are recruited to the infected tissue if there are more than infected cancer cells within the tumor tissue. At lower infection levels, the signaling is supposed too weak to induce lymphocyte recruitment, and the populations of B and of CD T lymphocytes will decrease due to their finite lifespans, and , respectively. The recruited lymphocytes extravagant from the capillary vessel into the tissue at constant rates and , respectively. This is the simplest description of the complex process of lymphocyte recruitment.
At each time step, effector T cells randomly selected move inside surveillance areas of radii centered on their present position. In every area free from infected cancer cells, the chosen T cell jumps at random to a site at its border. Otherwise, the cytotoxic T cell jumps randomly to an empty nearest-neighbor site of an infected cancer cell inside that region. This corresponds to a directed migration towards the infected region, with either less or more confined trajectories in regions free or containing infected cancer cells, respectively. These rules are suggested by in vivo imaging of cytotoxic T cell infiltration in a solid tumor growing subcutaneously [27]. CD T cells attached to one or more nearest-neighbor, infected cells will induce the apoptosis of only one of these target cells with a probability . Indeed, the action of a cytotoxic CD T cell seems to be narrowly focused on just one of its points of contact with a target cell at once [28]. Again, the target cell to be destroyed will be chosen at random among these nearest neighbors.
Similarly, every B cell can only move inside a surveillance area of radius either towards a site containing infected cancer cells, or to a border site randomly chosen in infected cell free regions, where it secrets antibodies at a rate . In addition, a significant amount of these antibodies enter into the systemic circulation and during the infection sustain a specific antibody concentration in the capillary vessel. The model assumes that these antibodies infiltrate the infected tissue at a constant rate. Thus, the antibody concentration is given by a non-stationary solution of the diffusion equation
| (9) |
Here, is the diffusivity and the clearance rate of the antibodies. At the capillary, the boundary condition is , representing a fixed concentration in the bloodstream.
The antibodies prevent virus binding to cellular receptors and subsequent cell entry, neutralizing the virus. We assume that free viruses can be inactivated by antibodies with a probability
| (12) |
a function of the local antibody concentration that increases monotonicaly up to a threshold and saturates at the unity above this concentration. Antibodies are removed at binding to a free virus in order to inactivate it. We assume that the local concentration of antibodies decreases by at each virus neutralizing event. Finally, the parameter estimates can be found in the appendix.
2.5 Simulation protocol
The simulations were implemented as follows. At each time step, Eq. (1) is numerically solved in the stationary state () through relaxation methods, and Eq. (14) is iterated for a defined number of steps. Then, fractions of free viruses are cleared, innactivated by antibodies with a probability given by eq. (12), and each remaining virus performs a random walk with steps. Provided the nutrient concentration and viral load at any lattice site, both B and T lymphocytes are recruited to the tissue. So, cancer cells and lymphocytes are sequentially selected at random with equal probability. (Here, is the total number of tumor cells, uninfected or infected, and is the number of B and T lymphocytes at the time .) For each one of them, a tentative action is randomly chosen with equal probability. These actions are division, death, migration or infection for an uninfected cancer cell, lysis for an infected tumor cell, movement for a B cell and movement or cytotoxic action for a T lymphocyte. For a cancer cell, the selected action will be implemented or not according to the corresponding local probabilities determined by Eqs. (2) to (7). In the case of infection, an integer random number Poissonian distributed is generated and compared with the local virus population . If , viruses invade the selected uninfected cancer cell, decreasing by . Otherwise, this process will be repeated until generates a . In turn, in the case of lysis, new viruses are introduced at the site of the lysed cell. For a T cell cytotoxic action, the apoptosis of a nearest-neighbor infected cancer cell is elicited with a probability . At the end of this sequence of updates, a new time step starts and the entire procedure is iterated. The simulations stop if any tumor cell reaches the capillary vessel or the tissue border or if the tumor is eradicated ().
3 Hurdling the major obstacle: immunity
We simulated the model considering a viral agent able to eradicate compact solid tumors in the absence of an adaptive immune response, as reported in reference [16]. When applied to immune-competent hosts characterized by typical immunological parameters (see the Supplementary Information), a virotherapy based on such oncolytic virus invariably fails. The reason is that free viruses as well as their sources, the infected cancer cells, are eliminated by the adaptive immune response. Even at small virus clearance rate, representing a permanent depletion of the innate response, the adaptive immunity against the oncolytic virus ends to subvert the therapy. As experimentally observed [12], there occurs only a significant transient increase in intratumoral viral titers shortly after viral administration. Hence, the central issue is how to suppress, or better, modulate the adaptive immune response in order to enhance the success of viral therapies of cancer in immuno-competent hosts.
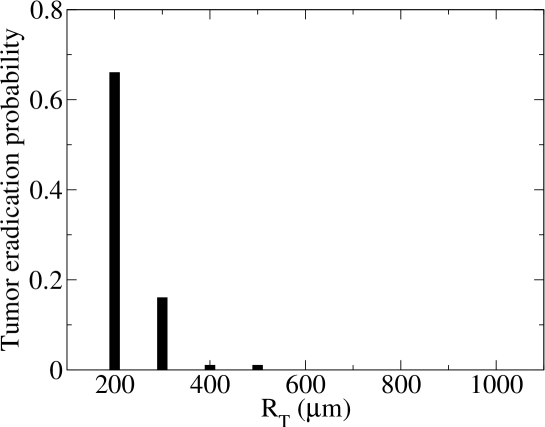
Our results indicate three routes to enhance the chances of tumor eradication in immuno-competent patients. In the first one, the recruitment of B cells to the infected tissue is completely suppressed. The corresponding probabilities of therapeutic success for different CD T cell surveillance radii are shown in figure 1. The absence of B cells ensures that the antibody concentration within the tissue remains always below the level necessary to neutralize the free oncolytic viruses, whereas short-range surveillance radii make certain that CD T cells reach the tumor at a rate insufficient to eliminate the infected cancer cells before the successive waves of viruses infect all cancer cells. In contrast, cytotoxic T cells having a long-range surveillance radius () can induce apoptosis in all infected tumor cells if recruited at rates cells. Now, the successive rounds of infection are strongly attenuated and the probability of therapeutic success becomes lower than . Furthermore, the oncolytic virotherapy fails if the concentration of antibodies at the capillary is very large, as possibly elicited by a potent systemic immune response. Indeed, the probability of therapeutic success decreases to about if is tenfold greater and vanishes if is multiplied by a factor , a concentration corresponding to the levels observed in a secondary immune response to a previously presented antigen. These results are consistent with clinical trials and rodent tumor models, which indicate that neutralizing antibodies against viral antigens significantly impair the therapeutic efficacy of several adenoviral vectors [6, 13, 29].
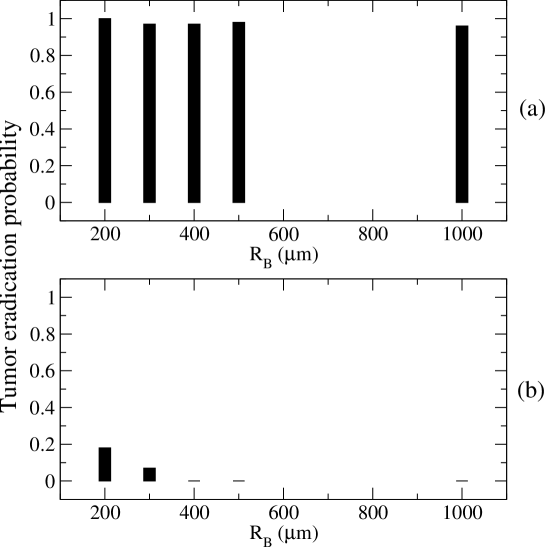
The second route consists in suppressing both CD T cells and antibody infiltration. Thus, only B cells are recruited to the tumor site. In consequence, the tumor is eradicated with probability higher than (see Figure 2a). This great therapeutic success is sustained even for B cells with surveillance radius as large as , recruited at rates up to , and synthesizing antibodies at rates up to two orders of magnitude greater than . Our simulations indicate that B lymphocytes alone can not elicit an effective immune response against the oncolytic virus. Indeed, B lymphocytes are antibody’s sources in permanent migration. They do not stay in the neighborhood of any infected cancer cell long enough to increase sufficiently the local antibody’s concentration to inactivate most of viruses released after the lysis of this cell. However, if antibodies extravasate from the capillary into the tissue, the total antibody concentration in the tumor is high enough to inactivate most of the free viruses, decreasing abruptly the therapeutic success (figure 2b).
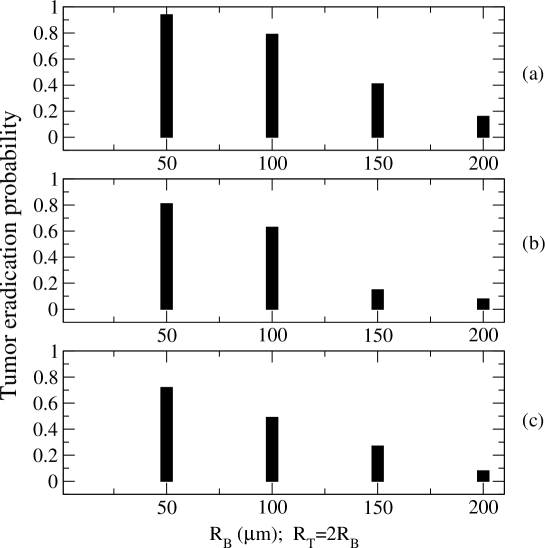
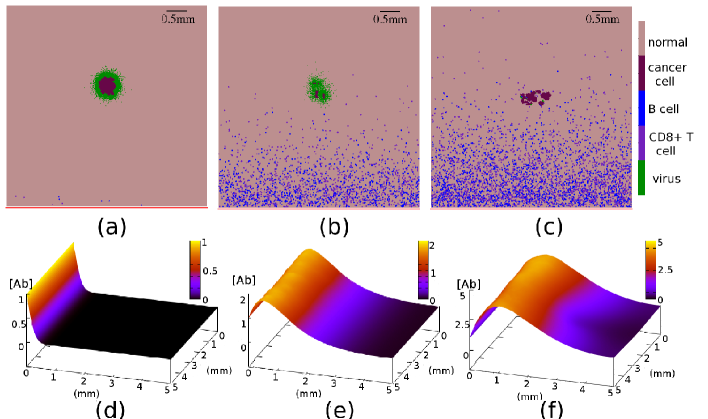
Finally, the third scenario for tumor eradication consists in impairing the motility of both B and T cells without affect the antibody dynamics or lymphocyte recruitment rates. If the surveillance radii are short-ranged ( and ) the tumor is eradicated with a probability greater than for lymphocytes recruited at low rates . In figure 3, the tumor eradication probability is shown for three distinct recruitment rates. Lymphocytic motility is a much more determinant feature than its recruitment rate. The key to success is to provide enough time for the viruses to kill the cancer cells before the infiltrating B and T lymphocytes elicit an effective antiviral cellular immune response. If a few cancer cells survive the virus attack until they fall into the surveillance radii of the incoming B and T cells, the virotherapy fails because the free viruses and infected cancer cells are then quickly eliminated. This is illustrated in figure 4. As can be noticed, days after viral administration the tumor undergoes a significant remission and the first lymphocytes have the tumor inside their surveillance radii. Then, the local adaptive immune response mediated by B and T cells spends around months to eliminate almost all free viruses and infected cancer cells, leaving room for tumor regrowth from the few surviving malignant cells.
4 From theory to the clinical practice
Numerous clinical trials have firmly demonstrated that the efficacy of oncolytic viruses is drastically reduced by the host antiviral immune response. Accordingly, the immunossupressor cyclophosphamide, a chemotherapeutic drug which inhibits the synthesis of neutralizing antibodies [30, 31], IFN- [32], and the activity of innate immune cells [33], is commonly co-administered with HSV [34, 35] and reovirus [7], abrogating the innate and adaptive humoral immunity. However, instead of a systemic immunity suppression, our results support that a local, in situ, disruption of the antiviral response strongly enhances oncolytic virotherapy.
This goal can be achieved through the design of efficient oncolytic viruses. Indeed, one rationale supported by our simulational results is to arm oncolytic viruses with genes encoding for inhibitors of chemokines, interleukines, or interferons. Once introduced in, expressed and secreted by infected cancer cells up to their lysis, such inhibitors will actively abrogate the recruitment of lymphocytes, mainly effector CD T cells, to the tumor site. This goal can possible be achieved through diverse approaches. For instance, by blocking the expression of CXCL9 and CXCL10 in situ. These chemokines are necessary for cytotoxic T lymphocytes (CTL) to enter from the systemic circulation into the site of infection [36]. Moreover, the down-regulation of CXCL9 reduces CD T cell infiltration into the infected tissue [37]. Such local depletion of CD T cells significantly blocks further CTL recruitment, primarily dependent on the IFN- secreted by the CD cells [36]. In turn, lower local levels of CD-derived IFN- inhibits the expression of CXCL9 and the autocrine-mediated conditioning of CD T cells for access to the infected tissue [36], closing a feedback loop. Even the residual CTL recruitment observed in the absence of CD lymphocytes or IFN- can be eliminated through the neutralization of type I IFN, such as IFN-R [36].
Related to this context, one innovative development deserve special emphasis. the rVsV-gG virus inhibited the chemotaxis of NK and NKT cells to the tumor sites [38]. This gG viral protein binds C, CC and CXC chemokines with high affinity, possibly suppressing lymphocytic recruitment in addition to the host inflammatory response. Such a possibility remains to be checked. Concerning interleukines, several groups [39] have reported that vaccinia virus expressing Th2 cytokines such as IL-4 and IL-10 has increased in vivo viral replication and slowed clearance rate. Maybe, another inspiring case is that of a HSV-1 vector expressing IL-5 able to decrease the numbers of infiltrating lymphocytes in the brain during the treatment of experimental autoimmune encephalomyelitis [40].
The second rationale lies on severely constrain the motility of B and T cells that infiltrate the infected tissue. A possible approach is engineering oncolytic viruses to encode potent and diffusible products disruptive of migration pathways targeted to the effector lymphocytes. At the site of infection, the lymphocytes’ adhesion molecules, particularly -integrins, turn into highly active states. Again, this activation is induced by chemokines [41] and Rap1 is a critical mediator of both - and -integrin activation, cell polarization as well as cell migration [42]. Thereby, presumably an oncolytic vector encoding an inhibitor of Rap1 or its effector molecule RAPL can significantly impair lymphocyte motility. Alternative strategies might target the lymphocyte’s cytoskeleton. T cells use amoeboid migration based on actin polymerization along the plasma membrane to stiffen and contract the cell cortex [43]. Small GTPase RhoA and its effector ROCK critically control the cortical actin dynamics. Interfering with RhoA and/or ROCK results in a failure of the trailing edge to detach, dramatically reducing the migration rate of T cells [44], as well as impairing acto-myosin contraction required for amoeboid movements. Thus, inhibitors of such proteins emerge as immediate transgene candidates for virus-mediated suppression of lymphocytic motility. Other candidate can be, for instance, the Wiskott-Aldrich syndrome protein (WASP) that plays a pivotal role in regulating surface receptor signaling to the actin cytoskeleton in hematopoietic cells. Blocking WASP activity leads to a severe defect in cell migration in multiple cell types [45].
5 Concluding remarks
A fundamental issue concerning the efficiency of the viral therapy of cancer, namely, the abrogation of the host antiviral immune response, was investigated through computer simulations of a multiscale model for tumor growth. The model combines macroscopic diffusion equations for the nutrients and antibodies and stochastic rules for the actions of individual cells and viruses. Even though current strategies to improve virotherapeutic efficacy consist in developing viruses that can evade the adaptive immune response, we propose testable alternatives focused instead on the local disruption of the cellular-mediated immunity.
Essentially, our results indicate two distinct and complementary routes. The first one is to halt the recruitment of effector lymphocytes, mainly the CD T cells, at the tumor-bearing tissue infected with the oncolytic virus. The second approach is based on strongly reducing the motility of B and T lymphocytes that infiltrate the affected tissue. We find that the lymphocytes surveillance radii, determining both their motility and targeting ability, rather than their recruitment rates, are the major immunological features to be modulated. Hence, the second route seems to be the most effective way to enhance the success of oncolytic virotherapy. However, the potential benefit of using these two strategies in synergy is promising.
Finally, our results fuel the debate on apparently disparate strategies to enhance oncolytic virotherapy: develop oncolytic viruses competent to either re-stimulate antitumoral immune response or inactivate antiviral immunity. Both are currently under experimental test [38, 46, 47]. Given the complexity of tumor-stroma-immune system interactions, mathematical modeling can help us to evaluate quantitatively these strategies or even the result of their combination.
Acknowledgments
This work was partially supported by the Brazilian Agencies CAPES, CNPq, FAPEMIG and FACEPE.
*
Appendix A Parameter estimates
The model parameters determining the cancer growth were fixed at , , , , , , in order to generate compact, solid tumors [19]. In all the simulations, the virus parameters were fixed in time steps ( h), , , , , , and . Also, was used, resulting in a clearance rate of , or only of its typical value [9]. This value corresponds to a weak innate immune response. The virotherapy begins when the tumor contains cancer cells.
Estimates for the values of the parameters associated to the humoral and cellular immune response are shown in Table 1. They were used either to guide the choice or to determine the range of the model parameters used in the simulations as described next.
| Parameter | Range of values | Description | Ref. |
|---|---|---|---|
| weeks | B cells’ lifespan | [28] | |
| weeks | T cells’ lifespan | [28] | |
| - | B cells recruitment rate | [36] | |
| T cells recruitment rate | [36] | ||
| T cells speed within a tumor | [27] | ||
| Ab secretion rate | [48] | ||
| Ab concentration at the capillary | [28] | ||
| Ab clearance rate | [49] | ||
| Ab diffusion constant | [50] |
The antibody concentration needed to inactivate a virus was assumed to be ; the life times of the lymphocytes were fixed in time steps, corresponding approximately to weeks; the probability of -mediated infected cell apoptosis was ; and the minimum number of infected cells needed to activate an immune response was assumed to be .
Nakanishi et al. [36] analyzed the T cells entry into into HSV-infected vaginal tissue and their results indicate that these lymphocytes are recruited at a rate of cells. So, in the model the and values are in the range between and . Considering the mean speed of T cells migrating within a solid tumor, a length step of (the lattice constant), and a simulation time step of h, lower and upper bounds for the surveillance radius can be estimated. These bounds are given by the mean squared distance traversed by a T cell following a random and a ballistic trajectory, respectively. For the last case, this distance is essentially m, correspondent to steps and to a upper bound . Instead, assuming a random walk with the same number of steps and that , a lower bound is found. Accordingly, the T cells surveillance radius ranged from to in simulations. Also, since each T cell has only of chance to migrate at each time step whereas B cells surely move, it was assumed in order to both lymphocytes exhibit roughly the same mean speed.
Finally, the diffusion equation for the antibodies, Eq. , can be written in a dimensionless form by performing the variable transformation
| (13) |
After some algebraic manipulation, one obtains the equation
| (14) |
subjected to the boundary condition at the capillary vessel
and involving the dimensionless rates of antibodies synthesis and clearance
| (15) |
Using the experimental values shown in Table 1, such dimensionless rates were varied within the ranges and in the simulations. In contrast to the nutrient equations that are solved at the quasi-stationary state, Eq. is iterated for a defined number of times, since the antibodies diffusion constant can be as small as in tissues [50], whereas glucose and oxygen diffusivities are in tumor spheroids [51].
References
References
- [1] Siegel R, Ward E, Brawley O and Jermal A 2011 CA Cancer J. Clin. 61 212–36
- [2] Murray C J L and Lopez A D 1997 Lancet 349 1448–504
- [3] Weinberg R 2007 The biology of cancer (New York: Garland Science)
- [4] Chen J, Edelstein P S, Johnson P J, Lustig R and Ooi L 2011 J. Cancer Ther. 2 258–65
- [5] Harrington K J, Vile R G and Pandha H S 2008 Viral Therapy of Cancer. (Chichester, England: Wiley)
- [6] Vidal L, Pandha H S, Yap T A, White C L, Twigger K, Vile R G, Melcher A, Coffey M, Harrington K J and DeBono J S 2008 Clin. Cancer Res. 14(21) 7127–37
- [7] Parato K A, Senger D, Forsyth P A J and Bell J C 2005 Nat. Rev. Cancer 5 965–76
- [8] Hecht J R, Bedford R, Abbruzzese J L, Lahoti S, Reid T R, Soetikno R M, Kirn D H and Freeman S M 2003 Clin. Cancer Res. 9(2) 555–61
- [9] Friedman A, Tian J P, Fulci G, Chiocca E A and Wang J 2006 Cancer Res. 66 2314–9
- [10] Alvarez-Breckenridge C, Kaur B and Chiocca E A 2009 Chem. Rev. 109 3125–40
- [11] Nguyên T L, Abdelbary H, Arguello M, Breitbach C, Leveille S, Diallo J S, Yasmeen A, Bismar T A, Kirn D, Falls T, Snoulten V E, Vanderhyden B C, Werier J, Atkins H, Vaha-Koskela M J, Stojdl D F, Bell J C and Hiscott J 2008 Proc. Natl. Acad. Sci. USA 105(39) 14981–6
- [12] Fulci G, Dmitrieva N, Gianni D, Fontana E J, Pan X, Lu Y, Kaufman C S, Kaur B, Lawler S E, Lee R J, Marsh C B, Brat D J, van Rooijen N, Stemmer-Rachamimov A O, Hochberg F H, Weissleder R, Martuza R L and Chiocca E A 2007 Cancer Res. 67(19) 9398–406
- [13] Bessis N, GarciaCozar F J and Boissier M C 2004 Gene Therapy 11 S10–S17
- [14] Martins M L, Ferreira Jr S C and Vilela M J 2007 Phys. Life Rev. 4 128–56
- [15] Martins M L, Ferreira Jr S C and Vilela M J 2010 Curr. Opin. Colloid Interface Sci. 15 18–23
- [16] Paiva L R, Martins M L and Ferreira Jr S C 2011 Phys. Rev. E 84 041918
- [17] Paiva L R, Binny C, Ferreira Jr S C and Martins M L 2009 Cancer Res. 69 1205–11
- [18] Ferreira Jr S C, Martins M L and Vilela M J 2005 Phys. A 65 591–602
- [19] Ferreira Jr S C, Martins M L and Vilela M J 2002 Phys. Rev. E 65 021907
- [20] Freyer J P and Schor P L 1989 J. Cell. Physiol. 138 384–392
- [21] KANSAL A, TORQUATO S, IV G H, CHIOCCA E and DEISBOECK T 2000 J. Theor. Biol. 203 367 – 382
- [22] Ramis-Conde I, Chaplain M A and Anderson A R 2008 Math. Comput. Model. 47 533 – 545
- [23] Coffey M C, Strong J E, Forsyth P A and Lee P W K 1998 Science 282 1332–4
- [24] Bischoff J R, Kim D H, Williams A, Heise C, Horn S, Muna M, Ng L, Nye J A, Sampson-Johannes A, Fattaey A and McCormick F 1996 Science 274 373–6
- [25] Raj K, Ogston P and Beard P 2001 Nature 412 914–7
- [26] Dixit N M and Perelson A S 2004 J. Virol. 78(16) 8942–5
- [27] Boissonnas A, Fetler L, Zeelenberg I S, Hugues S and Amigorena S 2007 J. Exp. Medicine 204(2) 345–56
- [28] Janeway C A, Travers P, Walport M and Shlomchik M J 2001 Immunobiology: The Immune System in Health and Disease. 5th edition. (New York: Garland Science)
- [29] Alemany R, Balagué C and Curiel D T 2000 Nature Biotechnology 18 723–7
- [30] Hirasawa K, Nishikawa S G, Norman K L, Coffey M C, Thompson B G, Yoon C S, Waisman D M and Lee P W 2003 Cancer Res. 63(2) 348–53
- [31] Jooss K, Yang Y and Wilson J M 1996 Gene Ther. 7 1555–66
- [32] Ikeda H, Old L J and Schreiber R D 2002 Cytokine Growth Factor Rev. 13 95–109
- [33] Fulci G, Breymann L, Gianni D, Kurozomi K, Rhee S S, Yu J, Kaur B, Louis D N, Weissleder R, Caligiuri M A and Chiocca E A 2006 Proc. Natl. Acad. Sci. USA 103(34) 12873–8
- [34] Ikeda K, Ichikawa T, Wakimoto H, Silver J S, Deisboeck T S, Finkelstein D, Harsh 4th G R, Louis D N, Bartus R T, Hochberg F H and Chiocca E A 1999 Nature Med. 5 881–7
- [35] Wakimoto H, Fulci G, Tyminski E and Chiocca E A 2004 Gene Ther. 11 214–23
- [36] Nakanishi Y, Lu B, Gerard C and Iwasaki A 2009 Nature 462 510–3
- [37] Wuest T, Farber J, Luster A and Carr D J J 2006 Cell. Immunol. 243 83–9
- [38] Altomonte J, Wu L, Chen L, Meseck M, Ebert O, a Sastre A G, Fallon J and Woo S L 2008 Mol. Ther. 16 146–53
- [39] Ziauddin M F and Bartlett D 2008 Oncolytic vaccinia (Chichester, England: Wiley) pp 151–69
- [40] Nygardas M, Aspelin C, Paavilainen H, Roytta M, Waris M and Hukkanen V 2011 Gene Ther. 18 646–55
- [41] Woolf E, Grigorova I, Sagiv A, Grabovsky V, Feigelson S W, Shulman Z, Hartmann T, Sixt M, Cyster J G and Alon R 2007 Nat. Immunol. 8 1076–85
- [42] Kinashi T and Katagiri K 2004 Immunol. Lett. 93 1–5
- [43] Friedl P 2004 Curr. Opin. Cell Biol. 16 14–23
- [44] Smith A, Bracke M, Leitinger B, Porter J C and Hogg N 2003 J. Cell Sci. 116 3123–33
- [45] Snapper S B, Meelu P, Nguyen D, Stockton B M, Bozza P, Alt F W, Rosen F S, von Andrian U H and Klein C 2005 J. Leukoc. Biol. 77 993–8
- [46] Zamarin D, nez Sobrido L M, Kelly K, Mansour M, Sheng G, Vigil A, a Sastre A G, Palese P and Fong Y 2009 Mol. Ther. 17 697–706
- [47] Choi I K, Lee J S, Zhang S N, Park J, Lee K M, Sonn C H and Yun C O 2011 Gene Ther. 18(9) 898–909.
- [48] Racanelli V, Frassanito M A, Leone P, Galiano M, De Re V, Silvestris F and Dammacco F 2006 J. Virology 80 3923–34
- [49] Figge M T 2009 PLoS ONE 4 e5685
- [50] Berk D A, Yuan F, Leunig M and Jain R K 1997 Proc. Natl. Acad. Sci. USA 94 1785–90
- [51] Nichols M G and Foster T H 1994 Phys. Med. Biol. 39 2161–