The 2011 Periastron Passage of the Be Binary Scorpii
Abstract
We describe the results of the world-wide observing campaign of the highly eccentric Be binary system Scorpii 2011 periastron passage which involved professional and amateur astronomers. Our spectroscopic observations provided a precise measurement of the system orbital period at years. Fitting of the He ii 4686 Å line radial velocity curve determined the periastron passage time on 2011 July 3, UT 9:20 with a 0.9–day uncertainty. Both these results are in a very good agreement with recent findings from interferometry. We also derived new evolutionary masses of the binary components (13 and 8.2 M⊙) and a new distance of 136 pc from the Sun, consistent with the HIPPARCOS parallax. The radial velocity and profile variations observed in the H line near the 2011 periastron reflected the interaction of the secondary component and the circumstellar disk around the primary component. Using these data, we estimated a disk radius of 150 R⊙. Our analysis of the radial velocity variations measured during the periastron passage time in 2000 and 2011 along with those measured during the 20th century, the high eccentricity of the system, and the presence of a bow shock-like structure around it suggest that Sco might be a runaway triple system. The third component should be external to the known binary and move on an elliptical orbit that is tilted by at least 40 with respect to the binary orbital plane for such a system to be stable and responsible for the observed long-term radial velocity variations.
1 Introduction
Scorpii is one of the brightest stars in the sky. Until 2000, its visual brightness was = 2.32 mag; since then, and due to its transition to a Be phase (Carciofi et al., 2006), it has been even brighter ( 1.6 mag). It was resolved interferometrically into two components in the 1970’s, and the observations indicated a very eccentric orbit with a period of 10.6 years (Hartkopf et al., 1996). The system is not eclipsing, and the secondary component is mag fainter than the primary one (Tango et al., 2009).
Sco was used as a spectral classification standard (B0 iv) during the entire 20th century. The first signs of weak emission in the H line were detected by Côté & van Kerkwijk (1993) close to a periastron time in 1990, but the emission only slightly varied throughout the next orbital cycle (Miroshnichenko et al., 2001; Koubský, 2005). In June 2000, near the following periastron time, the system was found to be 0.03 mag brighter than usual, while a spectrum taken shortly after revealed a noticeable H emission line (Fabregat, Reig, & Otero, 2000). A follow up spectroscopic campaign resulted in the detection of a growing line emission and a significant variation of the radial velocity (Miroshnichenko et al., 2001). These data constrained the periastron time (2000 September ) which was predicted to occur a few months earlier from the interferometric data. Since that time the circumstellar (CS) disk around the primary component of Sco grew larger, the system brightness varied between 1.6 and 2.3 mag, but the line emission has never disappeared. The disk development has been documented in Miroshnichenko et al. (2003) and Carciofi et al. (2006).
The erroneous interferometric prediction of the periastron time in 2000 reflected the accuracy of this technique at that time. The orbital separation of the components that varies from 6 to 200 mas only allowed to resolve them during about half the orbital cycle, mostly around apastron. Recent advances in this field made it possible to cover the entire orbit (e.g., Tycner et al., 2011; Meilland et al., 2011). The interferometric observations obtained since 2000 combined with the orbit derived from the radial velocity curve (Miroshnichenko et al., 2001) resulted in predicting the periastron time in 2011 with a high accuracy (2011 July 2–6, Tango et al., 2009; Tycner et al., 2011; Meilland et al., 2011). Moreover, interferometry obtained in July 2011 (Che et al., 2012; Štefl et al., 2012), right after the periastron, confirmed the prediction.
Spectroscopy is another powerful tool in studying binaries that is capable of verifying interferometric results and obtaining additional information about objects’ properties. In order to get ready for the 2011 periastron, a spectroscopic observing campaign was planned well in advance (e.g., Miroshnichenko, 2009). Its important feature was a broad participation of amateur astronomers whose involvement in spectroscopic observations of various objects significantly increased over the last decade (e.g., Fahed et al., 2011).
This paper describes the main results of the Sco 2011 periastron spectroscopic observing campaign as well as some additional findings that suggest new ideas about the system’s nature and evolution. The observations are described in Sect. 2, analysis of the 2011 periastron radial velocity curves and the orbital period determination are presented in Sect. 3, historical radial velocity data along with new ideas about the system’s nature are discussed in Sect. 4, and conclusions and predictions are summarized in Sect. 5.
2 Observations
Spectroscopic monitoring of Sco began shortly after its brightening discovery in 2000 (Fabregat, Reig, & Otero, 2000) and has been ongoing since that time. Due to its brightness, it has mostly been observed with under 1m size telescopes. The amateur community participation has been steadily growing towards the time of the 2011 periastron. While only a few spectra of Sco were obtained by amateurs in 2000, this number grew to 200 spectra in 83 nights in 2010 and over 300 spectra in 149 nights in 2011. The amateurs contribution in 2010–2011 is comparable with that of professional astronomers in the number of spectra and exceeds it in the time coverage.
The main goals of the 2011 campaign were 1) to obtain an accurate radial velocity curve to independently constrain the orbital period, and 2) to study line profile variations to search for effects of the interaction between the disk and the secondary component as well as possibly get information about the latter. The interaction was expected due to a very small distance between the components at periastron (15 radii of the primary component, Miroshnichenko et al., 2001) and the disk size comparable with this distance (Carciofi et al., 2006; Millan-Gabet et al., 2010).
Since not all of the involved observers were able to cover a wide spectral range, it was suggested to focus on the two following regions. First, a region around the H emission line whose profile is indicative of the tidal interaction due to a possible disk restructuring. Second, a region around the photospheric He ii 4686 Å line whose profile seems to be the least affected by the disk material and is therefore the best tracer of the orbital motion of the primary component. The He i lines that are abundant in the object’s spectrum were rejected because their profiles are subject to complicated distortions by the disk material, and the CS contribution to them is difficult to quantify.
The main instruments that contributed to the campaign from the professional side were the 3.6 m CFHT with the spectropolarimeter ESPaDOnS (Donati et al., 1997), which covers a region 3600–10 500 Å with a spectral resolving power , and the 2.2 m MPG telescope at ESO/La Silla with the FEROS spectrograph (Kaufer et al., 2000), which covers a region 3600–9200 Å with . Over 300 individual spectra of Sco were obtained at these facilities during 40 nights in 2011.
An important feature of the campaign was a ten night observing run at the 0.8 m IAC80 telescope of the Instituto de Astrofísica de Canarias at the Teide Observatory on the Canary Island of Tenerife in Spain. The run took place between 2011 June 28 and 2011 July 8, was centered on the periastron time predicted by Tycner et al. (2011), and accomplished by a team of five authors of this paper (A. Miroshnichenko, J. Ribeiro, A. Fernando, T. Garrel, and J. Knapen). We used a private Lhires iii spectrograph111http://www.astrosurf.com/thizy/lhires3/index-en.html with in the H region and in the He ii 4686 Å line region. All nights of the run were clear. We obtained over 100 individual exposures in the two mentioned regions as well as in a region near H and He i 4471 Å line.
The amateur community contribution to the campaign involved nearly 20 observers from France, Germany, Australia, Portugal, Spain, and the USA. They used 0.2 m to 0.4 m telescopes with either échelle or long-slit spectrographs with a range of –22 000. Only the spectra with were used in our analysis.
Data reduction was performed using Libre-ESpRIT data reduction package (Donati et al., 1997) for the ESPaDOnS data and ESO–MIDAS package for the FEROS data. IRAF was used to reduce some of the Tenerife campaign data, while most amateurs data were reduced with software packages developed for amateur spectrographs, such as Audela222http://www.audela.org/dokuwiki/doku.php/en/start and IRIS333http://www.astrosurf.com/buil/isis/isisen.htm. Wavelength calibration was controlled by measuring positions of telluric and interstellar (e.g., Na i D1,2) lines and contemporaneous observations of radial velocity standards (e.g., Ser and Oph). Typical uncertainties of the radial velocity measurements are below 1 km s-1 for the ESPaDOnS and FEROS data and 2–4 km s-1 for the amateur data.
3 Data Analysis
3.1 The H line
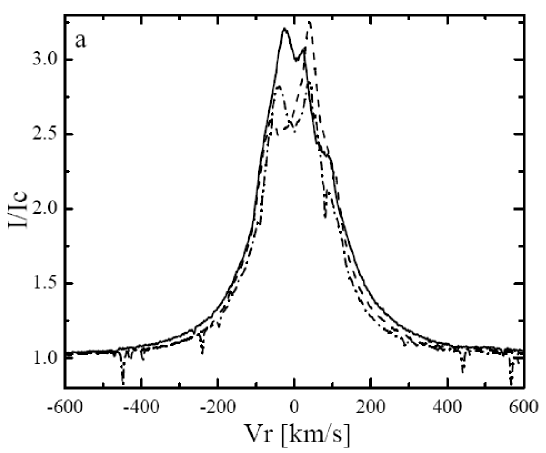
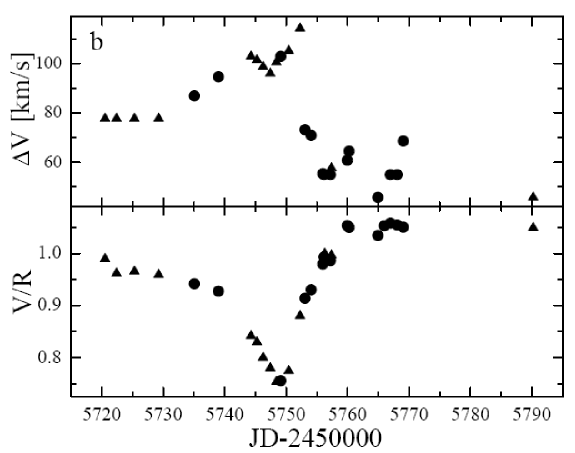
The double-peaked structure of the H line profile was resolved almost all the time in 2011 even at 10 000. The peak intensity ratio was until about a month before the periastron time, then it reached a minimum at periastron, and came back to the pre-periastron value about two weeks later (see Fig. 1ab). The line equivalent width increased from 11 Å in May 2011 to 15 Å in September, while the visual continuum got brighter by 0.1 mag between late-June and a few days after the periastron (Rivinius et al., 2012). Therefore the line flux was rising as well. The latter is unlikely to be due to a tidally induced enhanced mass loss from the primary, as the close passage of the secondary only reduced the primary surface gravity by %. Both the and the equivalent width changes began virtually at the same time and might be explained by emission from the disk material that was getting into the secondary Roche lobe. The secondary was moving away from us until the periastron time and might have caused the red peak enhancement.
The system brightness decreased after the periastron, and the above mentioned further increase of the equivalent width was mostly due to this effect. This is consistent with a constant disk contribution to the –band flux from 6 to 18 days after periastron reported by Che et al. (2012). We also note that in 2010 the H radial velocity was the same as before the 2000 periastron, but became 10 km s-1 more negative in January 2011, nearly two months earlier than the radial velocity should have started to change due to the binary components closeness. This effect might have been due to some processes in the disk which are beyond the scope of this paper. A more detailed analysis of the line profile variations will be presented elsewhere (Rivinius et al., in prep.).
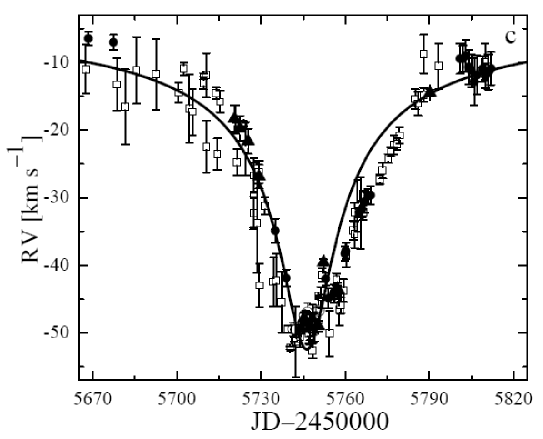
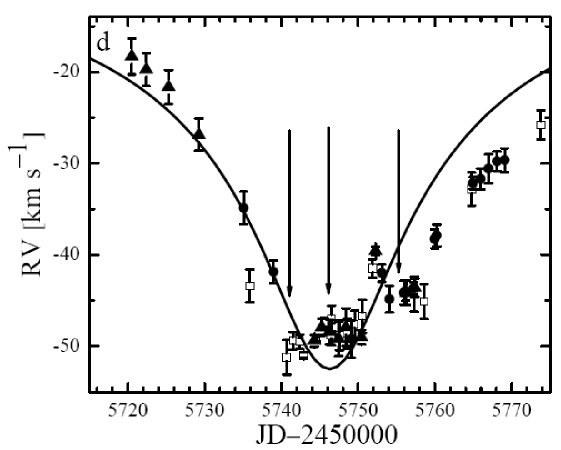
The radial velocity curve from the H data is shown in Fig. 1cd. The measurements were accomplished using the mirrored profile method (see, e.g., Nemravová et al., 2012). The measurement results are presented in Table 1. The curve shows a more complicated structure compared to the one observed in 2000 and expected from a binary system with no changes in the CS matter. There were three turnovers marked by arrows in Fig. 1d. The first one occurred about five days before the periastron and was a consequence of the line profile redshift ( decrease) described above. The second one occurred two days after the periastron, when the ratio exhibited a minimum. The third one took place nearly two weeks after the periastron on 2011 July 18 (JD2455760) and coincided with the rapid change of the ratio back to 1.1. After that time, the secondary with a part of the circumprimary disk seemed to have moved beyond the disk boundary and stopped affecting the remaining part of the disk.
The line profile variations near the periastron allow us to roughly estimate the disk radius. The changes began to occur about 10 days prior to the periastron, when the stars were 250 R⊙ apart. Assuming an equilibrium situation, at this time the first Lagrangian point between the two stars was laying 150 R⊙ from the primary (Eggleton, 1983). This distance can be regarded as an upper limit on the disk radius. It corresponds to 20 radii of the primary component assuming a distance of 136 pc (see Sect. 3.4). This is somewhat larger than the 104 R⊙ for the semi-major FWHM of the primary H disk measured by Millan-Gabet et al. (2010) in July 2007 during a brightness minimum period when the system was as bright as before the disk began developing.
The system became 60% optically brighter between 2009 and 2011. This brightening was very similar to the initial one in 2000/2001, but this time the disk was already present. The most likely reason for the fading was clearing of the disk inner regions due to the mass loss weakening (Haubois et al., 2012). However, the disk outer regions must have survived, as the line emission was observed all the time. Therefore, the circumprimary disk was probably steadily growing during the entire orbital cycle. It is beyond the scope of this paper to discuss this process in detail. We only note that the disk size was 49 R⊙ already in 2001 (Carciofi et al., 2006), not in 2005 as quoted by Meilland et al. (2011).
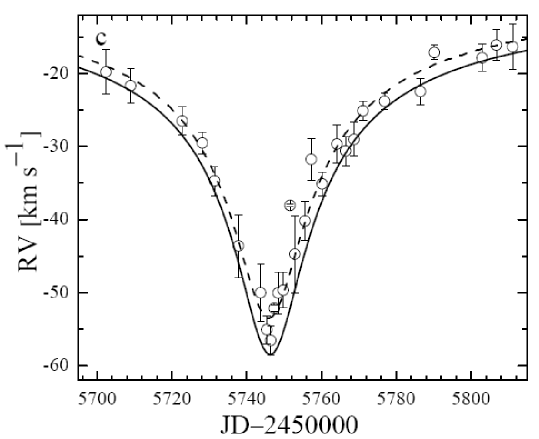
The radial velocity of the H line continued to change very close to the binary model prediction since the end of July 2011 (solid line in Fig. 1d). Overall, the effects of the secondary close passage and its interaction with the disk made the H radial velocity curve broader than in 2000. Also, the H heliocentric radial velocity curve was shifted by 6 km s-1 to the negative velocities compared to that in 2000 (Fig. 1c). The shift may be due to a different disk density distribution as well as to other possible reasons discussed in Sect. 4.
3.2 The He ii 4686 Å line
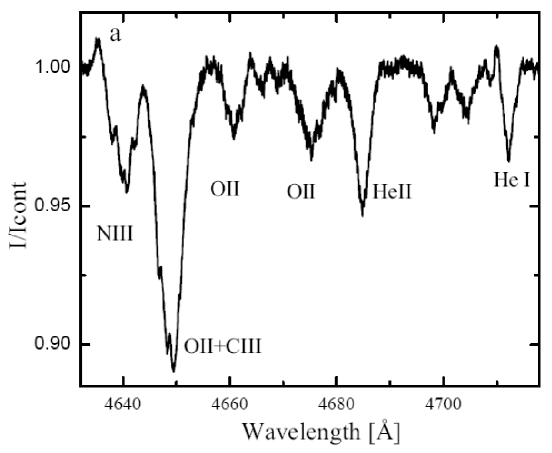
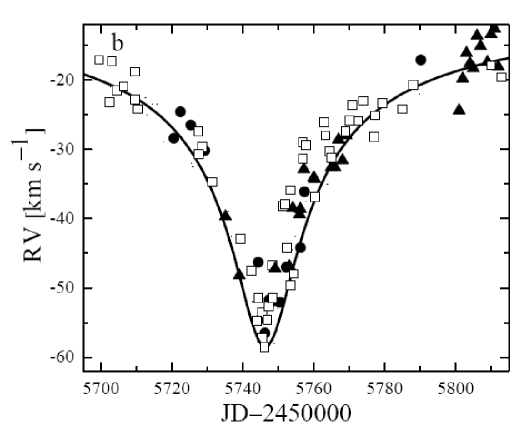
A spectral region that contains the He ii 4686 Å line is shown in Fig. 2a. The radial velocity of the He ii line was measured by fitting it to a Gaussian that for symmetric lines gives very similar results to the mirrored profile method. The measurement results are presented in Table 2. We have 115 measurements of the He ii line radial velocity between 2010 May 28 and 2012 October 12. Eighty seven of them (from 2011 May 18 and September 8) were used in the radial velocity curve fitting. These include forty measurements from the ESPaDOnS and FEROS spectra, four from IAC80, and forty three from the amateurs spectra. The He ii line profile kept stable, but its weakness (0.95 of the continuum at the minimum intensity) seemed to be the source of scatter seen in Fig. 2b. In order to minimize the scatter, we averaged the measurements within 2–3 day intervals and fitted the resulting 25 data points to a binary orbital motion model predictions.
The initial orbital parameters for the fitting were taken from recent interferometry papers (e.g., Meilland et al., 2011; Che et al., 2012). Most of them are very close to the ones obtained for the 2000 data by Miroshnichenko et al. (2001). Nevertheless, we carried out an exhaustive least square fitting allowing all the orbital parameters to vary. We also fitted both the 2000 H and 2011 He ii data sets together to check for consistency of the orbital period determination. Using data for these two lines in the same set is legitimate because the disk in 2000 was very small and hardly affected by the secondary component approach. Therefore, the H line very closely traced the motion of the primary component at that time. The best fit parameters are shown in Table 3. They are a little different for the 2000 data set, because this time we used the radial velocity semi-amplitude as a fit parameter instead of the semi-major axis, the component’s mass ratio, and the orbital inclination angle. However, the updated orbital elements are within the uncertainties given in Miroshnichenko et al. (2001) and also consistent with the recent interferometric solutions. The 2000 periastron epoch was refined from September 93 to September 10.51.0.
The best fits to both the 2011 radial velocity data and the combined 2000 and 2011 data set show that the periastron occurred on 2011 July 3, 9:20 UT, with a 0.9–day uncertainty. Thus, the interferometric result for the periastron epoch (Che et al., 2012) was confirmed spectroscopically with a shift of only 2 hours, well within the uncertainties of both measurements. Our fitting also constrained the orbital period at 3948.01.8 days, very close to the latest interferometric solutions.
The parameter errors presented in Table 3 are larger than those of the interferometric solution by Che et al. (2012). The main reason for this result is that the time period during which the radial velocity changes significantly is much shorter (2–3 months) than the system half orbital period during which interferometry data were taken. Nevertheless, spectroscopy provides an independent constraint for the radial velocity semi-amplitude which allows to derive the components masses (see Sect. 3.4).
The radial velocity curve derived for the He ii line slightly deviates from the one derived for the H line in 2000 (Fig. 2bc). It is slightly narrower and is shifted to the positive velocities by km s-1. Although the deviation seems small, it may indicate that the orbit is unstable. We study this and other related observational features in Sect. 4.
3.3 Other Spectral Variations
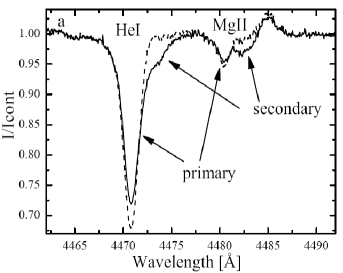
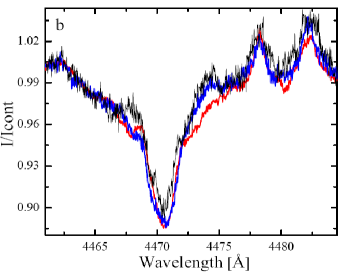
There was a hope to detect signs of the secondary component in the spectrum due to a relatively large radial velocity difference at periastron (120 km s-1). Some ideas about the secondary parameters were deduced from the system’s spectral energy distribution, orbital elements, and the components brightness ratio (an early B–type dwarf, see discussion in Miroshnichenko et al., 2001; Miroshnichenko, 2009). One of the expected signatures of the secondary is shown in the left panel of Fig. 3. This prediction is based on a sum of two spectra taken from the online archive of the Observatoire de Haute Provence (OHP) obtained with the spectrograph ELODIE444http://atlas.obs-hp.fr/elodie/ ( 48,000, Moultaka et al., 2004). We chose the B0.5 v star BS 1880 to represent the primary and the B3 v star BS 801 to represent the secondary. The sum was calculated assuming a brightness ratio of = 1.78 mag (see Sect. 1). No CS continuum contribution was added to the composite spectrum, because we only aimed at a qualitative demonstration of possible effects at periastron.
Their projected rotational velocities listed in a recent catalog by Glebocki & Gnacinski (2005) are 25–120 km s-1 for BS 1880 and 90–130 km s-1 for BS 801. Although they are not as rapid rotators as Sco (v = 148–180 km s-1 in the same catalog), we used these stars because their OHP spectra are clean and contain no other photospheric lines in the region between 4450 and 4500 Å except for the He i 4471 Å and Mg ii 4482 Å. Intensity ratio of these two lines is one of the main temperature criteria for B–type stars. The Mg ii line strengthens and the He i line weakens as the photospheric temperature decreases.
The composite spectrum may not be an accurate representation of the real situation due to uncertainties of the secondary component properties, but a broadening of the He i 4471 Å line profile was detected on the periastron day (Fig. 3b). This result can be interpreted as a detection of the secondary, although its parameters cannot be further constrained. However, it does not contradict the current view of this component (see also Meilland et al., 2011; Che et al., 2012).
3.4 The binary components masses and the system distance
There are several estimates for the mass of the primary component of Sco (M1) based on recent models of stellar evolution for the solar metallicity (e.g., Ekström et al., 2012) with (13.9 M⊙, Che et al., 2012) or without (14.6 M⊙, Pecaut, Mamajek, & Bubar, 2012) taking into account gravity darkening due to the fast rotation of the star. Combining the spectroscopic orbital solution derived here with the interferometry results (Che et al., 2012), one can estimate the components masses separately and derive the distance toward the system.
In order to do this, we calculate the system mass function (0.2440.025 M⊙) from the data presented in Table 3. We also take into account the contribution of the secondary to the observed flux (see Sect. 1), which was mentioned but not considered by Pecaut, Mamajek, & Bubar (2012). This reduces the luminosity of the primary by 0.08 dex and its mass by 0.2 M⊙ to M1 = 14.4 M⊙ in the non-rotating case.
The components mass ratio () depends on the orbital inclination angle () and the mass function. It requires to be consistent with the brightness ratio and comes to , giving an estimate for the secondary mass of M M⊙. The total mass of the binary implies an orbital semi-major axis of 13.80.2 AU The latter combined with the angular measure of the semi-major axis from interferometry (99.04 mas, Che et al., 2012) gives a distance of 140.01.5 pc toward the system.
Rapid rotation creates a temperature distribution on a star’s surface that changes its fundamental parameters depending on the rotation rate and viewing angle (gravity darkening, Townsend, Owocki, & Howarth, 2004). For Sco that is viewed at an intermediate angle and rotates at 60% of the critical rate (estimated from v = 148 km s-1, Brown & Verschueren, 1997), this effect increases its apparent luminosity by 0.2 dex and barely affects its apparent color. Taking this into account reduces M1 to 13 M⊙ and for the same changes to 1.60.1, M2 to 8.20.6 M⊙, the orbital semi-major axis to 13.50.1 AU, and the distance to 136.01.5 pc.
Our estimates for M2 are consistent with its adopted spectral type (B1–B3, Teff = 20000–24000 K), while the distance toward the system is consistent with the HIPPARCOS parallax values from both published solutions (123 and 151 pc, ESA, 1997; van Leeuwen, 2007, respectively). The new distance estimates are accounted for in the components luminosity calculation. This procedure resulted in a slightly larger orbital inclination angle compared to those determined from interferometry (, , , Meilland et al., 2011; Tycner et al., 2011; Che et al., 2012, respectively). If 33°, then M 10 M⊙ that is inconsistent with the reported components brightness ratio. No gravity darkening correction was applied to the secondary fundamental parameters, because no information about its rotation is currently available.
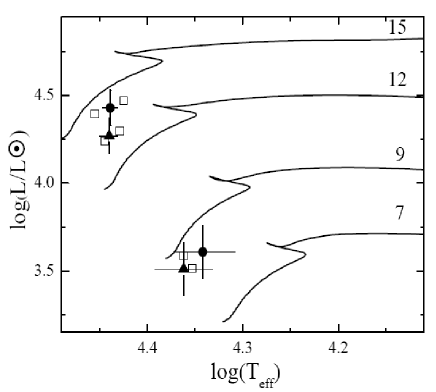
Also, the above fundamental parameters imply an age of 9–10 Myrs for both rotating and non-rotating primary mass estimates (Fig. 4). The theoretical positions for both secondary component models (8.6 M⊙ and 8.2 M⊙) with an age of 10 Myrs are within the uncertainties of our adopted parameters. The discrepancy does not seem to be dramatic and may be due to the unknown mass transfer history for the Sco system as well as not well constrained spectral properties of the secondary component.
Both sets of the mass estimates are close to each other, but the one with gravity darkening taken into account seems to be more realistic. This subject will be explored in more detail in a separate study of the system’s spectral energy distribution.
4 A New View of the Sco System
There are several facts that make Sco unusual among Be binaries. First, the Bright Star Catalog (Hoffleit & Jaschek, 1991) mentions a possible companion with a 20 day orbital period in the system (initially reported by van Hoof, Bertiau, & Deurinck, 1963). Second, most Be binaries with a non-degenerate secondary component have circular orbits (e.g., Bjorkman et al., 2002; Nemravová et al., 2012), while most Be/X-ray binaries have eccentric orbits (e.g., Reig, Fabregat, & Coe, 1997). Third, radial velocities of Sco reported in several papers throughout the 20th century show variations additional to those expected at periastra (see Sect. 4.2). The difference between the 2000 and 2011 radial velocity curves reported above may be part of the same issue. Finally, thanks to the IRAS survey of bow shocks around runaway stars (van Buren, Noriega-Crespo, & Dgani, 1995), Sco is known as a bow-shock-producing star.
Taken together, the above facts allow us to suggest the hypothesis that Sco might be a runaway triple system (cf., Gvaramadze & Menten, 2012). A number of Be stars are known to be part of triple and more complex stellar systems (e.g., Koubský et al., 2010). Below we discuss the above mentioned facts more closely and conclude whether our hypothesis is viable.
4.1 Possible origin of the high orbital eccentricity and the runaway status of the Sco system
The system orbital eccentricity is so large that component A (the Be star) and B (the interferometrically detected one) at periastron come together at a distance of 0.8 AU There are several processes that can lead to such a highly eccentric orbit: a) close dynamical encounter between a binary system and another binary or a single star (e.g., Hills, 1975; Hoffer, 1983), b) dynamical decay of a trapezium-like system (Allen & Poveda, 1974), and c) the Lidov-Kozai resonance in a hierarchical triple system (Lidov, 1962; Kozai, 1962).
The first process could also be responsible for ejection of Sco from the parent star cluster (e.g., Leonard & Duncan, 1990; Kroupa, 1998). The ejection event might have occurred when the cluster was much smaller in size and much denser. This scenario is consistent with the presence of the bow shock-like structure around Sco which is likely the result of the system (super)sonic motion through the interstellar medium.
To check the runaway status of Sco, we used the proper motion measurements for this system from the new reduction of the Hipparcos data by van Leeuwen (2007), mas , mas or, in Galactic coordinates, mas and mas . After correction for the Galactic differential rotation and the solar peculiar motion555Here we used the Galactic constants =8.0 kpc and = (Reid et al., 2009) and the solar peculiar motion (Schonrich, Binney, & Dehnen, 2010)., this proper motion translates into the transverse peculiar velocity , where and . To this velocity one should add a peculiar radial velocity of , derived from the systemic radial velocity of (Meilland et al., 2011), so that the total (three-dimensional) velocity of Sco , and its vector is inclined to the plane of the sky by an angle of . Thus, Sco is a low-velocity runaway system (cf. Gvaramadze et al., 2012). In their Figure 4, Peri et al. (2012) presented a 22 m image of an arc-like structure around Sco taken by the Wide-field Infrared Survey Explorer (WISE, Wright et al., 2010). One can see that the vector of the peculiar transverse velocity of the star is almost parallel to the symmetry axis of the structure, which supports its interpretation as a bow shock.
Sco is located within the confines of the Sco OB2 association, and the distances to both systems are comparable to each other. This might imply that Sco OB2 is the parent association of Sco. To check this possibility, one should compare the proper motion of Sco with that of Sco OB2, mas and mas (Melnik & Dambis, 2009), which also is based on the new reduction of the Hipparcos data by van Leeuwen (2007). This comparison shows that although both objects are moving almost in the same direction, there is a significant difference in the magnitudes of their proper motions. This difference could partially be caused by the effect of binarity of Sco, because, as noted by de Zeeuw et al. (1999), “the HIPPARCOS proper motion, observed during the mission lifetime of yr, does not necessarily reflect the center-of-mass proper motion”. This difference, however, could also be caused by the runaway status of Sco. Moreover, one cannot exclude the possibility that the effect of binarity could instead be responsible for some reduction of the difference in the proper motions. Taken at face value, the observed proper motions imply that Sco is moving with a transverse velocity of with respect to the association. From this, in turn, it follows that the birth place of this Myr old star should be at from the birth place of the association (provided that the age of the association is Myr as well). We conclude therefore that it is likely that Sco was injected in the Sco OB2 association from outside (cf. Gvaramadze, Pflamm-Altenburg, & Kroupa, 2011; Gvaramadze et al., 2012) and that the parent cluster of this star is located at from its current position.
We also note that it has recently been found that the orbital momentum of the secondary and the disk’s rotation vector are opposite to each other (Štefl et al., 2012; Che et al., 2012). This might imply that the Sco system was formed in the course of a few-body dynamical interaction or could be a consequence of the Lidov-Kozai resonance, if the system is triple. Detailed discussion of these possibilities, however, is beyond the scope of this paper.
4.2 Stability of the binary orbital period
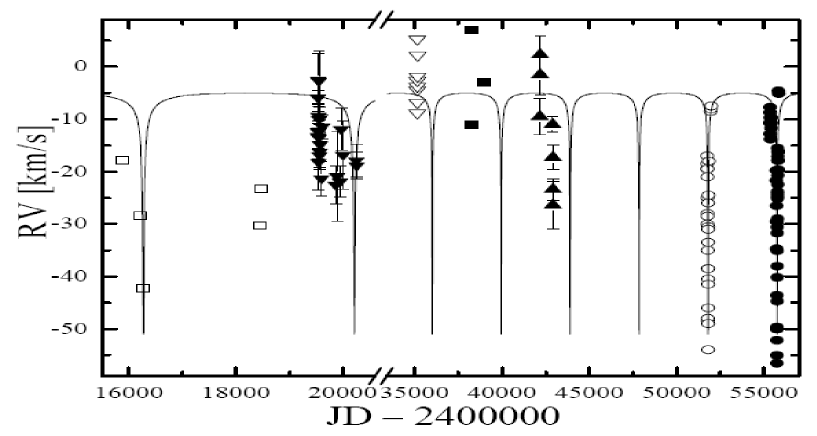
We will use radial velocity data published during the 20th century (Frost et al., 1926; van Hoof, Bertiau, & Deurinck, 1963; Thackeray, 1966; Beardsley, 1969; Levato et al., 1987) to search for the binary orbital period variations. These papers present 49 measurements obtained between 1902 and 1976. The data along with those from Miroshnichenko et al. (2001) and this work are shown in Fig. 5. Most of the historical data deviate from the expected radial velocity behavior based on the modern solution. This can be partly due to both random and systematic errors. For example, Beardsley (1969) concluded that the Allegheny observatory data presented in his work showed no variations and can be averaged. Still, some data points from Frost et al. (1926) and Beardsley (1969) match with the expected radial velocity minima due to the periastron passages.
We investigated both the historical (20th century only) and full data sets using the methods for finding periodicity from Dworetsky (1983) and Scargle (1982). Both methods are suited for unevenly spaced data, but Scargle’s method works better for nearly sinusoidal variations. The historical data miss most of the radial velocity minima that result in not well-defined extrema of the periodograms. The Dworetsky “string-length” function shows the deepest minimum for a period of 3750 days for the historical data, while the Scargle periodogram shows the highest maximum for a period of 3339 days. In both cases, it is at least 200 days shorter than the one determined from the periastra of 2000 and 2011.
Nevertheless, both methods detected the modern period when fitting the entire data collection. Dworetsky’s function peaks at 3928 days, while Scargle’s one at 3915 days. The shifts toward shorter periods are due to the historical data. They can be caused by the variable orbital period and/or errors in the radial velocity measurements.
Although the existing material does not allow us to make a definite conclusion about the reality of these shifts, it prompts us to analyze the role of a possible third component in the system in the origin of changes in the orbital period. We also examine the stability of triple systems and show that under the certain conditions the presence of the third component could be responsible for maintaining the system’s high eccentricity.
4.3 Analysis of the long-term radial velocity variations
Let us now consider stability of triple systems that may result in the observed radial velocity variations. Orbital solutions in general require numerical integration, but approximations can be obtained in some cases. In particular, stability conditions for hierarchical triple systems with a low eccentricity of the inner pair are given by the following formula (Valtonen et al., 2008):
| (1) |
where and are component masses of the main binary; is the semi-major axis of the main binary; is the mass of the third component; is the orbital eccentricity of the third component; is the periastron distance of the third component orbit from the barycenter of the main binary; and is the relative inclination of the third component orbit. This result can be used to investigate whether the component A is a binary system with an orbital period of 20 days (as was suggested by van Hoof, Bertiau, & Deurinck, 1963).
In other words, we consider a hierarchical system with an inner binary A–C and an external component B. Assuming M⊙ (see Sect. 3.4), the semi-major axis of a body at a = 20–day orbit is AU Such a triple system is stable if component B does not come closer than 1.65 AU to the center of the A–C pair. The observations show that components A and B get as close together as 0.8 AU (e.g., Miroshnichenko et al., 2001; Che et al., 2012). The ultimate fate of such a system is a breakdown at already the second revolution. We therefore concur with Miroshnichenko et al. (2001) that the 20 day period is spurious.
Next we modeled the evolution of a stable triple system with a component C that is external to the eccentric A–B binary by numerically solving a system of motion equations in Cartesian coordinates. We used the orbital parameters of the inner binary from Table 3. The masses were assumed to be 13 and 8.2 M⊙ for the components A and B, respectively (see Sect. 3.4). The goal was to constrain parameters of component C, which can be responsible for the observed difference of the radial velocity curves obtained in 2011 and in 2000 as well as for long-term period variations. The results show that there is no unique solution to this problem, although certain constraints on the external orbit can be placed. In particular, the semi-major axis of the component C orbit cannot be smaller than 67.5 AU and, therefore, its orbital period should be longer than 120 years.
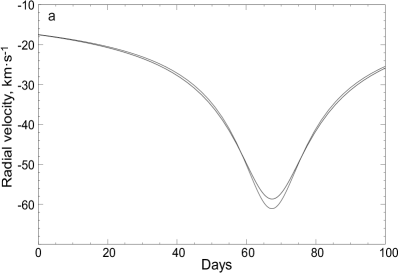
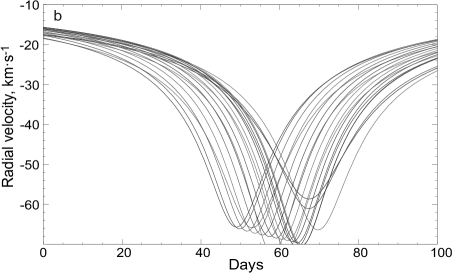
As an example, we calculated radial velocity curves for a described above triple system with an external component C that has the following parameters: mass MC = 1.5 M⊙, semi-major axis AU, eccentricity , inclination of the orbit to the orbital plane of the inner binary , periastron longitude , and the mean anomaly for 2011 July 4. Two consecutive orbital cycles of this system demonstrate that the radial velocity curve can change similarly to the observed behavior for Sco (Fig. 6a), while twenty of them show how orbital period can change over one orbit of the external component(Fig. 6b).
The mechanism responsible for the orbital variations of the inner binary is known as the above mentioned Lidov-Kozai resonance. It occurs in hierarchical triple systems, in which the external component orbit is tilted with respect to that of the inner binary. This situation leads to precession of the orbits around the direction of the total moment of impulse of the system. Additionally, if the inclination between the inner and the outer orbit exceeds , the precession is accompanied by the angular momentum exchange between the orbits. The latter manifests itself by cyclic variations of both orbit eccentricities. A detailed analysis of this effect is given by Valtonen & Karttunen (2006).
Since the evolution of a binary system due to tidal friction could lead to a secular decrease of the orbital eccentricity (e.g., Zahn, 2008), it is likely that the large current eccentricity of the Sco system implies an inclination of the component C orbit of . This limits the set of orbital solutions capable of explaining the observed radial velocity variations.
Component C can be located as far as 03 to 08 from the center of mass of the inner binary, but it has not been detected yet. We can suggest several explanations for this result. First, the component C orbital period is very long (213 years for the orbital solution shown in Fig. 6). If component C is a normal star born in the same cluster, it should be nearly 8 mag fainter (for M = 1.5 M⊙, Ekström et al., 2012) than component A. Such a faint star can probably be directly detected by interferometry, which has only been used to observe the system for the last 40 years. During this time period, component C might have been projectionally close to the inner binary. Also, the high brightness contrast might have hampered the detection.
5 Conclusions
The spectroscopic observational campaign of the 2011 periastron passage in the Sco system was successful and resulted in a new measurement of the orbital period ( years or days). We also determined orbital elements using the radial velocity curve for the He ii 4686 Å line which turned out to be very close to those found from the H radial velocity data during the previous periastron passage in 2000. Using the new orbital solution and recent evolutionary models with rotation (Ekström et al., 2012), we derived new masses of the binary components corrected for gravity darkening of the primary (13 and 8.2 M⊙). These estimates along with the refined angular semi-major axis of the binary orbit (Che et al., 2012) imply that Sco is located at a distance of 137 pc from the Sun that is consistent with both alternative solutions for the HIPPARCOS parallax. The radial velocity and line profile variations observed in the H line near the 2011 periastron were affected by the interaction of the secondary component and the CS disk around the primary component. Using these data, we estimated a disk radius of 150 R⊙. This result is consistent with previous interferometric measurements of the disk radius (e.g., Meilland et al., 2011) and indicates that the disk was most likely growing during the entire time between the last two periastron passages.
We have detected a signature of the secondary component, but not clearly revealed its properties. This result is consistent with an early B–type spectral type for this component. The radial velocity curve for the He ii line slightly deviates from that derived in 2000 for the H line. This result along with the high eccentricity of the system and the presence of a bow shock-like structure around it suggest that Sco might have a third component, external to the interferometric binary, and be a runaway object, dynamically ejected from its parent cluster. If the third component is indeed present, then the orbital elements presented in Table 3 may change in the future. The system needs constant observational attention to verify this suggestion.
Finally, the campaign confirmed that amateur spectroscopy becomes an important factor in astronomy of emission-line stars. It is very important to continue observing Sco spectroscopically, photometrically, and interferometrically to search for more clues about the nature of this unusual stellar system.
References
- Allen & Poveda (1974) Allen, C., & Poveda, A. 1974, In “The stability of the solar system and of small stellar systems”, Dordrecht, D. Reidel Publishing Co., 239
- Beardsley (1969) Beardsley, W. R. 1969, Publications of the Allegheny Observatory of the University of Pittsburgh, Vol. VIII, No. 7, 91
- Bjorkman et al. (2002) Bjorkman, K. S., Miroshnichenko, A. S., McDavid, D. A., & Pogrosheva, T. M. 2002, ApJ, 573, 812
- Brown & Verschueren (1997) Brown, A. G. A., & Verschueren, W. 1997, A&A, 319, 811
- Carciofi et al. (2006) Carciofi, A. C., Miroshnichenko, A. S., Kusakin, A. V., et al. 2006, ApJ, 652, 1617
- Che et al. (2012) Che, X., Monnier, J. D., Tycner, C., et al. 2012, ApJ, 757, 29
- Côté & van Kerkwijk (1993) Côté, J., & van Kerkwijk, M. H. 1993, A&A, 274, 870
- de Zeeuw et al. (1999) de Zeeuw, P. T., Hoogerwerf, R., de Bruijne, J. H. J., Brown, A. G. A., & Blaauw, A. 1999, AJ, 117, 354
- Donati et al. (1997) Donati, J.-S., Semel, M., Carter, B. D., Rees, D. E., & Collier Cameron, A. 1997, MNRAS, 291, 658
- Dworetsky (1983) Dwortesky, M. M. 1983, MNRAS, 203, 917
- Eggleton (1983) Eggleton, P. P. 1983, ApJ, 268, 368
- Ekström et al. (2012) Ekström, S., Georgy, C., Eggenberger, P., et al. 2012, A&A, 537, A146
- ESA (1997) ESA 1997, The Hipparcos Catalogue, ESA SP-1200
- Fabregat, Reig, & Otero (2000) Fabregat, J., Reig, P., & Otero, S. 2000, IAU Circ., No. 7461
- Fahed et al. (2011) Fahed, R., Moffat, A. F. J., Zorec, J., et al. 2011, MNRAS, 418, 2
- Frost et al. (1926) Frost, E. B., Barrett, S. B., & Struve, O. 1926, ApJ, 64, 1
- Glebocki & Gnacinski (2005) Glebocki, R., & Gnacinski, P. 2005, VizieR On-line Data Catalog: III/244
- Gvaramadze, Pflamm-Altenburg, & Kroupa (2011) Gvaramadze, V. V., Pflamm-Altenburg, J., & Kroupa, P. 2011, A&A, 525, A17
- Gvaramadze & Menten (2012) Gvaramadze, V. V., & Menten, K.M. 2012, A&A, 541, A7
- Gvaramadze et al. (2012) Gvaramadze, V. V., Weidner, C., Kroupa, P., & Pflamm-Altenburg, J. 2012, MNRAS, 424, 3037
- Haubois et al. (2012) Haubois, X., Carciofi, A.C., Rivinius, T., Okazaki, A.T., & Bjorkman, J.E. 2012, ApJ, 756, 156
- Hartkopf et al. (1996) Hartkopf, W. I., Mason, B. D., McAlister, H. A., et al. 1996, AJ, 111, 936
- Hills (1975) Hills, J.S. 1975, AJ, 80, 809
- Hoffer (1983) Hoffer, J.B. 1983, AJ, 88, 1420
- Hoffleit & Jaschek (1991) Hoffleit, D., & Jaschek, C. 1991, The Bright star catalogue, New Haven, Conn.: Yale University Observatory
- Kaufer et al. (2000) Kaufer, A., Stahl, O., Tubbesing, S., et al. 2000, SPIE, 4008, 459
- Koubský (2005) Koubský, P. 2005, Ap&SS, 296, 165
- Koubský et al. (2010) Koubský, P., Hummell, C.A., Harmanec, P., et al. 2010, A&A, 517, A24
- Kozai (1962) Kozai, Y. 1962, AJ, 67, 591
- Kroupa (1998) Kroupa, P. 1998, MNRAS, 298, 231
- Leonard & Duncan (1990) Leonard, P. J. T., & Duncan, M. J. 1990, AJ, 99, 608
- Levato et al. (1987) Levato, H., Malaroda, S., Morell, N., & Soliveila, G. 1987, ApJS, 64, 487
- Lidov (1962) Lidov, M.L. 1962, Planetary and Space Science, 9, 719
- Meilland et al. (2011) Meilland, A., Delaa, O., Stee, Ph., et al. 2011, A&A, 532, A80
- Melnik & Dambis (2009) Melnik, A.M., & Dambis, A.K. 2009, MNRAS, 400, 518
- Millan-Gabet et al. (2010) Millan-Gabet, R., Monnier, J. D., Touhami, Y., et al. 2010, ApJ, 723, 544
- Miroshnichenko et al. (2001) Miroshnichenko, A. S., Fabregat, J., Bjorkman, K. S., et al. 2001, A&A, 377, 485
- Miroshnichenko et al. (2003) Miroshnichenko, A. S., Bjorkman, K. S., Morrison, N. D., et al. 2003, A&A, 408, 305
- Miroshnichenko (2009) Miroshnichenko, A. S. 2009, Be Star Newsletter, No. 39
- Moultaka et al. (2004) Moultaka, J., Ilovaisky, S. A., Prugniel, P., Soubiran, C. 2004, PASP, 116, 693
- Nemravová et al. (2012) Nemravová, J., Harmanec, P., Koubský, P., et al. 2012, A&A, 537, A59
- Pecaut, Mamajek, & Bubar (2012) Pecaut, M. J., Mamajek, E. E., Bubar, E. J. 2012, ApJ, 746, 154
- Peri et al. (2012) Peri, C. S., Benaglia, P., Brookes, D. P., Stevens, I. R., Isequilla, N. L. 2012, A&A, 538, A108
- Reid et al. (2009) Reid, M. J., Menten, K. M., Zheng, X. W., Brunthaler, A., Xu, Y. 2009, ApJ, 705, 1548
- Reig, Fabregat, & Coe (1997) Reig, P., Fabregat, J., & Coe, M. 1997, A&A, 322, 193
- Rivinius et al. (2012) Rivinius, T., Štefl, S., Baade, D., Carciofi, A. C., Otero, S., Miroshnichenko, A. S., & Manset, N. 2012, in Circumstellar Dynamics at High Resolution, eds. A. Carciofi and Th. Rivinius, ASP Conf. Ser., 464, 235
- Scargle (1982) Scargle, J.D. 1982, ApJ, 263, 835
- Schonrich, Binney, & Dehnen (2010) Schönrich, R., Binney, J., & Dehnen, W. 2010, MNRAS, 403, 1829
- Štefl et al. (2012) Štefl, S., LeBouquin, J.-B., Rivinius, T., et al. 2012, in Circumstellar Dynamics at High Resolution, eds. A. Carciofi and Th. Rivinius, ASP Conf. Ser., 464, 197
- Thackeray (1966) Thackeray, A.D. 1966, MmRAS, 70, 33
- Tango et al. (2009) Tango, W. J., Davis, J., Jacob, A. P., et al. 2009, MNRAS, 396, 842
- Townsend, Owocki, & Howarth (2004) Townsend, R. H. D., Owocki, S. P., & Howarth, I. D. 2004, MNRAS, 350, 189
- Tycner et al. (2011) Tycner, C., Ames, A., Zavala, R. T., et al. 2011, ApJ, 729, L5
- Valtonen & Karttunen (2006) Valtonen, M., & Karttunen, H. 2006, The Three-Body Problem, Cambridge UK, Cambridge University Press
- Valtonen et al. (2008) Valtonen, M., Mylläri, A., Orlov, V., Rubinov, A. 2008, in Dynamical Evolution of Dense Stellar Systems, Proc. IAU Symp. 246, 209
- van Buren, Noriega-Crespo, & Dgani (1995) van Buren, D., Noriega-Crespo, A., & Dgani, R. 1995, AJ, 110, 2914
- van Hoof, Bertiau, & Deurinck (1963) van Hoof, A., Bertiau, F.C., & Deurinck, R. 1963, ApJ, 137, 824
- van Leeuwen (2007) van Leeuwen, F. 2007, A&A, 474, 653
- Werner et al. (2004) Werner, M. W., Roellig, T. L., Low, F. J., et al. 2004, ApJS, 154, 1
- Wright et al. (2010) Wright, E. L., Eisenhardt, P. R. M., Mainzer, A. K., et al. 2010, AJ, 140, 1868
- Zahn (2008) Zahn, J.-P. 2008, EAS Publications Series, 29, 67
| Date | JD2450000+ | RV | Error | Source |
|---|---|---|---|---|
| MM/DD/YYYY | days | km s-1 | km s-1 | |
| 05/28/2010 | 5344.835 | -2.6 | 0.5 | 1 |
| 05/30/2010 | 5346.835 | -1.7 | 0.6 | 1 |
| 06/03/2010 | 5350.779 | -2.0 | 0.5 | 1 |
| 06/04/2010 | 5351.802 | -2.5 | 0.2 | 1 |
| 06/19/2010 | 5366.766 | -3.5 | 0.1 | 1 |
| 06/22/2010 | 5369.747 | -2.7 | 0.3 | 1 |
| 06/25/2010 | 5372.901 | -4.0 | 0.1 | 1 |
| 07/22/2010 | 5399.741 | -0.5 | 0.3 | 1 |
| 07/25/2010 | 5402.743 | -1.3 | 0.2 | 1 |
| 07/27/2010 | 5404.763 | -0.6 | 0.1 | 1 |
| 07/31/2010 | 5408.742 | -1.2 | 0.2 | 1 |
| 08/05/2010 | 5413.842 | -2.3 | 0.9 | 1 |
| 10/05/2010 | 5474.929 | -3.5 | 0.6 | 6 |
| 10/10/2010 | 5479.927 | -3.8 | 1.5 | 6 |
| 10/21/2010 | 5490.913 | -6.0 | 0.3 | 6 |
| 01/10/2011 | 5571.762 | -15.1 | 3.4 | 4 |
| 01/16/2011 | 5577.729 | -14.5 | 3.0 | 4 |
| 01/20/2011 | 5581.745 | -13.4 | 3.1 | 4 |
| 01/23/2011 | 5584.749 | -14.1 | 3.0 | 4 |
| 01/23/2011 | 5585.363 | -14.9 | 2.2 | 2 |
| 01/28/2011 | 5589.704 | -15.7 | 1.6 | 8 |
| 01/30/2011 | 5591.707 | -12.8 | 1.8 | 8 |
| 02/09/2011 | 5601.725 | -11.2 | 3.0 | 4 |
| 03/07/2011 | 5628.349 | -6.7 | 2.3 | 2 |
| 03/09/2011 | 5629.641 | -14.1 | 2.7 | 9 |
| 03/10/2011 | 5630.658 | -14.1 | 3.0 | 9 |
| 03/13/2011 | 5634.399 | -7.3 | 2.2 | 2 |
| 03/16/2011 | 5637.392 | -7.4 | 2.8 | 2 |
| 03/29/2011 | 5649.566 | -17.7 | 1.2 | 8 |
| 04/05/2011 | 5656.605 | -17.5 | 2.4 | 9 |
| 04/06/2011 | 5657.558 | -19.1 | 2.6 | 9 |
| 04/09/2011 | 5660.542 | -13.9 | 4.7 | 5 |
| 04/15/2011 | 5667.488 | -11.0 | 3.6 | 5 |
Table 1. continued
| Date | JD2450000+ | RV | Error | Source |
|---|---|---|---|---|
| MM/DD/YYYY | days | km s-1 | ||
| 04/16/2011 | 5668.391 | -6.4 | 1.1 | 2 |
| 04/25/2011 | 5677.378 | -7.0 | 1.1 | 2 |
| 04/27/2011 | 5678.600 | -13.2 | 3.9 | 5 |
| 04/30/2011 | 5681.561 | -16.5 | 5.6 | 5 |
| 05/03/2011 | 5685.514 | -11.1 | 4.9 | 4 |
| 05/11/2011 | 5692.535 | -11.7 | 5.2 | 4 |
| 05/20/2011 | 5702.463 | -10.9 | 1.0 | 5 |
| 05/22/2011 | 5704.443 | -16.8 | 5.1 | 4 |
| 05/27/2011 | 5709.507 | -13.0 | 0.9 | 5 |
| 05/28/2011 | 5709.573 | -12.1 | 0.4 | 4 |
| 05/29/2011 | 5710.400 | -11.9 | 3.3 | 4 |
| 06/01/2011 | 5713.960 | -14.5 | 0.8 | 6 |
| 06/01/2011 | 5714.371 | -23.5 | 2.4 | 8 |
| 06/02/2011 | 5715.381 | -15.8 | 1.6 | 8 |
| 06/08/2011 | 5720.529 | -18.3 | 2.0 | 1 |
| 06/08/2011 | 5721.026 | -18.4 | 2.1 | 1 |
| 06/08/2011 | 5721.395 | -24.7 | 2.0 | 8 |
| 06/09/2011 | 5722.407 | -19.7 | 1.8 | 1 |
| 06/11/2011 | 5723.797 | -19.1 | 0.3 | 6 |
| 06/11/2011 | 5724.445 | -22.8 | 3.9 | 7 |
| 06/12/2011 | 5725.318 | -21.6 | 1.9 | 1 |
| 06/14/2011 | 5727.387 | -32.3 | 2.4 | 8 |
| 06/14/2011 | 5727.436 | -29.6 | 4.8 | 4 |
| 06/14/2011 | 5727.446 | -26.7 | 2.6 | 5 |
| 06/15/2011 | 5728.459 | -33.7 | 7.3 | 4 |
| 06/16/2011 | 5729.269 | -26.9 | 1.8 | 1 |
| 06/16/2011 | 5729.380 | -43.0 | 3.2 | 8 |
| 06/18/2011 | 5731.406 | -31.2 | 1.3 | 5 |
| 06/21/2011 | 5734.412 | -42.5 | 3.6 | 8 |
| 06/22/2011 | 5735.087 | -34.9 | 1.8 | 2 |
| 06/22/2011 | 5735.380 | -42.2 | 3.9 | 8 |
| 06/24/2011 | 5737.394 | -45.4 | 4.5 | 8 |
| 06/26/2011 | 5738.984 | -41.9 | 1.2 | 2 |
Table 1. continued
| Date | JD2450000+ | RV | Error | Source |
|---|---|---|---|---|
| MM/DD/YYYY | days | km s-1 | ||
| 06/26/2011 | 5739.387 | -49.4 | 0.6 | 8 |
| 06/27/2011 | 5740.374 | -52.2 | 0.3 | 8 |
| 06/28/2011 | 5741.503 | -49.4 | 1.0 | 3 |
| 06/29/2011 | 5741.939 | -51.0 | 0.4 | 6 |
| 06/29/2011 | 5742.396 | -49.5 | 0.8 | 3 |
| 07/01/2011 | 5743.905 | -50.6 | 1.5 | 6 |
| 07/01/2011 | 5744.301 | -49.4 | 0.7 | 1 |
| 07/02/2011 | 5744.555 | -49.2 | 0.3 | 3 |
| 07/02/2011 | 5745.241 | -47.9 | 0.9 | 1 |
| 07/03/2011 | 5745.502 | -48.1 | 0.3 | 4 |
| 07/03/2011 | 5745.543 | -47.4 | 0.5 | 3 |
| 07/03/2011 | 5746.119 | -47.4 | 0.6 | 6 |
| 07/03/2011 | 5746.241 | -48.4 | 1.4 | 1 |
| 07/04/2011 | 5746.521 | -47.0 | 1.4 | 3 |
| 07/04/2011 | 5746.938 | -50.0 | 1.5 | 6 |
| 07/04/2011 | 5747.377 | -49.4 | 2.3 | 4 |
| 07/04/2011 | 5747.428 | -49.2 | 1.9 | 1 |
| 07/05/2011 | 5747.549 | -48.8 | 1.6 | 3 |
| 07/05/2011 | 5748.383 | -52.6 | 1.1 | 8 |
| 07/05/2011 | 5748.407 | -47.9 | 2.1 | 1 |
| 07/06/2011 | 5748.548 | -48.6 | 1.7 | 3 |
| 07/06/2011 | 5749.122 | -49.2 | 2.0 | 2 |
| 07/07/2011 | 5749.549 | -47.6 | 1.5 | 3 |
| 07/07/2011 | 5750.409 | -44.5 | 0.2 | 8 |
| 07/07/2011 | 5750.432 | -49.0 | 0.8 | 1 |
| 07/08/2011 | 5750.546 | -46.7 | 1.8 | 3 |
| 07/08/2011 | 5751.372 | -44.7 | 1.6 | 8 |
| 07/09/2011 | 5751.880 | -41.5 | 1.0 | 6 |
| 07/09/2011 | 5752.259 | -39.6 | 0.5 | 1 |
| 07/10/2011 | 5753.090 | -42.0 | 1.0 | 2 |
| 07/11/2011 | 5754.085 | -44.8 | 1.5 | 2 |
| 07/11/2011 | 5754.366 | -50.1 | 3.4 | 8 |
| 07/13/2011 | 5755.976 | -44.1 | 1.3 | 2 |
Table 1. continued
| Date | JD2450000+ | RV | Error | Source |
|---|---|---|---|---|
| MM/DD/YYYY | days | km s-1 | ||
| 07/13/2011 | 5756.189 | -43.9 | 1.1 | 2 |
| 07/13/2011 | 5756.281 | -44.2 | 1.3 | 1 |
| 07/14/2011 | 5756.897 | -42.1 | 1.0 | 6 |
| 07/14/2011 | 5757.211 | -43.6 | 0.7 | 2 |
| 07/14/2011 | 5757.388 | -43.6 | 1.0 | 1 |
| 07/15/2011 | 5757.882 | -46.5 | 2.4 | 6 |
| 07/15/2011 | 5758.371 | -45.9 | 1.2 | 8 |
| 07/17/2011 | 5759.961 | -38.3 | 1.0 | 2 |
| 07/17/2011 | 5760.245 | -37.9 | 1.2 | 2 |
| 07/17/2011 | 5760.398 | -38.4 | 1.8 | 4 |
| 07/20/2011 | 5762.932 | -34.8 | 1.4 | 6 |
| 07/20/2011 | 5763.372 | -32.1 | 1.4 | 8 |
| 07/20/2011 | 5763.383 | -35.4 | 2.0 | 4 |
| 07/21/2011 | 5764.440 | -31.2 | 3.8 | 4 |
| 07/22/2011 | 5764.952 | -32.2 | 0.7 | 2 |
| 07/22/2011 | 5765.450 | -32.3 | 5.3 | 4 |
| 07/23/2011 | 5765.963 | -31.7 | 1.2 | 2 |
| 07/23/2011 | 5766.362 | -32.2 | 1.0 | 4 |
| 07/23/2011 | 5766.393 | -29.7 | 0.8 | 8 |
| 07/24/2011 | 5766.974 | -30.6 | 1.6 | 2 |
| 07/25/2011 | 5768.086 | -29.8 | 1.1 | 2 |
| 07/26/2011 | 5769.085 | -29.6 | 1.3 | 2 |
| 07/29/2011 | 5772.346 | -27.3 | 0.7 | 5 |
| 07/30/2011 | 5773.360 | -26.0 | 1.2 | 5 |
| 08/01/2011 | 5775.347 | -24.2 | 0.7 | 5 |
| 08/02/2011 | 5776.345 | -23.2 | 0.7 | 5 |
| 08/03/2011 | 5777.344 | -22.2 | 1.4 | 5 |
| 08/04/2011 | 5778.356 | -22.0 | 0.9 | 5 |
| 08/05/2011 | 5779.348 | -20.8 | 1.2 | 5 |
| 08/11/2011 | 5784.968 | -15.4 | 1.5 | 6 |
| 08/12/2011 | 5786.012 | -16.1 | 1.8 | 6 |
| 08/14/2011 | 5788.024 | -14.8 | 1.0 | 6 |
Table 1. continued
| Date | JD2450000+ | RV | Error | Source |
|---|---|---|---|---|
| MM/DD/YYYY | days | km s-1 | ||
| 08/16/2011 | 5790.228 | -14.5 | 0.5 | 1 |
| 08/19/2011 | 5793.331 | -10.5 | 3.4 | 5 |
| 08/27/2011 | 5800.985 | -9.4 | 2.2 | 2 |
| 08/28/2011 | 5801.972 | -9.4 | 2.0 | 2 |
| 08/29/2011 | 5803.065 | -9.0 | 2.3 | 2 |
| 08/30/2011 | 5804.044 | -10.7 | 2.5 | 2 |
| 08/31/2011 | 5805.001 | -11.2 | 2.4 | 2 |
| 09/01/2011 | 5806.053 | -12.9 | 3.5 | 2 |
| 09/02/2011 | 5807.025 | -11.9 | 2.9 | 2 |
| 09/04/2011 | 5808.998 | -11.0 | 1.9 | 2 |
| 09/05/2011 | 5809.963 | -10.0 | 2.7 | 6 |
| 09/05/2011 | 5809.995 | -12.0 | 1.8 | 2 |
| 09/05/2011 | 5810.023 | -8.7 | 2.9 | 6 |
| 09/06/2011 | 5810.982 | -11.4 | 2.6 | 2 |
| 09/07/2011 | 5811.990 | -10.9 | 2.4 | 2 |
| 10/02/2011 | 5836.916 | -10.1 | 1.2 | 6 |
| 10/12/2011 | 5846.913 | -11.7 | 0.2 | 6 |
Column information: (1) – Observing date, (2) – Julian date, (3)
– measured heliocentric radial velocity, (4) – r.m.s. error of the
mirrored fit to the line profile, (5) – source of the spectrum: 1
– ESPaDOnS (CFHT), 2 – FEROS at the 1.52m ESO telescope, 3 –
IAC80 telescope of the Teide Observatory, 4 – C. Buil, 5 – T.
Garrel, 6 – B. Heathcote, 7 – J. Ribeiro, 8 – E. Pollmann, 9 –
O. Thizy.
| Date | JD2450000+ | RV | Error | Source |
|---|---|---|---|---|
| MM/DD/YYYY | days | km s-1 | ||
| 5/28/2010 | 5344.835 | -10.7 | 0.0035 | 1 |
| 5/30/2010 | 5346.835 | -12.8 | 0.0014 | 1 |
| 6/3/2010 | 5350.779 | -7.7 | 0.0028 | 1 |
| 6/4/2010 | 5351.802 | -8.7 | 0.0017 | 1 |
| 6/19/2010 | 5366.766 | -10.7 | 0.0018 | 1 |
| 6/22/2010 | 5369.747 | -9.7 | 0.0019 | 1 |
| 6/25/2010 | 5372.901 | -13.8 | 0.0020 | 1 |
| 7/22/2010 | 5399.741 | -9.7 | 0.0019 | 1 |
| 7/25/2010 | 5402.743 | -9.7 | 0.0020 | 1 |
| 7/27/2010 | 5404.763 | -10.7 | 0.0026 | 1 |
| 7/31/2010 | 5408.742 | -9.7 | 0.0025 | 1 |
| 8/5/2010 | 5413.842 | -11.7 | 0.0030 | 1 |
| 1/10/2011 | 5571.762 | -20.5 | 0.0021 | 4 |
| 1/16/2011 | 5577.729 | -14.8 | 0.0039 | 4 |
| 1/20/2011 | 5581.745 | -14.2 | 0.0030 | 4 |
| 1/23/2011 | 5584.749 | -11.7 | 0.0034 | 4 |
| 1/23/2011 | 5585.363 | -11.8 | 0.0027 | 2 |
| 2/9/2011 | 5601.725 | -13.0 | 0.0027 | 4 |
| 3/6/2011 | 5626.717 | -19.4 | 0.0025 | 4 |
| 3/7/2011 | 5628.349 | -21.9 | 0.0033 | 2 |
| 3/13/2011 | 5634.399 | -14.0 | 0.0054 | 2 |
| 3/16/2011 | 5637.392 | -12.1 | 0.0038 | 2 |
| 3/25/2011 | 5645.632 | -18.0 | 0.0040 | 4 |
| 4/16/2011 | 5667.567 | -14.0 | 0.0029 | 4 |
| 4/16/2011 | 5667.603 | -8.2 | 0.0026 | 7 |
| 4/16/2011 | 5668.391 | -17.0 | 0.0038 | 2 |
| 4/25/2011 | 5677.378 | -6.9 | 0.0038 | 2 |
| 4/28/2011 | 5679.559 | -24.6 | 0.0030 | 4 |
| 5/3/2011 | 5685.514 | -13.8 | 0.0025 | 4 |
| 5/11/2011 | 5692.535 | -15.5 | 0.0031 | 4 |
| 5/17/2011 | 5699.491 | -17.1 | 0.0038 | 5 |
Table 2. continued
| Date | JD2450000+ | RV | Error | Source |
|---|---|---|---|---|
| MM/DD/YYYY | days | km s-1 | ||
| 5/20/2011 | 5702.431 | -23.2 | 0.0037 | 5 |
| 5/21/2011 | 5703.053 | -17.3 | 0.0019 | 6 |
| 5/22/2011 | 5704.443 | -21.5 | 0.0039 | 4 |
| 5/24/2011 | 5706.427 | -20.9 | 0.0031 | 5 |
| 5/27/2011 | 5709.507 | -18.8 | 0.0038 | 5 |
| 5/28/2011 | 5709.573 | -22.8 | 0.0025 | 4 |
| 5/28/2011 | 5710.400 | -24.2 | 0.0031 | 4 |
| 6/7/2011 | 5721.026 | -29.8 | 0.0028 | 1 |
| 6/10/2011 | 5722.405 | -25.5 | 0.0043 | 1 |
| 6/12/2011 | 5724.565 | -41.1 | 0.0039 | 7 |
| 6/14/2011 | 5727.436 | -28.1 | 0.0027 | 4 |
| 6/14/2011 | 5727.446 | -30.7 | 0.0039 | 5 |
| 6/15/2011 | 5728.459 | -29.7 | 0.0038 | 4 |
| 6/17/2011 | 5729.268 | -29.6 | 0.0023 | 1 |
| 6/18/2011 | 5731.396 | -43.9 | 0.0031 | 4 |
| 6/18/2011 | 5731.406 | -34.7 | 0.0031 | 5 |
| 6/22/2011 | 5735.087 | -39.7 | 0.0060 | 2 |
| 6/25/2011 | 5738.984 | -48.2 | 0.0044 | 2 |
| 6/26/2011 | 5739.359 | -42.9 | 0.0033 | 4 |
| 6/29/2011 | 5742.396 | -57.5 | 0.0035 | 3 |
| 6/29/2011 | 5742.921 | -55.8 | 0.0063 | 6 |
| 7/1/2011 | 5743.551 | -53.0 | 0.0027 | 3 |
| 7/1/2011 | 5743.880 | -49.9 | 0.0059 | 6 |
| 7/1/2011 | 5744.374 | -51.5 | 0.0023 | 4 |
| 7/2/2011 | 5745.415 | -57.2 | 0.0027 | 3 |
| 7/2/2011 | 5745.480 | -53.6 | 0.0029 | 4 |
| 7/3/2011 | 5746.105 | -56.6 | 0.0069 | 6 |
| 7/4/2011 | 5746.938 | -54.6 | 0.0047 | 6 |
| 7/5/2011 | 5747.362 | -52.6 | 0.0040 | 4 |
| 7/6/2011 | 5748.419 | -44.2 | 0.0260 | 3 |
| 7/6/2011 | 5748.453 | -51.5 | 0.0032 | 4 |
| 7/6/2011 | 5749.122 | -47.2 | 0.0040 | 2 |
Table 2. continued
| Date | JD2450000+ | RV | Error | Source |
|---|---|---|---|---|
| MM/DD/YYYY | days | km s-1 | ||
| 7/9/2011 | 5751.354 | -38.2 | 0.0027 | 4 |
| 7/9/2011 | 5751.880 | -37.9 | 0.0094 | 6 |
| 7/10/2011 | 5752.358 | -44.2 | 0.0029 | 4 |
| 7/10/2011 | 5753.090 | -46.9 | 0.0042 | 2 |
| 7/11/2011 | 5753.360 | -49.6 | 0.0031 | 4 |
| 7/11/2011 | 5753.397 | -35.9 | 0.0035 | 4 |
| 7/11/2011 | 5754.085 | -38.5 | 0.0037 | 2 |
| 7/12/2011 | 5754.352 | -48.0 | 0.0026 | 4 |
| 7/12/2011 | 5755.976 | -39.4 | 0.0043 | 2 |
| 7/13/2011 | 5756.189 | -38.6 | 0.0047 | 2 |
| 7/14/2011 | 5756.880 | -31.3 | 0.0029 | 5 |
| 7/14/2011 | 5756.897 | -29.0 | 0.0064 | 6 |
| 7/14/2011 | 5757.211 | -32.9 | 0.0058 | 2 |
| 7/15/2011 | 5757.882 | -29.4 | 0.0057 | 6 |
| 7/17/2011 | 5759.961 | -34.1 | 0.0048 | 2 |
| 7/17/2011 | 5760.245 | -34.3 | 0.0036 | 2 |
| 7/18/2011 | 5760.373 | -36.9 | 0.0021 | 4 |
| 7/20/2011 | 5762.932 | -26.1 | 0.0041 | 6 |
| 7/21/2011 | 5763.363 | -28.0 | 0.0026 | 4 |
| 7/22/2011 | 5764.426 | -30.3 | 0.0035 | 4 |
| 7/22/2011 | 5764.952 | -32.6 | 0.0035 | 2 |
| 7/22/2011 | 5764.961 | -31.2 | 0.0050 | 6 |
| 7/23/2011 | 5765.963 | -32.6 | 0.0037 | 2 |
| 7/24/2011 | 5766.974 | -28.6 | 0.0050 | 2 |
| 7/25/2011 | 5768.086 | -31.6 | 0.0039 | 2 |
| 7/26/2011 | 5768.947 | -27.4 | 0.0053 | 6 |
| 7/26/2011 | 5769.085 | -28.0 | 0.0038 | 2 |
| 7/27/2011 | 5770.071 | -25.8 | 0.0057 | 6 |
| 7/28/2011 | 5770.969 | -23.6 | 0.0052 | 6 |
| 7/29/2011 | 5772.343 | -25.9 | 0.0038 | 5 |
Table 2. continued
| Date | JD2450000+ | RV | Error | Source |
|---|---|---|---|---|
| MM/DD/YYYY | days | km s-1 | ||
| 7/31/2011 | 5774.007 | -23.0 | 0.0061 | 6 |
| 8/3/2011 | 5777.056 | -28.2 | 0.0730 | 6 |
| 8/3/2011 | 5777.334 | -25.1 | 0.0041 | 5 |
| 8/5/2011 | 5779.335 | -23.3 | 0.0042 | 5 |
| 8/11/2011 | 5784.953 | -24.2 | 0.0056 | 6 |
| 8/12/2011 | 5785.994 | -15.5 | 0.0044 | 6 |
| 8/14/2011 | 5788.023 | -20.7 | 0.0080 | 6 |
| 8/27/2011 | 5800.985 | -24.4 | 0.0020 | 2 |
| 8/28/2011 | 5801.972 | -19.8 | 0.0037 | 2 |
| 8/29/2011 | 5803.065 | -16.1 | 0.0043 | 2 |
| 8/30/2011 | 5804.044 | -17.6 | 0.0038 | 2 |
| 8/31/2011 | 5805.001 | -18.3 | 0.0022 | 2 |
| 9/1/2011 | 5806.053 | -13.6 | 0.0034 | 2 |
| 9/2/2011 | 5807.025 | -15.1 | 0.0043 | 2 |
| 9/4/2011 | 5808.998 | -17.4 | 0.0025 | 2 |
| 9/5/2011 | 5809.963 | -17.9 | 0.0054 | 6 |
| 9/5/2011 | 5809.995 | -13.4 | 0.0025 | 2 |
| 9/6/2011 | 5810.982 | -12.6 | 0.0048 | 2 |
| 9/7/2011 | 5811.990 | -18.1 | 0.0037 | 2 |
| 9/8/2011 | 5812.983 | -19.6 | 0.0051 | 6 |
| 10/2/2011 | 5836.916 | -4.6 | 0.0049 | 6 |
| 10/12/2011 | 5846.913 | -5.1 | 0.0071 | 6 |
Column information: (1) – Observing date, (2) – Julian date, (3)
– measured heliocentric radial velocity, (4) – r.m.s. error of the
Gaussian fit to the line profile, (5) – source of the spectrum: 1
– ESPaDOnS (CFHT), 2 – FEROS at the 1.52m ESO telescope, 3 –
IAC80 telescope of the Teide Observatory, 4 – C. Buil, 5 – T.
Garrel, 6 – B. Heathcote, and 7 – J. Ribeiro.
| T0 | K1 | Reduced | N | |||
|---|---|---|---|---|---|---|
| days | km s-1 | km s-1 | degrees | |||
| 2451797.91.0 | 23.91.1 | 0.9370.002 | 1.2 | 3.5 | 0.82 | 30 |
| 2455745.90.9 | 23.40.5 | 0.9360.004 | 0.8 | 3.0 | 0.74 | 25 |
| 2455745.91.0 | 23.90.8 | 0.9360.003 | 1.0 | 3.8 | 0.92 | 55 |
-
T0 is the periastron passage epoch, K1 is the semi-amplitude of the radial velocity curve, is the orbit eccentricity, is the systemic radial velocity, is the periastron longitude, N is the number of data points in a set. The first line lists the best fit parameters for the periastron 2000 H line radial velocity data set, the second line shows the same for the 2011 He ii 4686 Å line, and the third line shows the same for the combined data set.
|
|
|
|
|
|
|
 |
 |
 |
 |