Measurements of top-quark properties at the Tevatron
Abstract
Recent measurements of top-quark properties at the Tevatron are presented. CDF uses data corresponding up to to measure the ratio of the branching fractions , the branching fraction for top-quarks decaying into leptons and the cross section for the production of an additional in production. The results from all these measurements agree well with their respective Standard Model expectation. DØ uses of data to measure the cross section as a function of the time. A time dependency would imply Lorentz invariance violation as implemented by the Standard Model extension. No time dependency is observed and DØ sets first limits in the top-quark sector for Lorentz invariance violation. DØ also determines indirectly the top quark width using the results of earlier measurements at DØ. The measured top quark width is in agreement with the SM expectation and does not show any hints for new physics contributions.
1 Introduction
The top quark is the heaviest known elementary particle and was discovered at the Tevatron collider in 1995 by the CDF and DØ collaboration [1, 2] with a mass around . The production is dominated by the annihilation process with 85% as opposed to gluon-gluon fusion which contributes only 15%. The top quark has a very short lifetime, which prevents any hadronization process of the top quark. Instead bare quark properties can be observed by measuring top quark properties.
The measurements presented here are performed using either the dilepton () final state or the lepton+jets (jets) final state. Within the jets final state one of the bosons (stemming from the decay of the quarks) decays leptonically, the other boson decays hadronically. For the dilepton final state both bosons decay leptonically. The branching fraction for top quarks decaying into is almost 100%. Jets originating from a beauty quark (-jets) are identified by means of a neural network (NN) built by the combination of variables describing the properties of secondary vertices and of tracks with large impact parameters relative to the primary vertex.
2 Measurement of the ratio of branching fractions (CDF)
CDF uses all available data corresponding to in the jets decay channel to measure the ratio of the branching fractions [3]. The data is selected by requiring a lepton, missing transverse energy , at least three jets with exactly one or two -jets. Figure 1(a) shows the number of data events with their respective number of background events for different jet and -jet bins. As an example three different templates with different values of are shown: (green dashed histogram), (blue dashed histogram) and (red dashed histogram).
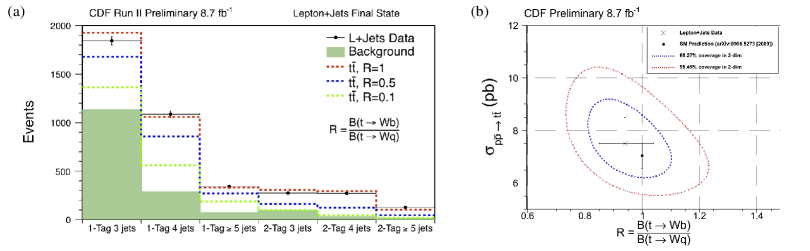
A simultaneous log-likelihood fit to and to the cross section is applied. The resulting log-likelihood is shown in Figure 1b). An inclusive cross section of is measured in good agreement with earlier measurements at the Tevatron. The ratio of the branching fractions is measured to . The presented measurement of agrees with the SM expected value and with measurements from DØ and CMS: an earlier measurement of by DØ results in [4] and the currently most precise measurement from CMS presented at this conference yields [5]. Assuming 3 generations and unitarity of the CKM matrix CDF also measured to , which is in good agreement with the SM expectation.
3 Measurement of the branching fraction to leptons (CDF)
The measurement of the branching fraction for top-quarks decaying into leptons is measured by CDF using of data in the dilepton decay channel [6]. It relies on the precise measurement of the cross section in production, which selects an or originating from the decay or the leptonic decay and thus allows for one hadronic decay (more details can be found in [7]). In addition to the usual kinematic cuts an requirements on identified -jets events are selected by imposing a certain log-likelihood cut enhancing fraction of events. The likelihood combines the following variables: , transverse mass of lepton plus and the transverse energy of the third highest jet. Figure 2(a) shows the log-likelihood distribution before applying any cut.
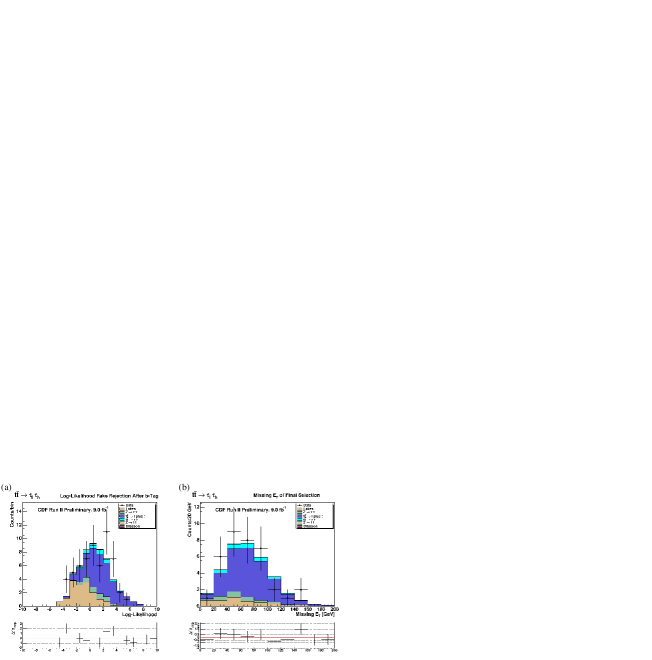
Imposing a minimum log-likelihood value of yields the final event selection with 36 observed events to be compared with the SM expectation of events. Figure 2(b) shows the final event selection after applying the log-likelihood cut of ; data are nicely described by the signal and background contributions. A branching fraction from decays to single and di- events of is measured. A further tightened likelihood cut using additional information from the transverse energy of the lepton and allows for a measurement of the branching fraction using only di- events: . The results from these measurements agree well with the Standard Model expectation of (averaged over , and decay modes.
4 Measurement of the production cross section (CDF)
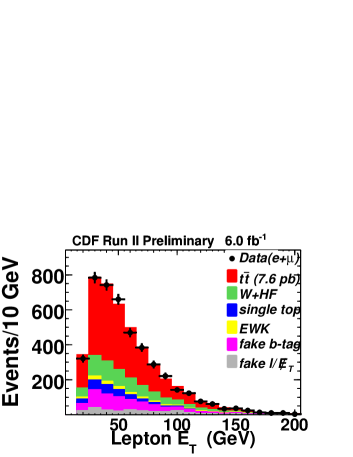
In addition to determining decay branching fractions CDF also measures the cross section for the production of an additional particle in production: [8]. The measurement is based on the jets decay channel and thus events are selected by requiring a lepton, , at least three jets with one identified -jet and a photon. The photon candidate is required to have GeV and no track with GeV and at most one track with GeV, pointing at the calorimeter cluster; and minimal leakage into the hadronic calorimeter. Figure 3 (left) shows that pre-selected data events are well described by all the various background contributions.
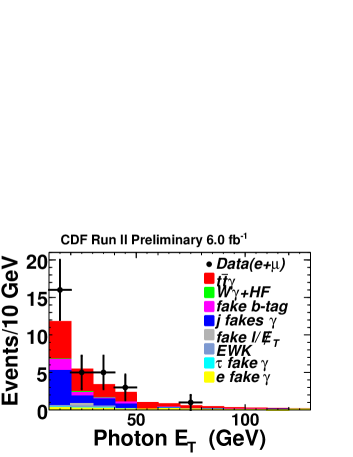
A tight cut on the photon identification suppresses largely the background and the signal contribution (red) is clearly visible in Figure 3 (right). The most dominant remaining background contribution originates from miss-identification of jets as photons. In order to get a handle on this contribution the isolation cuts are not applied and events are used to extrapolate the isolation shape to the used cuts at higher isolation values. Taking into account this fake photon contribution, all the other backgrounds and the signal contribution the expected amount of events is ( and channel combined). The probability of the background alone to mimic the observed signal of 30 events is: 3 standard deviations. The cross section for is measured to , which is a factor of 40 lower than the inclusive cross section! The cross section and its ratio to the cross section of are in good agreement to the SM.
5 Lorentz Invariance Violation (DØ)
DØ searches for a time dependent production cross section employing of data [9]. For the analysis events in the jets final state are selected with a lepton , at least four jets, exactly one jet identified as a -jet and . In addition the analysis relies on the timestamp of the data at production time. The Standard Model Extension (SME) [10] is an effective field theory and implements terms that violate Lorentz and CPT invariance. The modified SME matrix element adds Lorentz invariance violating terms for the production and decay of events to the Standard Model terms. The SME predicts a cross section dependency on siderial time as the orientation of the detector changes with the rotation of the earth relative to the fixed stars. The luminosity-corrected relative event rate () is expected to be flat within the Standard Model, i.e. no time dependency of the production cross section. Figure 4 shows this ratio as a function of the siderial phase, i.e. 1 corresponds to one siderial day.
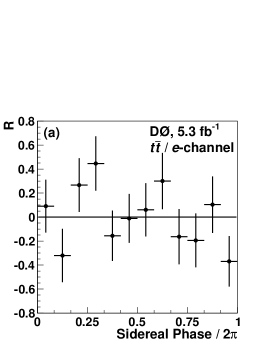
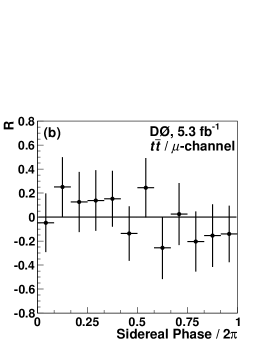
There is no indication of a time dependent production cross section. Instead this measurement sets the first constraints on Lorentz invariance violation in the top quark sector. As the top quark decays before it can hadronize the constraints are also the first ones for a bare quark.
6 Measurement of the top-quark width (DØ)
An indirect determination of the top quark width at DØ [11] is presented using the results of earlier measurements at DØ. The total width is determined from the ratio of the partial decay with under the assumption of the same couplings in production and decay. The partial decay width is derived from the single top -channel cross section measurement of [12] corrected by the ratio of the SM expected values for partial decay width and single top -channel cross section. To obtain the total decay width the derived partial decay width is corrected by the branching fraction mentioned also earlier in this text [4].
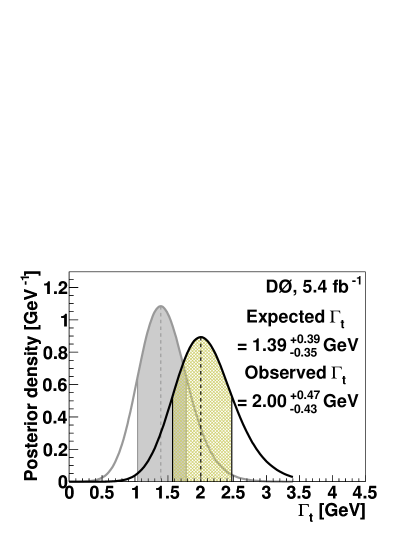
With of data the currently most precise indirect determination of the top quark width results GeV, which corresponds to a lifetime of s. Figure 5 shows the probability density for the expected and measured total width . As the partial decay width is determined using SM predicted values any deviation from the SM expected value of the total decay width would indicate contributions due to new physics. The result does not indicate any hints for new physics contributions.
7 Conclusion
Various recent measurements of top quark properties at the Tevatron are discussed. The presented results are in good agreement with the Standard Model expectations and do not show any hints for new physics. More details and results are given at the DØ and CDF webpage [13]. CDF and DØ continue to provide unique results in the top sector and more top quark measurements using the full data sample are expected to come out soon.
The author thanks the organizers of the TOP 2012 workshop for the invitation and for the hospitality of the conference venue.
References
References
- [1] Abe, F. et al. (CDF), Phys. Rev. Lett. 74, 2626 (1995) [arXiv:hep-ex/9503002].
- [2] Abachi, S. et al. (DØ), Phys. Rev. Lett. 74, 2632 (1995) [arXiv:hep-ex/9503003].
- [3] Aaltonen, T. (CDF), Measurement of the ratio with 8.7 fb-1 of CDF data, Conf. Note 10887, 2012.
- [4] Abazov, V.M. et al. (DØ), Phys. Rev. Lett. 107, 121802 (2011) [arXiv:hep-ex/1106.5436].
- [5] CMS, First measurement of in the dilepton channel in pp collisions at TeV, CMS-PAS-TOP-11-029, 2012.
- [6] Aaltonen, T. (CDF), Measurement of the top pair cross section in dileptonic channels with a hadronic tau and branching ratio, with 9.0 fb-1, Conf. Note 10915, 2012.
- [7] Petrillo, G., Talk at this conference Top pair production cross-section results at Tevatron, 2012.
- [8] Aaltonen, T. (CDF), Phys. Rev. D 84 031104 (2011) [arXiv:hep-ex/1106.3970].
- [9] Abazov, V.M. et al. (DØ), Phys. Rev. Lett. 108, 261603 (2012) [arXiv:1203.6103].
- [10] Colladay, D. and Kostelecky, V.A. Phys. Rev. D 58, 116002 (1998); Kostelecky, V.A., Phys. Rev. D 69, 105009 (2004).
- [11] Abazov, V.M. et al. (DØ), Phys. Rev. D 85, 091104 (2012) [arXiv:1201.4156].
- [12] Abazov, V.M. et al. (DØ), Phys. Rev. D 84, 112001 (2011) [arXiv:1108.3091].
-
[13]
CDF: http://www-cdf.fnal.gov/physics/new/top/top.html;
DØ: http://www-d0.fnal.gov/Run2Physics/top/top_public_web_pages/top_public.html