A WISE view of novae
Abstract
We present the result of trawling through the WISE archive for data on classical and recurrent novae. The data show a variety of spectral energy distributions, including stellar photospheres, dust and probable line emission. During the mission WISE also detected some novae which erupted subsequent to the survey, providing information about the progenitor sytems.
1 Introduction
The Wide-Field Infrared Survey Explorer (WISE) was an all-sky mid-infrared mission (Wright et al. 2010), that operated in wavebands having effective wavelengths and 22m. It commenced its survey on 2010 January 14, completed its all-sky survey on 2010 July 17, and the mission terminated on 2011 February 1. In the course of its survey, WISE detected a number of classical and recurrent novae and we have trawled through the WISE archive for Galactic novae.
Classical novae are well-known to go through a nebular (and in some cases, coronal) phase when emission lines dominate the spectrum. Many of these lines, which are known to be strong in mature novae (see Gehrz et al. 2008; Evans & Gehrz 2012; Helton et al. 2012; Gehrz et al. 2013, and references therein), fall in the WISE bandpasses; for example, neon lines – which are strongest in novae that originate on ONe white dwarfs – affect WISE Bands 1, 3 and 4. As discussed by Martin (1989), infrared fine-structure lines can remain strong for many decades after the nova outburst.
Also, as discussed by Gehrz et al. (2013) and Helton et al. (2013), % of novae (and generally those that arise on CO white dwarfs) are dust formers. The mineralogy of the dust is varied, with carbon, silicates and hydrocarbon commonly seen. The dust temperature late in the evolution is typically several 100s of K, placing its emission in the WISE filters.
We have data-mined the WISE archive for classical and recurrent novae, including mature and recent novae, and novae that have erupted since the WISE mission. We present here the preliminary results of this trawl, and we concentrate on a selection of objects with detections in all four WISE bands.
2 Results
2.1 Recurrent novae with giant secondaries
In Fig. 1 we show the WISE spectral energy distributions (SED) of T CrB and RS Oph, two recurrent novae with giant secondaries; we have fitted the data with black body curves having temperatures corresponding to the spectral types of the secondaries. In the case of T CrB, the WISE data are consistent with the Rayleigh-Jeans tail of the secondary, with no evidence for excess emission. However in the case of RS Oph there is clearly an excess in WISE bands 3 and 4, which we attribute to the dust known to be present in the system (Evans et al. 2007; Rushton et al. 2010, 2013). During its recurrent nova eruptions (see Evans et al. 2008, and references therein) there is evidence that the ejected material interacts strongly with the giant secondary wind and the binary environment (Mohamed et al. 2013). There seems to be little evidence for circumstellar material in the environment of T CrB and it will be interesting to see (when its long-awaited eruption occurs!) the extent to which the sequence of events that occurred during the eruption of RS Oph is replicated in T CrB.


2.2 Classical novae with evidence for line emission


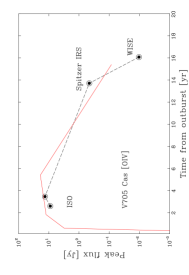
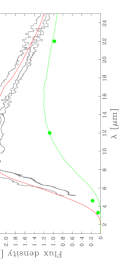
In Fig. 2 we show the WISE SEDs of V705 Cas (1993) and V382 Vel (1999). The former was a dust-forming nova, the eruption occurring on the surface of a CO white dwarf. There is clearly a large excess in WISE Band 4 in the SED of V705 Cas, which is very likely due to emission by the [O iv] fine-structure line at 25.89m and which is ubiquitous in mature novae. This line was present in V705 Cas in 1996, when it was observed with the Infrared Space Observatory (Salama et al. 1999), although it was weak when it was observed by the Spitzer Space Telescope (Werner et al. 2004; Gehrz et al. 2007); the Spitzer IRS spectrum in the region of the [O iv] line is shown in Fig. 2.
Also shown in Fig. 2 is the decline in the peak flux in the [O iv] line in V705 Cas over the period 1996 (Infrared Space Observatory) – 2007 (WISE). In a comprehensive study of the evolution of the line emission of DQ Her (1934), Martin (1989) estimated the evolution of the strengths of a number of recombination and fine-structure lines for years after eruption. With the caveat that this analysis was for the specific case of DQ Her, its stellar remnant and ejecta abundances, the predicted evolution of the [O iv] fins structure line is in surprisingly good (qualitative) agreement with the evolution of the [O iv] line in V705 Cas.
V382 Vel, on the other hand, was an ONe nova (Woodward et al. 1999) which displayed strong neon lines (Woodward et al. 1999; Shore et al. 2003; Helton et al. 2012). The WISE SED for this object shows a strong excess in Bands 3 and 4. The WISE data are superficially consistent with the presence of strong fine-structure and coronal lines, specifically [Ne ii] 12.8m, [Ne v] 14.3m and [Ne iii] 15.55m in Band 3, and [Ne v] 24.32m, [O iv] 25.89m in Band 4; all these lines were present in Spitzer spectra of V382 Vel (Helton et al. 2012). Further modelling is necessary to verify this and this is in progress.
2.3 Classical novae with evidence for dust emission
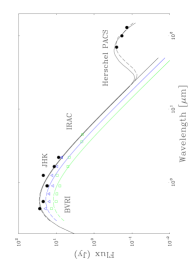
In Fig. 3 we show the WISE SEDs of DZ Cru (2003) and V1280 Sco (2007), both of which were prolific dust-producers, and both of which were observed by Spitzer. Fig. 3 includes the Spitzer data for DZ Cru from Evans et al. (2010); these data were fitted with DUSTY (Ivezić & Elitzur 1997) using amorphous carbon at K. The WISE data show that the dust emission is shifting to longer wavelengths and declining in flux as the dust disperses.

We have attempted to fit the WISE data for DZ Cru with DUSTY. A constraint is that the inner radius of the dust shell when DZ Cru was observed by WISE (day 2351) might be expected to be related to that in 2007 (day 874) when DZ Cru was observed by Spitzer, for example by the assumption of uniform outflow; the resulting dust temperature is K, although the fit is not entirely satisfactory (see Fig. 3).
2.4 Post-WISE novae


In Fig. 4 we show the WISE SEDs of the recurrent T Pyx and Nova Sgr 2012b.
The SED of T Pyx during the 2011 eruption is shown in Fig. 4 (top right). Data from the Herschel Space Observatory (Pilbratt et al. 2010) show excess emission longward of 50m, which Evans et al. (2012) attributed to interstellar dust that had been swept up by a wind (either permanent, from the binary, or from nova eruptions) from the T Pyx binary. The WISE data for T Pyx suggest an excess at 22m. Further work is needed to establish whether the same material is responsible for the excess pre- and post-WISE.
The WISE SED of Nova Sgr 2012b is also shown in Fig. 4, in which the WISE data have been supplemented by data from 2MASS, MSX and IRAS; we see strong emission which peaks at m. This is consistent with optical spectroscopy of this nova, which reveals a symbiotic-like system (F. M. Walter, private communication).
3 Conclusions
While the WISE survey does not have the broad wavelength coverage of the IRAS survey it has vastly superior sensitivity and spatial resolution. It will surely be as valuable a resource for investigating the circumstellar environment of novae as was IRAS some 30 years ago (e.g. Harrison & Gehrz 1990). Moreover it has the potential to provide unprecedented information about nova progenitors.
Full details of this work will be published elsewhere.
Acknowledgments
RDG was supported by NASA and the US Air Force. CEW acknowledges support from NASA. We thank Alex d’Angelo for undertaking a preliminary trawl through the WISE data.
References
- Chesneau et al. (2012) Chesneau, O., et al., 2012, A&A, 545, 63
- Evans et al. (2007) Evans, A., et al., 2007, ApJ, 671, L157
- Evans et al. (2008) Evans, A., et al., 2008, eds, RS Ophiuchi (2006) and the Recurrent Nova Phenomenon, ASP Conference series, vol.401
- Evans et al. (2010) Evans, A., et al., 2010, MNRAS, 406, L85
- Evans et al. (2012) Evans, A., et al., 2012, MNRAS, 424, L69
- Evans & Gehrz (2012) Evans, A., Gehrz, R. D., 2012, Bulletin of the Astronomical Society of India, 40, 213
- Gehrz et al. (2007) Gehrz, R. D., et al., 2007, Rev. Sci. Inst., 78, 011302
- Gehrz et al. (2008) Gehrz, R. D., et al., 2008, ApJ, 672, 1167
- Gehrz et al. (2013) Gehrz, R. D., Evans, A., Woodward, C. E., 2013, these proceedings
- Harrison & Gehrz (1990) Harrison T. E., Gehrz R. D., 1990, AJ, 101, 587
- Helton et al. (2012) Helton, L. A., et al., 2012, ApJ, 755, 37
- Helton et al. (2013) Helton, L. A., et al., 2013, these proceedings
- Ivezić & Elitzur (1997) Ivezić, Ž, Elitzur, M., 1997, MNRAS, 287, 799
- Martin (1989) Martin, P. G., 1989, in Classical Novae, Chapter 7, first edition, eds M. F. Bode & A. Evans, Wiley
- Mohamed et al. (2013) Mohamed, S., et al., 2013, these proceedings
- Pilbratt et al. (2010) Pilbratt, G. L., et al., 2010, A&A, 518, 2
- Rushton et al. (2010) Rushton, M. T., et al., 2010, MNRAS, 401, 99
- Rushton et al. (2013) Rushton, M. T., et al., 2013, these proceedings
- Salama et al. (1999) Salama, A., et al., 1999, MNRAS, 304, L20
- Shore et al. (2003) Shore, S. N., et al., 2003, AJ, 125, 1507
- Werner et al. (2004) Werner, M., et al., 2004, ApJS, 154, 1
- Woodward et al. (1999) Woodward, C. E., et al., 1999, IAUC 7220
- Wright et al. (2010) Wright, E. L., et al., 2010, AJ, 140, 1868