Mid-Infrared Properties of Nearby Luminous Infrared Galaxies I: Spitzer IRS Spectra for the GOALS Sample
Abstract
The Great Observatories All-Sky LIRG Survey (GOALS) is a comprehensive, multiwavelength study of luminous infrared galaxies (LIRGs) in the local universe. Here we present low resolution Spitzer IRS spectra covering 5-38m and provide a basic analysis of the mid-IR spectral properties observed for nearby LIRGs. In a companion paper, we discuss detailed fits to the spectra and compare the LIRGs to other classes of galaxies. The GOALS sample of 244 nuclei in 180 luminous () and 22 ultraluminous () IR galaxies represents a complete subset of the IRAS Revised Bright Galaxy Sample and covers a range of merger stages, morphologies and spectral types. The majority (60%) of the GOALS LIRGs have high 6.2m PAH equivalent widths (EQW 0.4m) and low levels of silicate absorption ( -1.0). There is a general trend among the U/LIRGs for both silicate depth and mid-infrared (MIR) slope to increase with increasing LIR. U/LIRGs in the late to final stages of a merger also have, on average, steeper MIR slopes and higher levels of dust obscuration. Together, these trends suggest that as gas & dust is funneled towards the center of a coalescing merger, the nuclei become more compact and more obscured. As a result, the dust temperature increases leading also to a steeper MIR slope. The sources that depart from these correlations have very low PAH equivalent width (EQW6.2μm 0.1m) consistent with their emission being dominated by an AGN in the MIR. These extremely low PAH equivalent width sources separate into two distinct types: relatively unobscured sources with a very hot dust component (and thus very shallow MIR slopes) and heavily dust obscured nuclei with a steep temperature gradient. The most heavily dust obscured sources are also the most compact in their MIR emission, suggesting that the obscuring (cool) dust is associated with the outer regions of the starburst and not simply a measure of the dust along the line of sight through a large, dusty disk. A marked decline is seen for the fraction of high EQW (star formation dominated) sources as the merger progresses. The decline is accompanied by an increase in the fraction of composite sources while the fraction of sources where an AGN dominates the MIR emission remains low. When compared to the MIR spectra of submillimeter galaxies (SMGs) at z2, both the average GOALS LIRG and ULIRG spectra are more absorbed at 9.7m and the average GOALS LIRG has more PAH emission. However, when the AGN contributions to both the local GOALS LIRGs and the high-z SMGs are removed, the average local starbursting LIRG closely resembles the starburst-dominated SMGs.
1. Introduction
A principal achievement of the Infrared Astronomical Satellite (IRAS) was the discovery of a large population of galaxies whose bolometric luminosities were dominated by emission in the infrared. At the highest luminosities, local ultraluminous infrared galaxies (ULIRGs; LL⊙) have been heavily studied (Armus et al., 2007; Sanders et al., 1988; Murphy et al., 1996; Spoon et al., 2006; Desai et al., 2007; Rigopoulou et al., 1999; Genzel et al., 1998), and a clear formation picture has been pieced together to explain their extreme emission in the infrared: more than 90% of local ULIRGs are the products of major mergers between molecular gas-rich galaxies. The large amounts of gas that are funneled into the centers of these mergers lead to intense star formation, the feeding of a central AGN, extremely compact reservoirs of molecular gas, and infrared luminosities on the order of ten times their optical luminosities.
While ULIRGs constitute only 3% of the IRAS Revised Bright Galaxy Sample (RBGS; Sanders et al., 2003), at just slightly lower luminosities, luminous infrared galaxies (LIRGs; M LM⊙) make up almost 1/3 of the IR sources and have formation histories that are far less straightforward. In the local universe, there is evidence that galaxy-galaxy interactions and mergers drive the large IR luminosities in some LIRGs (Sanders & Mirabel, 1996) and many high-z submillimeter galaxies (SMGs) show hints of disturbed optical and radio morphologies (Blain et al., 2002; Dasyra et al., 2008). However, at least 20% and as many as 40% of local LIRGs may have no history of major tidal interactions (Howell et al., ). LIRGs are also represented across the full range of merger stages, unlike ULIRGs which are almost always at the very end stages of coalescing.
Although LIRGs are relatively rare in the local universe, their comoving number density increases by more than 100 times from the current epoch to z1, (Le Floc’h et al., 2005; Magnelli et al., 2009) until LIRGs dominate the total IR energy density at redshifts of z1-2 when star formation in the universe was at its peak (Caputi et al., 2007). Piecing together the formation mechanisms and subsequent evolution of these LIRG systems is thus vital to understanding the processes governing star formation and black hole accretion, the main sources of emitting power in the IR.
The Great Observatories All-sky LIRG Survey (GOALS; Armus et al., 2009) represents a complete subset of the RBGS comprising 180 LIRGs and 22 ULIRGs and aims to provide a multiwavelength understanding of the formation and evolution of local LIRGs as a class of galaxy. As part of the Spitzer Legacy survey, a complete set of IR imaging (Infrared Array Camera (IRAC) at 3.6, 4.5, 5, and 8m, and Multiband Imaging Photometer (MIPS) at 24, 70, and 160m) and IR spectroscopy at both high and low resolution (Infrared Spectrograph (IRS) from 5-38m) is available for the entire sample. In addition, imaging in the near-IR/optical (Hubble Space Telescope NICMOS and ACS; Haan et al., 2011, Kim et al., ), the UV (Galaxy Evolution Explorer near- and far-UV; Howell et al., 2010), and the X-Ray (Chandra; Iwasawa et al., 2011) are available for large subsets of the sample.
In this paper, we present the mid-infrared (MIR) spectra for 244 galaxy nuclei in the 202 nearby GOALS U/LIRG systems taken with the low resolution module on the Spitzer Infrared Spectrograph (IRS; Houck et al., 2004). The MIR properties derived directly from such a large, complete sample of LIRG spectra will allow us to place these intermediate-luminosity systems into the context of both the extensive previous local ULIRG studies as well as those for lower luminosity, star-forming or starbursting systems (Brandl et al., 2006; Smith et al., 2007b; O’Dowd et al., 2009; Wu et al., 2010).
Full spectral decompositions, including fits to the gas and dust features as well as the SEDs covered by the IRS data, for the entire sample along with the comparison of MIR galaxy properties to those at other wavelengths will be presented in Stierwalt et al. (2013b). The analysis presented here focuses on properties derived directly from the MIR spectra. In Section 2, we present the low resolution MIR spectra observed with the Spitzer IRS Short-Low and Long-Low modules and describe our data reduction methods. In Section 3 we give the distributions of the MIR properties and investigate correlations with LIR and compactness. In Section 4, we follow each MIR property through the merging process, and we place our results into a high redshift context through comparisons to MIR spectra of submillimeter galaxies at z2 in Section 5. Finally, our summary and conclusions are presented in Section 6.
2. Observations & Data Reduction
2.1. The Sample
The GOALS sample consists of 244 galaxy nuclei in 180 luminous and 22 ultraluminous nearby IR galaxies. New spectra were obtained using the staring mode for the IRS Short-Low (SL: 5.5-14.5m) and Long-Low (LL: 14-38m) modules for 157 galaxies (PID 30323; PI L. Armus). Integration times were determined from nuclear flux densities measured from IRAC and MIPS images and range from 45-120 seconds in SL and 30-120 seconds in LL. Secondary nuclei were targeted when the MIPS 24m flux ratio of primary to secondary was 5. Archival spectroscopic observations were used for the remaining 45 systems and borrowed most heavily from staring program PIDs 105, 3247, & 20549 and mapping program PIDs 73, 3269, & 30577.
All 202 systems are nearby but cover a range of distances (15 Mpc D 400 Mpc) and so the resulting projected IRS slit size varies from source to source. At the median galaxy distance of 100 Mpc, the nuclear spectrum covers the central 1.8 kpc in SL and the central 5.2 kpc in LL.
2.2. Data Reduction
Staring mode spectroscopic data were reduced using the S17 and S18.7 IRS pipelines from the Spitzer Science Center111http://ssc.spitzer.caltech.edu/irs/features.html. For most sources, off-source nods were used to perform background sky subtraction. In the cases of more extended objects, dedicated background pointings were used to determine the sky surface brightness. One dimensional spectra were extracted using the standard extraction aperture and point source calibration modes in SPICE222http://ssc.spitzer.caltech.edu/postbcd/doc/spice.pdf which employs a tapered extraction aperture that averages roughly to a size of 106 in LL and in SL. After masking bad pixels, multiple nods were averaged to produce the final spectrum.
Of the archival data, 27 spectra were taken in staring mode and were reduced as described above. For the remaining 18 systems, spectra were extracted from low resolution mapping mode data using CUBISM (Smith et al., 2007a). Two-dimensional BCDs were assembled, obvious bad pixels were removed and nuclear spectra were extracted. In two cases (CGCG011-076 and IC1623B), smaller apertures were necessary to avoid other sources in the Long-Low maps, but for most sources 25 pixel extraction apertures centered on the galaxy’s nucleus were used to resemble as closely as possible the results that would have been achieved with staring mode observations. However, since the tapered aperture used by SPICE cannot be completely reproduced by the square apertures in CUBISM, a further mapping-to-staring-mode correction was applied to all spectra derived from low resolution archival maps. The correction, a multiplicative factor that is a function of wavelength, was derived from NGC6240, a star-forming merger remnant typical of the GOALS sample for which both staring and mapping data were obtained. The correction function varies from 1.3 to 2.7 over SL wavelengths and from 1.7 to 2.3 over LL wavelengths.
The IRAC 8m (Channel 4) images for six example GOALS galaxy nuclei are shown in Figure 1 with the SL and LL extraction aperture projections overlaid (in the case of staring mode data) or with the CUBISM extraction windows overlaid (in the case of mapping mode data). The low resolution IRS spectrum for each source is also presented along with each MIR image. Spectra for the remainder of the galaxy nuclei, ordered by right ascension, are available as online material and can also be found at http://goals.ipac.caltech.edu/. For five galaxies (IIIZw035, IRASF03359+1523, MCG+08-18-013, IRASF17132+5313, and MCG-01-60-022), the archival SL staring mode observations were not centered on the galaxy nucleus, so the SL slit overlays are not shown and the extracted spectra were not used in our analysis. Complete IRS observations were not available for an additional 6 galaxies (no LL spectra: NGC2388, NGC4922, and VV705; no SL spectra: IRASF08339+6517; no IRS data: ESO550-IG025 and IC4518). One galaxy (NGC1068; Howell et al., 2007) saturates the spectrograph and so is also not shown.
![[Uncaptioned image]](/html/1302.4477/assets/x1.png)
![[Uncaptioned image]](/html/1302.4477/assets/x2.png)
![[Uncaptioned image]](/html/1302.4477/assets/x3.png)
![[Uncaptioned image]](/html/1302.4477/assets/x4.png)
![[Uncaptioned image]](/html/1302.4477/assets/x5.png)
![[Uncaptioned image]](/html/1302.4477/assets/x6.png)
![[Uncaptioned image]](/html/1302.4477/assets/x7.png)
![[Uncaptioned image]](/html/1302.4477/assets/x8.png)
![[Uncaptioned image]](/html/1302.4477/assets/x9.png)
![[Uncaptioned image]](/html/1302.4477/assets/x10.png)
![[Uncaptioned image]](/html/1302.4477/assets/x11.png)
![[Uncaptioned image]](/html/1302.4477/assets/x12.png)
![[Uncaptioned image]](/html/1302.4477/assets/x13.png)
![[Uncaptioned image]](/html/1302.4477/assets/x14.png)
![[Uncaptioned image]](/html/1302.4477/assets/x15.png)
![[Uncaptioned image]](/html/1302.4477/assets/x16.png)
![[Uncaptioned image]](/html/1302.4477/assets/x17.png)
![[Uncaptioned image]](/html/1302.4477/assets/x18.png)
![[Uncaptioned image]](/html/1302.4477/assets/x19.png)
![[Uncaptioned image]](/html/1302.4477/assets/x20.png)
2.3. Scale Factors
For each spectrum a break occurs between the SL and LL modules near 14m due to the larger LL slit, which covers nine times the area covered by the SL slit. The scale factors required to match the SL flux to the LL flux are not applied to the spectra in Figures 1 and A1 but are calculated from the overlap in the SL1 and LL2 modules and presented in Table 1. Scale factors are not given for any source missing either SL or LL data. For a small minority of cases (CGCG448-020, ESO077-IG014, ESO173-G015, ESO255-IG007, ESO343-IG013, ESO440-IG058 (northern nuclei only), IRAS03582+6012, IRASF06076-2139, NGC5653, NGC6090, NGC3690 (western nuclei only), and NGC5256), the scale factor is not given because the placement of the LL slit covered multiple nuclei while the smaller SL slit covered only one.
The median scale factors are 1.22 and 1.70 for the staring and mapping mode data respectively. The larger median scale factor for mapping data most likely reflects a selection bias toward mapping more extended sources. Twelve scale factors are 1 (i.e. more flux is recovered from SL than from LL), but for all twelve, the scale factors are also 0.9 and thus represent normal statistical scatter for sources with scale factors near unity. No clear correlation is observed between the scale factors and galaxy distance, but at distances 300 Mpc, a cutoff that includes 6 sources, the scale factors are all 1.2. Similarly, at distances closer than 30 Mpc, there are three GOALS sources that all have scale factors 1.6.
The scale factors are applied as a uniform multiplicative factor across the entirety of the SL spectra and thus boost equally the PAH fluxes, the continuum, and the absorption features. Since calculations of the equivalent width of the 6.2m PAH and the depth of the silicate feature at 9.7m (EQW6.2μm and ; see next section) both use measurements of feature flux relative to the continuum, neither are affected by the scaling of the SL spectrum at these low redshifts. The MIR slopes (Fν[30m]/Fν[15m]) are also unaffected as they only rely on data from the (unscaled) LL portion of the spectrum.
2.4. , MIR Slope, & EQW6.2μm
Silicate depths at 9.7m () were measured directly from the MIR spectra via: where is the measured flux at the central wavelength of the absorption feature and is where the level of the continuum flux would be in the absence of the absorption feature, based on an extrapolation to the surrounding continuum. Thus, a positive value, , suggests emission at that wavelength and the deeper the absorption, the lower the s9.7μm value.
The fluxes Fν at 15m and at 30m were determined from the average of eight data points surrounding each wavelength and were then used to calculate the MIR slope. The wavelength regions used fell within 14.7-15.4m for Fν[15m] and 29.5-30.8m for Fν[30m].
Equivalent widths for the 6.2m PAH feature (EQW6.2μm) were measured for each spectrum using the method outlined in Brandl et al. (2006). Briefly, a spline fit was used to estimate the continuum surrounding the 6.2m PAH feature, and the continuum fit was subtracted from the spectrum. In most cases, anchor points in determining the continuum were set at 5.15m 5.31m, 5.8m 5.9m, 6.5m 6.8m, and 7.1m 7.2m, but each spectrum was visually inspected to make sure no features or bad points occurred in these ranges. The PAH flux was then measured using direct integration. The 6.2m feature was selected for the EQW calculation because, of the five brightest PAH features, it is the least affected by silicate absorption at 9.7m and 18.5m, and it is not blended with other PAH features. However, in some cases the 6.2m PAH feature partially overlaps with the absorption feature due to water ice at 6.0m. For those sources found by the spectral fitting to have 0 (see Stierwalt et al. 2013b), the ice absorption was assumed to affect the underlying continuum but not the PAH emission, and the EQW was calculated accordingly. Four galaxies have only upper limits placed on their EQW6.2μm: IRAS05223+1908, MCG-03-34-064, NGC4418, and IRAS08572+3015.
2.5. Merger Stages
Merger stages for the entire sample were determined via visual inspection of the IRAC 3.6m (Channel 1) images. Each galaxy was assigned one of the following five designations: ‘N’ for nonmergers (no sign of merger activity or massive neighbors), ‘a’ for pre-mergers (galaxy pairs prior to a first encounter), ‘b’ for early-stage mergers (post-first encounter with galaxy disks still symmetric and in tact but with signs of tidal tails), ‘c’ for mid-stage mergers (showing amorphous disks, tidal tails, and other signs of merger activity), or ‘d’ for late-stage mergers (two nuclei in a common envelope). Given the resolution of the IRAC images (2′′), late stage mergers can be easily mistaken for nonmergers in the 3.6-m images. To alleviate this problem, any galaxies classified as nonmergers or early stage mergers in the IRAC images with available higher resolution imaging in the literature that clearly showed signs of a late stage major merger were changed accordingly. We also use the literature to identify spectroscopic pairs which resulted in reclassifying some nonmergers as pre-mergers.
For a subset of 78 GOALS galaxies (all with log(LIR/L⊙) 11.4), we have additional merger classifications based on available HST B, I, and H-band images. The higher resolution of this imaging enables a more detailed classification system with more finely tuned merger stage designations (stages 0 through 6). These merger stages were already described and presented in Haan et al. (2011), but we reproduce and discuss them here to aid with cross-referencing the two classification schemes.
3. Mid-Infrared Properties of Nearby LIRGs
3.1. LIRG vs ULIRG Distributions
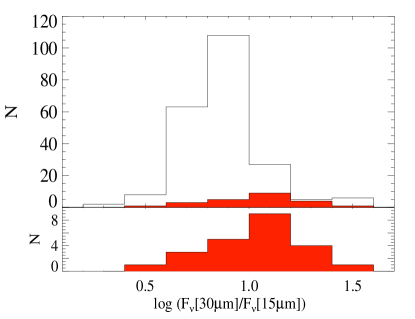
Silicate depths, MIR slopes, PAH equivalent widths, and all associated uncertainties for the GOALS sample, in addition to the SL-to-LL scale factors and merger stages, are presented in Table 1, and the distributions of EQW6.2μm,, and MIR slope are shown in Figure 2. The EQW6.2μm and parameters are not given for the five sources with off-centered SL spectra, and MIR slopes are not presented for the four sources without available either SL or LL spectra or for the 12 sources for which multiple nuclei are observed within the LL slit.
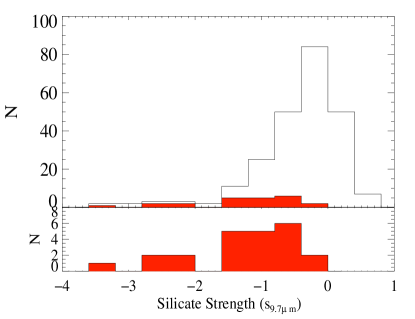
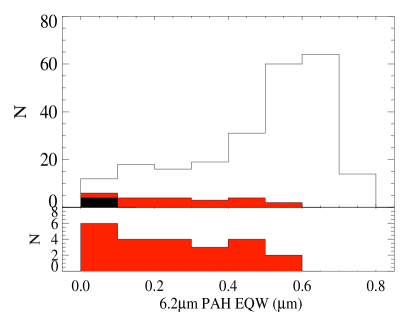
As shown in Figure 2, the majority of LIRGs (63%) are dominated by PAH emission (EQW0.4m), show little to no silicate absorption ( -1), and have MIR slopes of 4 Fν[30m]/Fν[15m] 10. Only six LIRGs have deep silicate absorption with -1.75 (NGC4418, IRAS03582+6012_E, ESO203-IG001, IRASF10038-3338, IRASF12224-0624, and ESO60-IG016). The remainder of the LIRGs show weak to no silicate absorption with a significant fraction (23%) of LIRGs showing silicates in emission at 9.7m, including 11% with 0.15. A few of the LIRGs with 0 are likely AGN-dominated (EQW6.2μm 0.27m) and thus any absorption at 9.7m is filled in by an excess of hot dust. However, most are lower luminosity galaxies with 90% having log(LIR/L⊙) 11.25. These LIRGs are likely analagous to the unobscured starburst NGC 7714, a galaxy whose IR emission is fueled almost entirely by star formation (Marshall et al., 2007). The silicate strengths in the LIRGs have a median of = -0.25 0.58 and range from the heavily obscured NGC4418 at = -3.51 0.09 to NGC5395, the southern component of the LIRG system Arp84, which shows silicates in emission ( = 0.52 0.07). Five LIRGs are continuum dominated and show at most only weak PAH or line features (EQW 0.04m and -0.2; MCG-03-34-064, IRAS05223+1908, NGC1275, NGC7674, and AM0702-601_N).
While the majority of LIRGs favor the high end of the distribution in both EQW6.2μm and , they are found clustered in an intermediate range of MIR slopes with a median of Fν[30m]/Fν[15m] = 7.114.74. The MIR slopes measured for the LIRGs range from Fν[30m]/Fν[15m] = 2.00 0.01 in IRAS05223+1908 which shows a near power-law spectrum in the MIR to Fν[30m]/Fν[15m] = 35.40 1.38 in IRAS10173+0828.
For those LIRGs with measurable 6.2m PAH EQWs, the values range from EQW6.2μm = 0.005m 0.003m for the northeastern component of the LIRG pair IRAS03582+6012 to EQW6.2μm = 0.78m 0.01m for the most southeastern of the three galaxies composing the LIRG system IRAS17578-0400. The distribution for all of the GOALS LIRGs has a median of EQW6.2μm = 0.55m 0.18m. The same median value was found for a sample of lower luminosity starbursting galaxies (Brandl et al., 2006). Tight limits are placed on the EQW for the three LIRGs and one ULIRG without a 6.2m PAH detection: IRAS05223+1908 at 0.043m, MCG-03-34-064 at 0.044m, NGC4418 at 0.066m, and IRAS08572+3915 at 0.081m.
The GOALS ULIRGs, represented by the solid red histograms in Figure 2, show a clear offset from the LIRGs in their distributions for all three fundamental properties. The ULIRGs have a higher median flux density ratio (Fν[30m]/Fν[15m] = 12.545.41), a lower median PAH equivalent width (EQW6.2μm = 0.30m0.17m), and deeper median silicate absorption ( = -1.05 0.85). The GOALS ULIRGs span nearly the full range of MIR slopes covered by LIRGs but are not found with EQW0.52m or with -0.15. Comparing the derived values for the 22 ULIRGs in GOALS with the larger samples from Spoon et al. (2007) (104 ULIRGs) and Veilleux et al. (2009) (QUEST; 50 ULIRGs), we find that the larger numbers of ULIRGs in these samples result in a larger spread in MIR properties (i.e. 6.2m PAH EQWs up to 0.8m and silicate depths up to 0.2; Spoon et al. (2007)). However, the median values are consistent with ULIRGs having lower EQW6.2μm, deeper , and steeper MIR slope than LIRGs: median EQW6.2μm = 0.15m & = -1.47 (Spoon et al., 2007) and median Fν[30m]/Fν[15m] = 11.6 (Veilleux et al., 2009).
The results of a Kolmogorov-Smirnov (KS) test give probabilities of 0.01% that the chance deviations between the distributions of EQW6.2μm, , and MIR slope for GOALS LIRGs vs ULIRGs are expected to be larger assuming they are derived from the same parent sample. In other words, the two samples are significantly different. These probabilities decrease by several orders of magnitude when the QUEST and Spoon et al. (2007) ULIRGs are included. When the GOALS ULIRGs are compared to the larger ULIRG samples, the KS test suggests the chance deviations in their distributions in MIR slope, EQW6.2μm, and are expected to be larger with probabilities of 80%, 40%, and 30%, i.e. it is likely the GOALS ULIRGs and the Spoon et al. (2007) & Veilleux et al. (2009) samples are derived from the same parent sample.
3.2. Correlations with LIR
Figure 3 shows the distributions of , MIR slope, and EQW6.2μm as a function of IR luminosity, LIR. The IR luminosities for all 202 U/LIRG systems were presented in Armus et al. (2009) and derived using the definitions of Sanders & Mirabel (1996)333 and . In cases of multiple nuclei, the total LIR for the system is divided according to the ratio of the fluxes at 70m for each nuclei. In a small number of cases, 70m images are not available and so 24m flux ratios are used instead.
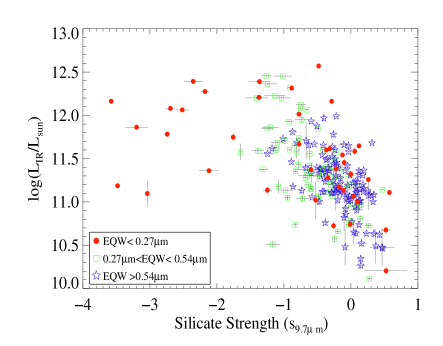
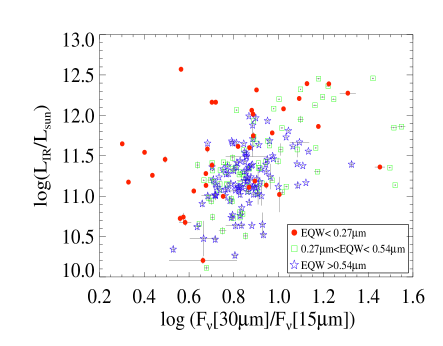
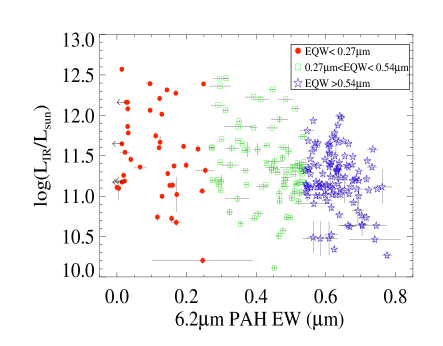
There is a general trend among the U/LIRGs for both silicate depth and MIR slope to increase with increasing LIR. The sources that depart from these correlations at deep levels of silicate obscuration (top panel) or shallow MIR slopes (middle panel) have, in both cases, very low PAH equivalent width (EQW6.2μm 0.27m) and are thus likely dominated by emission from an AGN. Increasingly luminous systems become increasingly dust obscured until a turnover occurs at -1.5, above which the buried AGN candidates show no further correlation between and LIR. As LIR decreases, the MIR slopes flatten until Fν[30m]/Fν[15m] 0.5, below which the relatively unobscured AGN have high LIR given their slopes. ULIRGs have an average EQW6.2μm that is lower than that for LIRGs, but sources with a large range of luminosities are found at each equivalent width (lower panel) so there is not a tight correlation between LIR and EQW6.2μm.
3.3. Disentangling , MIR Slope, & EQW6.2μm
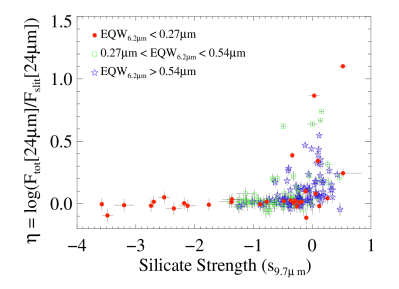
To further disentangle the relationship between the 3 main MIR parameters, we examine the and EQW6.2μm versus MIR slope parameter spaces in Figure 4. The distribution of with MIR slope is color-coded by EQW6.2μm (panel ) while the distribution of EQW6.2μm with MIR slope is color-coded by (panel ).
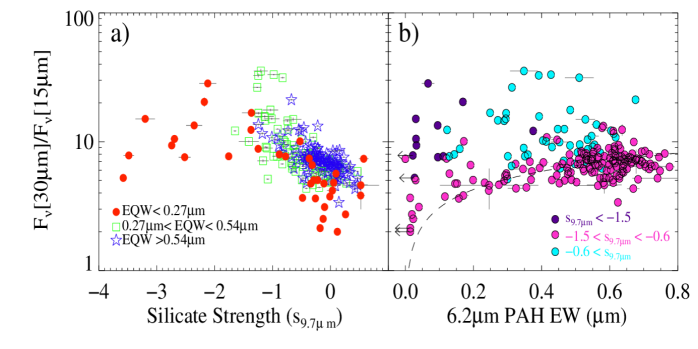
In the majority of LIRGs, star formation dominates the intense MIR emission and the similar conditions in the photodissociation regions resulting in this (PAH-dominated) emission lead to similar MIR properties among the bulk of the GOALS sample. In Figure 4a, the majority of GOALS galaxies, those with EQW6.2μm 0.27m (green squares and blue stars), show a rough correlation between increasing MIR slope and increasing silicate depth (lower ). The starburst galaxies of Brandl et al. (2006) which span mostly luminosities below 1011L⊙ exhibit a similar relationship between and Fν[30m]/Fν[15m] with the same slope. The trend in Figure 4a suggests that the average dust temperature rises as a consequence of the nuclei becoming more obscured and compact. As the dust temperature increases, the rising portion of the blackbody emission spectrum shifts to shorter wavelengths, and warmer sources have increasingly more flux at 30m as seen for the GOALS U/LIRGs with -1.5.
Most of the sources with low PAH equivalent width, however, do not follow these simple trends in MIR properties. In Figure 4a, these low-EQW sources (red circles) are split roughly into two populations: those that are relatively unobscured with shallow MIR slopes and those heavily obscured sources (-1.5) with steep MIR slopes. A similar split is observed in Figure 4b: for EQW6.2μm 0.27m, the heavily obscured sources (purple circles) are found at steeper MIR slopes while the relatively unobscured sources (magenta circles) are found at the shallowest flux density ratios.
An increasingly significant hot dust component from an AGN leads both to a decrease in EQW6.2μm and to a flatter MIR slope. For the GOALS sources with the strongest, relatively unobscured AGN (-0.6; EQW6.2μm0.05m), an upper limit to the MIR slope can be set at Fν[30m]/Fν[15m]4 from both panels in Figure 4. These galaxies (including IRAS05223+1908 and UGC08058) are represented by the red circles in the lower right corner of panel and the magenta circles in the lower left corner of panel . No other sources are found with flatter MIR slopes. This limit agrees with that observed for the starbursts of Brandl et al. (2006) and for the QUEST ULIRGs of Veilleux et al. (2009). Relatively unobscured AGN can thus be identified based on their low MIR flux density ratio alone.
In the most heavily obscured, low EQW galaxies, however, the MIR continuum slopes are steeper due to the buried, hot source. These galaxies (red circles in the left half of Figure 4a and purple circles in Figure 4b) have steep MIR slopes for the same reason sources with -1.5 in Figure 4a have steep MIR slopes: most of the warm dust emission is hidden behind a large amount of cooler dust. A comparison to the 5 mJy Unbiased Spitzer Extragalactic Survey (5MUSES; Wu et al., 2010) highlights the difference between the low and high sources at low EQW6.2μm. The 5MUSES sample is 24-m selected (indicating the presence of hot dust) but lacks the heavily obscured sources found in GOALS. The distributions for the two samples in Figure 4b are roughly the same (5MUSES is represented by the dashed line although there is significant scatter about this line; see Wu et al. (2010)) - both show the lowest EQW6.2μm sources have the shallowest MIR slopes - except 5MUSES lacks the obscured low EQW6.2μm galaxies (purple circles in Figure 4b).
The apparent strength of the 9.7m silicate feature (i.e. the depth of the absorption feature that does not account for any silicate emission, ) is shown versus EQW6.2μm in Figure 5 for GOALS LIRGs (open circles) and ULIRGs (red triangles). No galaxies are observed with both high equivalent widths large levels of silicate absorption. However, at low equivalent widths, two distinct branches, similar to those seen by Spoon et al. (2007), emerge that clearly distinguish the lower equivalent width (EQW 0.1m) sources with minimal to no silicate absorption ( -0.5) from those dominated by silicate absorption (heavily obscured sources; -1.75). Sources with intermediate levels of silicate absorption are not found at low equivalent widths.
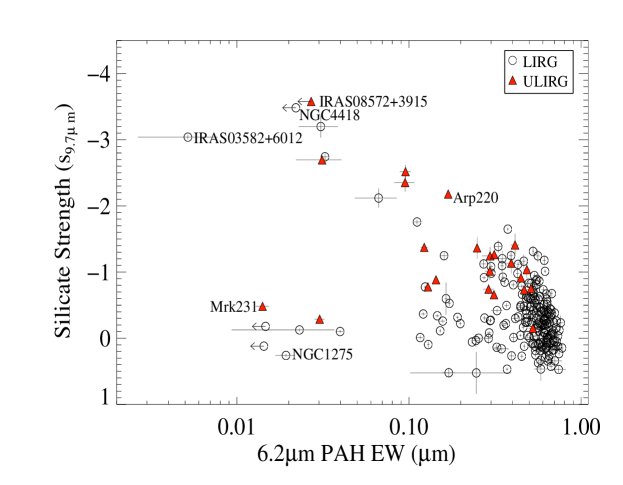
As shown in Figure 5, the highly absorbed sources are not limited to ULIRGs. At values of -1.75, the GOALS sample includes five ULIRGs (labeled in Figure 5) as well as the dense, compact nascent starburst LIRG NGC4418 (Spoon et al., 2001; Roussel et al., 2003; Evans et al., 2006) and five additional LIRGs that span a large range of LIRG luminosities: IRASF12224-0624 (log(LIR/L⊙) = 11.36), IRAS03582+6012 (log(LIR/L⊙) = 11.42), IRASF10038-3338 (log(LIR/L⊙) = 11.78), ESO60-IG016 (log(LIR/L⊙) = 11.82), and ESO203-IG001 (log(LIR/L⊙) = 11.86).
3.4. Compactness
The most heavily obscured nuclei among the GOALS galaxies are also the most compact: they all show little-to-no MIR emission extending outside of the IRS slit. In Figure 6, the silicate strength is plotted against , a parameter that represents the fraction of the emission at 24m intercepted by the IRS slit:
| (1) |
where is the total flux of a source as measured from its MIPS 24m image (Mazzarella et al., ) and is the flux within the IRS slit derived by convolving the MIPS-24m filter with the low resolution IRS spectrum. The most obscured sources ( -1.75) all have 0 (i.e. all of the flux measured by the larger MIPS field of view at 24m is also recovered within the much smaller IRS slit).
Although distance effects could act to disguise an extended component in comparisons of total versus intra-slit fluxes if all of the obscured sources were the most distant, the median distance for the heavily obscured, low nuclei is only 60% larger than the median distance for the less obscured sources (190 Mpc vs 115 Mpc) suggesting distance alone cannot be driving the difference in . Even more importantly, the heavily obscured, low tail of the distribution in Figure 6 includes the two closest, obscured LIRGs, NGC4418 at 36.5 Mpc and -3.51 0.09 and NGC3690 at 50.7 Mpc and -1.65 0.02. Both of these LIRGs would have been easily resolved had they shown any extended MIR emission. Additionally, the existence of galaxies with high and low with distances well above 100 Mpc indicate that extended sources can still be resolved even at larger distances.
The fraction of resolved emission the IRS slit is also much lower for the obscured sources. The fraction of extended emission (FEE13.2μm) is defined by Díaz-Santos et al. (2010) as the fraction of emission within the IRS slit originating outside of the unresolved component (i.e. a point source at that distance). For the most obscured GOALS nuclei, the average FEE 0.07 compared to FEE 0.39 for the remaining (weakly obscured or unobscured) LIRGs. As discussed in detail in Díaz-Santos et al. (2010), such a dramatic difference in FEE between obscured and unobscured nuclei cannot be the result of distance effects alone.
Together the low , the low FEE13.2μm, and their inclusion of nearby sources suggest the nuclei in these heavily obscured sources dominate the 24-m emission from their parent galaxies, and so the most heavily obscured LIRGs and ULIRGs also have the most compact MIR continuum emission. Given their low EQW6.2μm, if extreme levels of obscuration are not simply masking the PAH emission, the higher densities in these nuclei may create an environment where PAH dust grains are not present or the conditions are not appropriate for exciting them (i.e. lacking in photodissociation regions). Alternatively, the low EQW6.2μm may indicate an increase in the continuum flux at 6m due to a rise in dust temperature. None of the low , high nuclei are observed to be [NeV] emitters (Petric et al., 2011), most likely because their large optical depths obscure any line emission that would be present at 14.3m.
4. Tracing MIR Properties through Merger Stage
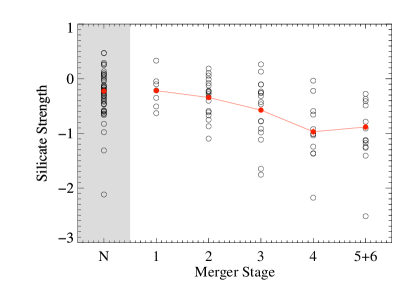
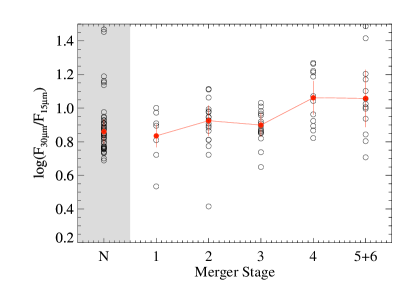
In Figure 7, silicate strength, MIR slope, and PAH equivalent width are traced through merger stage for GOALS galaxies. To look for subtle differences in MIR properties throughout the merging process, we focus on only those sources that have HST classifications (column 11 in Table 1). Since this subset contains only six galaxies with no indication of a merger (stage ), we include all of the nonmergers (Stage ) from the IRAC-based classifications (column 10 in Table 1) to derive a more secure median for each spectral property. Although the HST data samples only LIRGs with log(LIR/L⊙)11.4, the dense sampling of merger stages made possible by the deep, high spatial resolution optical and NIR images provides a much finer look at the spectral changes along the merger sequence. Mean values for each merger stage clipped at 3 are shown in red with their associated standard deviations.
As the mergers progress and gas & dust is funneled towards the center, galaxies become on average more obscured with steeper MIR slopes. Silicate depths of -1 are only reached at merger stages of and later. No LIRG systems in merger stage have Fν[30m]/Fν[15m] 1, while the average MIR slope is 1 for the later stages -. These two results agree with several studies finding higher LIR at later merger stages since, as shown in Figure 3, increasing MIR slope and silicate depth are also linked to higher LIR in LIRGs. As merging galaxies coalesce, the nuclei become more compact and more obscured, and, as a result, the dust temperature increases leading to a steeper MIR slope as discussed in Section 3.
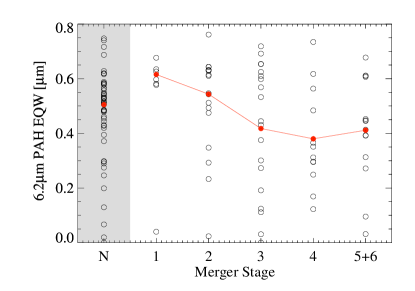
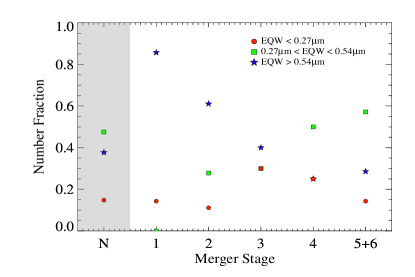
There is some indication that lower PAH equivalent widths are favored at later merger stages but this is mostly dominated by the fact that only starburst-dominated galaxies (EQW6.2μm0.54m) are observed in stage . (The one exception is southern component of the LIRG system AM0702-601.) For all other merger stages, the full range of EQW6.2μm is observed.
A clearer link between PAH equivalent width and merger stage is observed when galaxies are binned by their EQW6.2μm(and thus the likely AGN contribution to the MIR). In Figure 8 the LIRGs are divided into three EQW6.2μm bins indicating AGN dominated sources (red circles), composite sources (green squares), and starbursts (blue stars). Starbursts clearly play a dominant role at early merger stages as was also shown by Petric et al. (2011) and Haan et al. (2011), but the decline in the starburst contribution is not balanced by an increase in AGN-dominated sources. The contribution from LIRGs with an AGN dominating in the MIR stays at a roughly constant fraction throughout the merger process, but sources (i.e. the weaker AGN that are not yet entirely dominant over star formation in the MIR) show a marked increase at later merger stages. This may indicate that the timescales for the AGN to begin to dominate the MIR emission are longer than the merger timescale (a few hundred million years). In both Figures 7 and 8, the nonmerging LIRGs cover nearly the full range of every MIR property investigated.
5. Comparisons to Submillimeter Galaxies
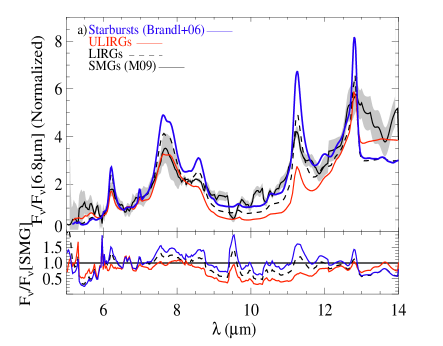
The dust-enshrouded, strongly starbursting nature of LIRGs makes them obvious candidates for possible local analogs to the dusty submillimeter galaxies (SMGs) that make a significant contribution to the global star formation rate density at higher redshifts. In Figure 9, we compare different subsets of the GOALS MIR spectra with the average SMG spectra from Menéndez-Delmestre et al. (2009) (hereafter M09) derived from a sample of 24 SMGs at redshifts of 0.65 z 3.2. All average spectra for both the LIRGs and the SMGs are normalized at 6.8m. In agreement with the conclusions of Desai et al. (2007) and M09, the average local ULIRG spectrum (red line in Figure 9a) is more absorbed than the average SMG spectrum (black line) but has weaker PAH emission. Although GOALS LIRGs are less obscured than ULIRGs on average, the average LIRG spectrum (dashed line) is still more absorbed than the average SMG while also showing stronger PAH emission at 6.2m, 7.7m, and 11.3m. Even when the nuclear emission of galaxies is removed, the spectrum of the extended component of LIRGs does not resemble that of the total SMG composite (Díaz-Santos et al., 2011). The average local starburst (blue line; Brandl et al., 2006) shows a similar level of silicate absorption but much stronger PAH emission compared to the average SMG.
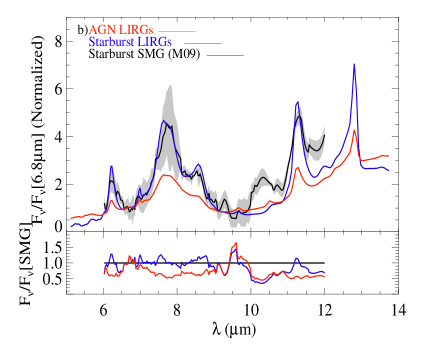
The fraction of MIR emission attributed to AGN overall for the GOALS LIRGs is only 12% (Petric et al., 2011), and M09 observed a contribution of 32% from AGN to the total bolometric luminosity in SMGs. However, as seen in Figures 1 and A1, those sources dominated by AGN have MIR spectra that are vastly different from those with strong PAH emission. The low equivalent width sources (i.e. those with MIR emission that is most likely AGN-dominated) also show a larger scatter in their MIR properties, as discussed in Section 3. To reduce possible confusion caused by this AGN contribution, we also compare the average SMG spectrum for only those SMGs without AGN indicators in the MIR (i.e starburst SMGs with EQW1m & 0.5; M09) to average LIRG spectra with and without an AGN contribution in Figure 9b.
The average AGN-dominated LIRG spectrum (LIRGs with EQW0.27m; red line) clearly does not resemble the average starburst SMG (solid black line). However the average starburst-dominated LIRG spectra (EQW0.54m; blue line) is a better match to the average starburst SMG. All three average spectra agree within 15% below 10m (see the residuals in the lower panel).
Between 10-11m, all three average LIRG spectra in Figure 9b agree closely, but no subset of the GOALS LIRGs or ULIRGs reproduces the emission feature observed in the average starburst SMG spectrum near 10.5m. Although the feature is also not detected in the average (low resolution) local starburst spectrum (see Figure 9a), both the [SIV] emission line at 10.51m and a PAH feature at 10.60m are clearly seen in the average of the high resolution IRS spectra of the same starburst sample (see Figure 4 of Bernard-Salas et al., 2009). The feature detected in the low resolution SMG spectra is likely a blend of these two features (Sturm et al., 2000; Bernard-Salas et al., 2009; Smith et al., 2007b), but may be dominated by the PAH feature emission since it remains faint and unresolved at low resolution. Bernard-Salas et al. (2009) also detect a third feature at 10.75m that they associate with PAH emission due to its close correlation with the 11.3m PAH which may contribute to the emission in the SMGs.
6. Summary & Conclusions
We presented low resolution IRS spectra for 244 galaxy nuclei in the GOALS sample of 180 LIRGs and 22 ULIRGs. The GOALS galaxies cover a range of spectral types, silicate strengths, and merger stages, and represent a complete subset of the IRAS Revised Bright Galaxy Sample. We investigated the MIR properties directly measured from the spectra and discovered the following:
1) Local LIRGs cover a large range of MIR properties and any single LIRG cannot represent the class as a whole. LIRGs span 0.005m EQW0.78m (with nondetections of the 6.2m PAH reaching EQW0.043m), -3.51 0.052 (with 23% of LIRGs showing silicate emission), and 2.00 Fν[30m]/Fν[15m] 35.40. However, the majority (63%) of LIRGs have EQW 0.4, -1.0, and MIR slopes in the range of 4 Fν[30m]/Fν[15m] 10.
2) The GOALS ULIRGs span a narrower range of MIR properties than those covered by the LIRGs. When compared to LIRGs, the ULIRGs (LL⊙) have a steeper median slope (Fν[30m]/Fν[15m] = 12.54 for the ULIRGs compared to Fν[30m]/Fν[15m] = 7.11 for the LIRGs), a lower mean equivalent width (EQW6.2μm = 0.30m versus EQW6.2μm = 0.55m), and deeper average silicate absorption ( = -1.05 versus = -0.25).
3) There is a general trend among the U/LIRGs for both silicate depth and MIR slope to increase with increasing LIR. As LIR increases, the temperature may rise as a consequence of the nuclei becoming more obscured and compact. As the dust temperature increases, the rising portion of the blackbody emission spectrum shifts to shorter wavelengths, and warmer sources have increasingly more flux at 30m, and thus steeper MIR slopes. The sources that depart from these correlations, in both cases, have very low PAH equivalent width (EQW6.2μm 0.1m) consistent with their MIR emission being dominated by an AGN.
4) Although less numerous (only 18% of the sample), LIRGs with the largest contributions from AGN (those with EQW 0.27m) cover a wider range of MIR slopes and silicate strengths than those sources of higher equivalent width that make up the majority of the sample. The sources with extremely low PAH equivalent widths (EQW6.2μm0.1m) separate into two distinct types: relatively unobscured sources with a very hot dust component (and thus very shallow MIR slopes) and heavily dust obscured nuclei with a steep temperature gradient. For the AGN-dominated LIRGs with low apparent obscuration, an upper limit to the MIR slope can be set at Fν[30m]/Fν[15m]4. The most obscured nuclei, however, have steeper MIR slopes due to most of their warm dust emission being hidden behind a large amount of cooler dust.
suggesting 5) The LIRGs most likely harboring buried AGN (the obscured nuclei with -1.75) all have EQW0.2m and lack any extended component to their MIR emission at 24m. Extreme levels of dust obscuration may simply be blocking PAH emission, or the higher densities in these nuclei may create an environment where PAH dust grains are not present or the conditions are not appropriate for exciting them (i.e. lacking in photodissociation regions). Their compact nature suggests that their obscuring (cool) dust is associated with the outer regions of the starburst and not simply a measure of the dust along the line of sight through a large, dusty disk.
6) U/LIRGs in the late to final stages of a merger have, on average, steeper MIR slopes and higher levels of dust obscuration. As merging galaxies coalesce and gas & dust is funneled towards the center, the nuclei become more compact and more obscured. As a result, the dust temperature increases leading also to a steeper MIR slope. A marked decline is seen for the fraction of high EQW (star formation dominated) sources as the merger progresses. The decline is accompanied by an increase in the fraction of composite sources while the fraction of sources where an AGN dominates the MIR emission remains low.
7) Despite their dusty and starbursty nature, the average nearby LIRG spectrum does not resemble the average composite (starburst AGN) MIR spectrum from submillimeter galaxies at z2. Both the average LIRG and ULIRG spectra are more absorbed at 9.7m and the average LIRG has more PAH emission. However, once the AGN contributions are removed from the average LIRG and from the average SMG spectra, the PAH emission and level of silicate absorption of the average spectrum for starburst-dominated SMGs (i.e. those without AGN spectral signatures; Menéndez-Delmestre et al., 2009) are fit well by the average starburst-dominated local LIRG.
The Spitzer Space Telescope is operated by the Jet Propulsion
Laboratory, California Institute of Technology, under NASA contract
1407. This research has made use of the NASA/IPAC Extragalactic
Database (NED) which is operated by the Jet Propulsion Laboratory,
California Institute of Technology, under contract with the National
Aeronautics and Space Administration. This research has made use of
the NASA/IPAC Infrared Science Archive, which is operated by the Jet
Propulsion Laboratory, California Institute of Technology, under
contract with the National Aeronautics Space Administration. We would
like to thank M. Cluver for many helpful discussions and
K. Menéndez-Delmestre for sharing her average SMG spectra.
References
- Armus et al. (2007) Armus, L., Charmandaris, V., Bernard-Salas, J., et al. 2007, ApJ, 656, 148
- Armus et al. (2009) Armus, L., Mazzarella, J. M., Evans, A. S., et al. 2009, PASP, 121, 559
- Bernard-Salas et al. (2009) Bernard-Salas, J., Spoon, H. W. W., Charmandaris, V., et al. 2009, ApJS, 184, 230
- Blain et al. (2002) Blain, A. W., Smail, I., Ivison, R. J., Kneib, J.-P., & Frayer, D. T. 2002, Phys. Rep., 369, 111
- Brandl et al. (2006) Brandl, B. R., Bernard-Salas, J., Spoon, H. W. W., et al. 2006, ApJ, 653, 1129
- Caputi et al. (2007) Caputi, K. I., Lagache, G., Yan, L., et al. 2007, ApJ, 660, 97
- Dasyra et al. (2008) Dasyra, K. M., Yan, L., Helou, G., et al. 2008, ApJ, 680, 232
- Desai et al. (2007) Desai, V., Armus, L., Spoon, H. W. W., et al. 2007, ApJ, 669, 810
- Díaz-Santos et al. (2010) Díaz-Santos, T., Charmandaris, V., Armus, L., et al. 2010, ApJ, 723, 993
- Díaz-Santos et al. (2011) —. 2011, ApJ, 741, 32
- Evans et al. (2006) Evans, A. S., Solomon, P. M., Tacconi, L. J., Vavilkin, T., & Downes, D. 2006, AJ, 132, 2398
- Genzel et al. (1998) Genzel, R., Lutz, D., Sturm, E., et al. 1998, ApJ, 498, 579
- Haan et al. (2011) Haan, S., Surace, J. A., Armus, L., et al. 2011, AJ, 141, 100
- Houck et al. (2004) Houck, J. R., Roellig, T. L., van Cleve, J., et al. 2004, ApJS, 154, 18
- Howell et al. (2007) Howell, J. H., Mazzarella, J. M., Chan, B. H. P., et al. 2007, AJ, 134, 2086
- Howell et al. (2010) Howell, J. H., Armus, L., Mazzarella, J. M., et al. 2010, ApJ, 715, 572
- Iwasawa et al. (2011) Iwasawa, K., Sanders, D. B., Teng, S. H., et al. 2011, A&A, 529, A106
- Le Floc’h et al. (2005) Le Floc’h, E., Papovich, C., Dole, H., et al. 2005, ApJ, 632, 169
- Magnelli et al. (2009) Magnelli, B., Elbaz, D., Chary, R. R., et al. 2009, A&A, 496, 57
- Marshall et al. (2007) Marshall, J. A., Herter, T. L., Armus, L., et al. 2007, ApJ, 670, 129
- Menéndez-Delmestre et al. (2009) Menéndez-Delmestre, K., Blain, A. W., Smail, I., et al. 2009, ApJ, 699, 667
- Murphy et al. (1996) Murphy, Jr., T. W., Armus, L., Matthews, K., et al. 1996, AJ, 111, 1025
- O’Dowd et al. (2009) O’Dowd, M. J., Schiminovich, D., Johnson, B. D., et al. 2009, ApJ, 705, 885
- Petric et al. (2011) Petric, A. O., Armus, L., Howell, J., et al. 2011, ApJ, 730, 28
- Rigopoulou et al. (1999) Rigopoulou, D., Spoon, H. W. W., Genzel, R., et al. 1999, AJ, 118, 2625
- Roussel et al. (2003) Roussel, H., Helou, G., Beck, R., et al. 2003, ApJ, 593, 733
- Sanders et al. (2003) Sanders, D. B., Mazzarella, J. M., Kim, D.-C., Surace, J. A., & Soifer, B. T. 2003, AJ, 126, 1607
- Sanders & Mirabel (1996) Sanders, D. B., & Mirabel, I. F. 1996, ARA&A, 34, 749
- Sanders et al. (1988) Sanders, D. B., Soifer, B. T., Elias, J. H., et al. 1988, ApJ, 325, 74
- Smith et al. (2007a) Smith, J. D. T., Armus, L., Dale, D. A., et al. 2007a, PASP, 119, 1133
- Smith et al. (2007b) Smith, J. D. T., Draine, B. T., Dale, D. A., et al. 2007b, ApJ, 656, 770
- Spoon et al. (2001) Spoon, H. W. W., Keane, J. V., Tielens, A. G. G. M., Lutz, D., & Moorwood, A. F. M. 2001, A&A, 365, L353
- Spoon et al. (2007) Spoon, H. W. W., Marshall, J. A., Houck, J. R., et al. 2007, ApJ, 654, L49
- Spoon et al. (2006) Spoon, H. W. W., Tielens, A. G. G. M., Armus, L., et al. 2006, ApJ, 638, 759
- Stierwalt et al. (2013) Stierwalt, S., et al. 2013b, ApJ, in prep
- Sturm et al. (2000) Sturm, E., Lutz, D., Tran, D., et al. 2000, A&A, 358, 481
- Veilleux et al. (2009) Veilleux, S., Rupke, D. S. N., Kim, D.-C., et al. 2009, ApJS, 182, 628
- Wu et al. (2010) Wu, Y., Helou, G., Armus, L., et al. 2010, ApJ, 723, 895
| Source | Short-Low RA/DEC | (PA) | Long-Low RA/DEC | (PA) | 6.2 EQW() | s9.7μm() | () | Scale | Merger | MS |
|---|---|---|---|---|---|---|---|---|---|---|
| Name | [J2000] | [∘] | [J2000] | [∘] | [] | Factor | Stage | (HST) | ||
| NGC0023 | 00h09m53.4s +25d55m26.3s | (-32.8) | 00h09m53.4s +25d55m26.3s | (-116.6) | 0.58 (0.01) | 0.18 (0.04) | 6.81 (0.04) | 1.49 | b | |
| NGC0034 | 00h11m06.4s -12d06m28.7s | (35.3) | 00h11m06.5s -12d06m29.2s | (117.7) | 0.45 (0.02) | -0.79 (0.03) | 9.94 (0.09) | 1.70 | d | 5 |
| Arp256 | 00h18m50.9s -10d22m36.6s | (-36.1) | 00h18m50.9s -10d22m36.6s | (-119.8) | 0.72 (0.01) | -0.26 (0.03) | 6.73 (0.07) | 1.22 | b | 3 |
| ESO350-IG038 | 00h36m52.5s -33d33m17.1s | (163.1) | 00h36m52.5s -33d33m17.0s | (79.4) | 0.15 (0.004) | -0.34 (0.02) | 4.73 (0.01) | 1.15 | c | |
| NGC0232_W | 00h42m45.8s -23d33m40.7s | (-44.6) | 00h42m45.8s -23d33m40.7s | (-128.3) | 0.55 (0.01) | -0.38 (0.03) | 7.33 (0.03) | 1.21 | b | |
| NGC0232_E | 00h42m52.8s -23d32m27.5s | (-44.6) | 00h42m52.8s -23d32m27.5s | (-128.3) | 0.16 (0.005) | -0.26 (0.03) | 3.63 (0.03) | 1.16 | b | |
| MCG+12-02-001 | 00h54m03.9s +73d05m06.0s | (71.1) | 00h54m03.9s +73d05m05.9s | (-12.7) | 0.65 (0.01) | -0.24 (0.02) | 7.19 (0.04) | 1.08 | c | 3 |
| NGC0317B | 00h57m40.4s +43d47m32.1s | (-29.6) | 00h57m40.4s +43d47m32.1s | (-113.4) | 0.57 (0.01) | -0.86 (0.05) | 8.23 (0.09) | 1.15 | a | |
| IC1623B | 01h07m47.6s -17d30m25.4s | (25.4) | 01h07m47.3s -17d30m28.4s | (19.1) | 0.30 (0.004) | -0.98 (0.02) | 7.71 (0.01) | 1.73 | c | 3 |
| MCG-03-04-014 | 01h10m09.0s -16d51m09.6s | (150.7) | 01h10m08.9s -16d51m10.6s | (-126.8) | 0.67 (0.01) | -0.04 (0.02) | 6.98 (0.09) | 1.16 | N | 0 |
| ESO244-G012 | 01h18m08.3s -44d27m43.5s | (-79.0) | 01h18m08.3s -44d27m43.6s | (-162.7) | 0.66 (0.01) | -0.32 (0.13) | 7.39 (0.06) | 1.19 | b | |
| CGCG436-030 | 01h20m02.6s +14d21m42.7s | (-27.1) | 01h20m02.6s +14d21m42.7s | (-110.9) | 0.35 (0.01) | -1.10 (0.10) | 8.94 (0.09) | 1.10 | b | 2 |
| ESO353-G020 | 01h34m51.2s -36d08m14.5s | (-58.4) | 01h34m51.2s -36d08m14.5s | (-142.1) | 0.54 (0.01) | -0.58 (0.04) | 7.26 (0.10) | 1.42 | N | |
| RR032_N | 01h36m23.4s -37d19m18.0s | (-59.0) | 01h36m23.4s -37d19m18.1s | (-142.7) | 0.52 (0.01) | 0.09 (0.03) | 6.19 (0.10) | 1.28 | a | |
| RR032_S | 01h36m24.1s -37d20m25.9s | (-58.9) | 01h36m24.1s -37d20m25.9s | (-142.7) | 0.70 (0.01) | -0.38 (0.04) | 6.74 (0.09) | 1.14 | a | |
| IRASF01364-1042 | 01h38m52.9s -10d27m11.2s | (149.2) | 01h38m52.8s -10d27m12.0s | (-110.8) | 0.39 (0.01) | -1.27 (0.08) | 32.72 (1.04) | 1.41 | d | 5 |
| IIIZw035 | — | 01h44m30.5s +17d06m08.7s | (-109.1) | — | — | 23.52 (0.24) | — | a | 3 | |
| NGC0695 | 01h51m14.2s +22d34m56.4s | (-23.5) | 01h51m14.3s +22d34m55.4s | (-107.3) | 0.65 (0.01) | 0.31 (0.02) | 6.17 (0.09) | 1.86 | N | |
| UGC01385 | 01h54m53.8s +36d55m04.0s | (-22.0) | 01h54m53.8s +36d55m04.1s | (-105.7) | 0.64 (0.01) | -0.00 (0.11) | 6.73 (0.08) | 1.12 | a | |
| NGC0838_W | 02h09m24.7s -10d08m09.6s | (162.7) | 02h09m24.7s -10d08m09.5s | (78.9) | 0.45 (0.01) | 0.27 (0.03) | 4.76 (0.10) | 1.63 | a | |
| NGC0838_E | 02h09m38.7s -10d08m47.5s | (162.6) | 02h09m38.7s -10d08m47.5s | (78.9) | 0.74 (0.01) | 0.23 (0.03) | 7.59 (0.06) | 2.00 | a | |
| NGC0838_S | 02h09m42.8s -10d11m02.3s | (162.6) | 02h09m42.8s -10d11m02.3s | (78.9) | 0.50 (0.01) | -0.83 (0.03) | 6.72 (0.04) | 1.18 | a | |
| NGC0828 | 02h10m09.5s +39d11m24.6s | (-19.3) | 02h10m09.5s +39d11m24.7s | (-103.0) | 0.61 (0.01) | -0.09 (0.03) | 5.04 (0.05) | 1.64 | d | |
| IC0214 | 02h14m05.5s +05d10m25.4s | (-26.2) | 02h14m05.4s +05d10m25.4s | (-110.0) | 0.64 (0.01) | -0.05 (0.02) | 6.51 (0.10) | 1.34 | d | |
| NGC0877_S | 02h17m53.2s +14d31m18.1s | (-24.5) | 02h17m53.2s +14d31m18.2s | (-108.3) | 0.46 (0.01) | -1.16 (0.10) | 7.11 (0.17) | 1.36 | a | |
| NGC0877_N | 02h17m59.7s +14d32m38.0s | (-24.5) | 02h17m59.6s +14d32m38.0s | (-108.3) | 0.35 (0.03) | 0.16 (0.03) | 6.14 (0.14) | 2.10 | a | |
| MCG+05-06-036_S | 02h23m19.0s +32d11m18.1s | (155.4) | 02h23m19.0s +32d11m18.2s | (71.7) | 0.54 (0.01) | 0.19 (0.03) | 6.12 (0.22) | 1.46 | a | 2 |
| MCG+05-06-036_N | 02h23m22.0s +32d11m48.4s | (155.4) | 02h23m22.0s +32d11m48.5s | (71.7) | 0.48 (0.01) | -0.25 (0.02) | 6.23 (0.07) | 1.29 | a | 2 |
| UGC01845 | 02h24m08.0s +47d58m11.8s | (-31.2) | 02h24m08.0s +47d58m11.9s | (-115.0) | 0.58 (0.01) | -0.40 (0.03) | 7.71 (0.09) | 1.18 | N | |
| NGC0958 | 02h30m42.9s -02d56m20.4s | (-27.6) | 02h30m42.9s -02d56m20.4s | (-111.3) | 0.29 (0.01) | 0.00 (0.08) | 4.96 (0.15) | 1.77 | N |
| Source | Short-Low RA/DEC | (PA) | Long-Low RA/DEC | (PA) | 6.2 EQW() | s9.7μm() | () | Scale | Merger | MS |
|---|---|---|---|---|---|---|---|---|---|---|
| Name | [J2000] | [∘] | [J2000] | [∘] | [] | Factor | Stage | (HST) | ||
| NGC0992 | 02h37m25.5s +21d06m04.4s | (-21.8) | 02h37m25.5s +21d06m04.4s | (-105.5) | 0.72 (0.01) | 0.05 (0.04) | 6.41 (0.09) | 1.28 | c | |
| UGC02238 | 02h46m17.5s +13d05m44.3s | (-24.7) | 02h46m17.5s +13d05m44.9s | (-108.2) | 0.63 (0.01) | -0.37 (0.04) | 5.66 (0.07) | 1.14 | d | |
| IRASF02437+2122 | 02h46m39.1s +21d35m10.1s | (-22.3) | 02h46m39.1s +21d35m10.3s | (-104.0) | 0.16 (0.01) | -1.25 (0.06) | 8.81 (0.16) | 1.06 | c | |
| UGC02369 | 02h54m01.8s +14d58m15.4s | (-22.9) | 02h54m01.8s +14d58m15.5s | (-106.7) | 0.57 (0.01) | -0.11 (0.07) | 6.48 (0.03) | 1.30 | b | 3 |
| UGC02608_N | 03h15m01.5s +42d02m08.5s | (-21.8) | 03h15m01.5s +42d02m08.6s | (-105.6) | 0.20 (0.003) | -0.22 (0.02) | 5.04 (0.02) | 1.15 | N | |
| UGC02608_S | 03h15m14.6s +41d58m49.9s | (-21.8) | 03h15m14.6s +41d58m49.9s | (-105.5) | 0.25 (0.14) | 0.52 (0.32) | 4.59 (1.60) | 1.72 | N | |
| NGC1275 | 03h19m48.2s +41d30m41.9s | (157.6) | 03h19m48.2s +41d30m41.7s | (73.8) | 0.02 (0.003) | 0.26 (0.02) | 2.73 (0.01) | 1.01 | N | |
| IRASF03217+4022 | 03h25m05.4s +40d33m32.3s | (-22.2) | 03h25m05.4s +40d33m32.3s | (-105.9) | 0.55 (0.01) | -0.47 (0.03) | 8.34 (0.07) | 1.17 | d | |
| NGC1365 | 03h33m36.4s -36d08m26.0s | (-51.0) | 03h33m36.4s -36d08m25.5s | (74.4) | 0.13 (0.002) | 0.10 (0.05) | 5.65 (0.03) | 1.67 | N | |
| IRASF03359+1523 | — | 03h38m47.1s +15d32m53.2s | (-102.3) | — | — | 12.45 (0.16) | — | d | ||
| CGCG465-012_N | 03h54m07.8s +15d59m24.1s | (-17.6) | 03h54m07.8s +15d59m24.2s | (-101.3) | 0.67 (0.02) | 0.43 (0.03) | 4.33 (0.16) | 1.83 | a | |
| CGCG465-012_S | 03h54m16.1s +15d55m43.2s | (-17.6) | 03h54m16.1s +15d55m43.3s | (-101.3) | 0.60 (0.01) | -0.02 (0.03) | 6.64 (0.66) | 1.65 | c | |
| IRAS03582+6012_W | 04h02m32.0s +60d20m38.3s | (-12.6) | 04h02m32.0s +60d20m38.3s | (-96.3) | 0.64 (0.01) | 0.08 (0.04) | 8.80 (0.08) | — | c | |
| IRAS03582+6012_E | 04h02m33.0s +60d20m41.8s | (-12.6) | 04h02m33.0s +60d20m41.8s | (-96.3) | 0.01 (0.003) | -3.04 (0.03) | 6.39 (0.02) | — | c | |
| UGC02982 | 04h12m22.6s +05d32m50.5s | (-15.8) | 04h12m22.6s +05d32m50.5s | (-99.6) | 0.68 (0.01) | 0.18 (0.03) | 5.11 (0.06) | 2.02 | d | |
| ESO420-G013 | 04h13m49.7s -32d00m25.5s | (-49.4) | 04h13m49.7s -32d00m25.5s | (-133.2) | 0.30 (0.003) | -0.27 (0.03) | 5.43 (0.04) | 1.21 | N | |
| NGC1572 | 04h22m42.8s -40d36m03.6s | (-131.6) | 04h22m42.8s -40d36m03.6s | (144.7) | 0.46 (0.01) | -0.16 (0.03) | 6.76 (0.08) | 1.20 | N | |
| IRAS04271+3849 | 04h30m33.1s +38d55m48.0s | (-10.8) | 04h30m33.1s +38d55m48.0s | (-94.5) | 0.61 (0.01) | -0.29 (0.04) | 7.85 (0.12) | 1.25 | d | |
| NGC1614 | 04h33m59.8s -08d34m43.1s | (-26.7) | 04h33m59.8s -08d34m40.8s | (-110.4) | 0.61 (0.01) | -0.41 (0.02) | 4.81 (0.01) | 1.40 | d | 5 |
| UGC03094 | 04h35m33.9s +19d10m18.3s | (167.0) | 04h35m33.8s +19d10m17.5s | (-97.5) | 0.43 (0.005) | -0.32 (0.02) | 5.05 (0.06) | 1.16 | N | |
| ESO203-IG001 | 04h46m49.5s -48d33m30.1s | (-106.3) | 04h46m49.5s -48d33m30.1s | (170.0) | 0.03 (0.01) | -3.20 (0.17) | 15.05 (0.33) | 0.98 | d | 3 |
| MCG-05-12-006 | 04h52m05.0s -32d59m27.1s | (-141.0) | 04h52m05.0s -32d59m27.0s | (135.3) | 0.53 (0.01) | -0.02 (0.03) | 7.25 (0.07) | 1.11 | N | |
| NGC1797 | 05h07m44.8s -08d01m08.7s | (-18.8) | 05h07m44.8s -08d01m08.7s | (-102.5) | 0.62 (0.01) | -0.20 (0.03) | 7.72 (0.08) | 1.30 | a | |
| CGCG468-002_W | 05h08m19.7s +17d21m47.5s | (173.1) | 05h08m19.7s +17d21m47.5s | (89.3) | 0.12 (0.005) | -0.01 (0.03) | 3.75 (0.05) | 1.04 | b | |
| CGCG468-002_E | 05h08m21.2s +17d22m07.7s | (173.1) | 05h08m21.2s +17d22m07.7s | (89.3) | 0.54 (0.01) | -0.95 (0.04) | 10.38 (0.19) | 1.03 | b | |
| IRAS05083+2441_S | 05h11m25.9s +24d45m18.0s | (170.4) | 05h11m25.9s +24d45m18.0s | (86.6) | 0.72 (0.01) | -0.16 (0.04) | 7.99 (0.11) | 1.17 | N | |
| VIIZw031 | 05h16m46.4s +79d40m12.7s | (155.0) | 05h16m46.3s +79d40m12.7s | (71.3) | 0.64 (0.01) | -0.22 (0.04) | 7.37 (0.11) | 1.27 | N | 0 |
| IRAS05129+5128 | 05h16m56.0s +51d31m57.3s | (2.3) | 05h16m56.0s +51d31m57.3s | (-81.5) | 0.54 (0.01) | -0.61 (0.04) | 8.75 (0.11) | 1.27 | d | |
| IRASF05189-2524 | 05h21m01.3s -25d21m45.6s | (-2.5) | 05h21m01.4s -25d21m46.1s | (-86.2) | 0.03 (0.002) | -0.29 (0.02) | 5.04 (0.01) | 0.98 | d | |
| IRASF05187-1017 | 05h21m06.5s -10d14m46.8s | (-13.7) | 05h21m06.5s -10d14m46.2s | (-108.7) | 0.53 (0.03) | -0.64 (0.14) | 14.90 (0.51) | 1.06 | N |
| Source | Short-Low RA/DEC | (PA) | Long-Low RA/DEC | (PA) | 6.2 EQW() | s9.7μm() | () | Scale | Merger | MS |
|---|---|---|---|---|---|---|---|---|---|---|
| Name | [J2000] | [∘] | [J2000] | [∘] | [] | Factor | Stage | (HST) | ||
| IRAS05223+1908 | 05h25m16.7s +19d10m48.0s | (-10.1) | 05h25m16.7s +19d10m48.0s | (-93.8) | 0.01 (—) | 0.12 (0.02) | 2.00 (0.01) | 0.99 | N | |
| MCG+08-11-002 | 05h40m43.7s +49d41m41.3s | (169.6) | 05h40m43.7s +49d41m41.3s | (85.9) | 0.56 (0.01) | -0.89 (0.03) | 9.47 (0.08) | 1.22 | d | |
| NGC1961 | 05h42m04.7s +69d22m43.1s | (162.9) | 05h42m04.7s +69d22m43.2s | (79.2) | 0.24 (0.01) | 0.03 (0.09) | 4.18 (0.05) | 1.93 | d | |
| UGC03351 | 05h45m48.2s +58d42m03.1s | (155.1) | 05h45m48.1s +58d42m03.2s | (71.4) | 0.53 (0.01) | -0.68 (0.04) | 6.88 (0.10) | 1.07 | a | |
| IRAS05442+1732 | 05h47m11.2s +17d33m46.5s | (-9.3) | 05h47m11.2s +17d33m46.6s | (-93.0) | 0.66 (0.01) | -0.38 (0.02) | 7.52 (0.03) | 1.16 | a | |
| IRASF06076-2139 | 06h09m45.8s -21d40m23.9s | (166.3) | 06h09m45.8s -21d40m23.8s | (110.0) | 0.33 (0.02) | -1.39 (0.09) | 7.98 (0.10) | — | c | |
| UGC03410_W | 06h13m58.8s +80d28m35.2s | (154.7) | 06h13m58.8s +80d28m35.2s | (70.8) | 0.62 (0.01) | 0.15 (0.04) | 3.38 (0.06) | 1.60 | a | |
| UGC03410_E | 06h14m30.5s +80d26m59.9s | (154.6) | 06h14m30.5s +80d26m59.9s | (71.0) | 0.63 (0.01) | 0.14 (0.05) | 5.19 (0.03) | 1.79 | a | |
| NGC2146 | 06h18m37.5s +78d21m24.3s | (17.7) | 06h18m37.7s +78d21m25.8s | (-62.4) | 0.67 (0.01) | -0.43 (0.02) | 9.96 (0.01) | 2.43 | d | |
| ESO255-IG007_W | 06h27m21.7s -47d10m36.5s | (-128.8) | 06h27m21.7s -47d10m36.4s | (147.4) | 0.62 (0.01) | -0.26 (0.02) | 8.31 (0.03) | — | b | 3 |
| ESO255-IG007_E | 06h27m22.5s -47d10m47.6s | (-128.8) | 06h27m22.5s -47d10m47.5s | (147.4) | 0.65 (0.02) | 0.26 (0.02) | 8.05 (0.04) | — | b | 3 |
| ESO255-IG007_S | 06h27m23.1s -47d11m02.9s | (-128.8) | 06h27m23.1s -47d11m02.9s | (147.4) | 0.69 (0.02) | -0.10 (0.02) | 7.27 (0.04) | — | b | 3 |
| ESO557-G002_S | 06h31m45.7s -17d38m44.8s | (-167.6) | 06h31m45.7s -17d38m44.7s | (108.7) | 0.70 (0.07) | 0.34 (0.06) | 6.42 (0.64) | 1.09 | a | |
| ESO557-G002_N | 06h31m47.2s -17d37m16.5s | (-167.6) | 06h31m47.2s -17d37m16.4s | (108.7) | 0.60 (0.01) | -0.73 (0.04) | 12.18 (0.09) | 1.04 | a | |
| UGC03608 | 06h57m34.4s +46d24m10.7s | (174.4) | 06h57m34.4s +46d24m10.7s | (90.6) | 0.53 (0.01) | -0.32 (0.03) | 7.40 (0.07) | 1.13 | b | |
| IRASF06592-6313 | 06h59m40.3s -63d17m52.5s | (-164.8) | 06h59m40.3s -63d17m52.5s | (111.5) | 0.48 (0.01) | -0.31 (0.04) | 6.98 (0.08) | 1.10 | N | |
| AM0702-601_N | 07h03m24.1s -60d15m21.8s | (-163.8) | 07h03m24.1s -60d15m21.8s | (112.4) | 0.04 (0.002) | -0.10 (0.02) | 3.11 (0.01) | 1.24 | a | 1 |
| AM0702-601_S | 07h03m28.5s -60d16m43.6s | (-163.8) | 07h03m28.5s -60d16m43.6s | (112.4) | 0.68 (0.01) | -0.05 (0.03) | 7.21 (0.72) | 1.37 | a | 1 |
| NGC2342 | 07h09m18.1s +20d38m09.5s | (2.6) | 07h09m18.1s +20d38m09.9s | (99.4) | 0.67 (0.01) | -0.06 (0.03) | 8.07 (0.11) | 1.28 | a | |
| NGC2369 | 07h16m37.9s -62d20m36.4s | (50.9) | 07h16m37.8s -62d20m34.2s | (43.2) | 0.48 (0.01) | -0.60 (0.02) | 5.88 (0.02) | 1.65 | N | |
| IRAS07251-0248 | 07h27m37.6s -02d54m54.2s | (-170.4) | 07h27m37.6s -02d54m54.2s | (105.9) | 0.09 (0.01) | -2.35 (0.14) | 13.38 (0.12) | 1.10 | d | |
| NGC2388 | 07h28m53.4s +33d49m08.9s | — | 0.53 (0.005) | 0.07 (0.06) | — | — | a | |||
| MCG+02-20-003_S | 07h35m41.5s +11d36m42.0s | (-173.9) | 07h35m41.5s +11d36m42.0s | (102.3) | 0.58 (0.05) | 0.47 (0.18) | 4.62 (0.66) | 1.74 | a | |
| MCG+02-20-003_N | 07h35m43.5s +11d42m34.7s | (-173.9) | 07h35m43.4s +11d42m34.7s | (102.3) | 0.17 (0.003) | -0.49 (0.04) | 10.08 (0.14) | 1.26 | a | |
| IRAS08355-4944 | 08h37m01.8s -49d54m30.3s | (-155.8) | 08h37m01.8s -49d54m30.2s | (120.5) | 0.19 (0.003) | -0.32 (0.02) | 6.59 (0.04) | 1.16 | d | 3 |
| IRASF08339+6517 | — | 08h38m23.2s +65d07m14.5s | (109.0) | — | — | 7.37 (0.05) | — | N | ||
| NGC2623 | 08h38m24.1s +25d45m17.4s | (11.9) | 08h38m24.1s +25d45m17.2s | (-71.8) | 0.27 (0.01) | -1.12 (0.05) | 14.66 (0.13) | 1.05 | d | 5 |
| ESO432-IG006_W | 08h44m27.2s -31d41m50.9s | (-155.6) | 08h44m27.2s -31d41m50.8s | (120.7) | 0.64 (0.01) | 0.02 (0.04) | 6.23 (0.11) | 1.29 | b | |
| ESO432-IG006_E | 08h44m28.9s -31d41m30.4s | (-155.6) | 08h44m28.9s -31d41m30.3s | (120.7) | 0.41 (0.01) | -0.01 (0.07) | 6.91 (0.14) | 1.05 | b | |
| ESO60-IG016 | 08h52m31.8s -69d01m55.8s | (-84.5) | 08h52m31.8s -69d01m55.7s | (-168.2) | 0.11 (0.004) | -1.76 (0.04) | 7.71 (0.04) | 1.09 | b | 3 |
| Source | Short-Low RA/DEC | (PA) | Long-Low RA/DEC | (PA) | 6.2 EQW() | s9.7μm() | () | Scale | Merger | MS |
|---|---|---|---|---|---|---|---|---|---|---|
| Name | [J2000] | [∘] | [J2000] | [∘] | [] | Factor | Stage | (HST) | ||
| IRASF08572+3915 | 09h00m25.4s +39d03m54.6s | (19.0) | 09h00m25.4s +39d03m55.1s | (-64.7) | 0.03 (—) | -3.58 (0.04) | 5.24 (0.01) | 1.01 | d | 3 |
| IRAS09022-3615 | 09h04m12.7s -36d27m01.6s | (23.2) | 09h04m12.7s -36d27m01.7s | (-60.5) | 0.14 (0.004) | -0.88 (0.03) | 7.97 (0.05) | 1.05 | d | |
| IRASF09111-1007_W | 09h13m36.5s -10d19m30.0s | (-160.9) | 09h13m36.5s -10d19m29.9s | (115.4) | 0.47 (0.02) | -0.73 (0.10) | 12.54 (0.39) | 1.13 | b | |
| IRASF09111-1007_E | 09h13m38.9s -10d19m19.9s | (-160.9) | 09h13m38.9s -10d19m19.9s | (115.4) | 0.52 (0.03) | -0.15 (0.07) | 5.91 (0.26) | 1.30 | b | |
| UGC04881_W | 09h15m54.7s +44d19m50.7s | (-161.0) | 09h15m54.7s +44d19m50.7s | (115.3) | 0.61 (0.01) | -0.27 (0.04) | 9.17 (0.31) | 1.10 | c | |
| UGC04881_E | 09h15m55.5s +44d19m57.2s | (-161.0) | 09h15m55.5s +44d19m57.3s | (115.3) | 0.40 (0.01) | -0.81 (0.04) | 10.22 (0.17) | 1.01 | c | |
| UGC05101 | 09h35m51.6s +61d21m11.7s | (47.4) | 09h35m51.7s +61d21m12.0s | (-36.4) | 0.13 (0.005) | -0.78 (0.05) | 7.69 (0.05) | 0.99 | d | |
| MCG+08-18-013 | — | 09h36m37.2s +48d28m27.9s | (119.2) | — | — | 7.48 (0.05) | — | a | ||
| Arp303_S | 09h46m20.3s +03d02m44.3s | (-163.3) | 09h46m20.3s +03d02m44.4s | (112.9) | 0.60 (0.02) | 0.06 (0.04) | 6.06 (0.11) | 2.55 | a | |
| Arp303_N | 09h46m21.1s +03d04m15.9s | (-163.3) | 09h46m21.1s +03d04m16.0s | (112.9) | 0.57 (0.06) | 0.08 (0.09) | 4.56 (0.10) | 1.58 | a | |
| NGC3110 | 10h04m02.0s -06d28m29.5s | (161.6) | 10h04m02.2s -06d28m31.9s | (65.7) | 0.64 (0.01) | 0.19 (0.03) | 5.91 (0.04) | 2.10 | a | |
| ESO374-IG032 | 10h06m04.7s -33d53m06.3s | (-128.3) | 10h06m04.7s -33d53m06.2s | (148.0) | 0.03 (0.002) | -2.74 (0.04) | 9.36 (0.03) | 1.13 | d | |
| IRASF10173+0828 | 10h20m00.2s +08d13m33.8s | (-162.9) | 10h20m00.2s +08d13m33.6s | (113.3) | 0.35 (0.04) | -1.20 (0.12) | 35.40 (1.38) | 1.07 | a | |
| NGC3221 | 10h22m20.3s +21d34m22.1s | (-162.9) | 10h22m20.3s +21d34m22.1s | (113.3) | 0.75 (0.01) | -0.12 (0.04) | 5.94 (0.05) | 1.44 | N | |
| NGC3256 | 10h27m51.2s -43d54m13.8s | (-5.5) | 10h27m51.3s -43d54m13.9s | (-57.4) | 0.61 (0.01) | -0.28 (0.02) | 8.16 (0.04) | 1.33 | d | 5 |
| ESO264-G036 | 10h43m07.5s -46d12m44.3s | (-111.2) | 10h43m07.5s -46d12m44.3s | (165.0) | 0.44 (0.01) | -0.04 (0.02) | 5.49 (0.03) | 1.87 | N | |
| ESO264-G057 | 10h59m01.8s -43d26m25.8s | (-137.5) | 10h59m01.8s -43d26m25.8s | (138.8) | 0.60 (0.01) | -0.19 (0.04) | 7.46 (0.10) | 1.34 | d | |
| IRASF10565+2448 | 10h59m18.1s +24d32m34.9s | (25.3) | 10h59m18.1s +24d32m35.4s | (-58.4) | 0.51 (0.01) | -0.75 (0.04) | 9.51 (0.07) | 1.08 | d | 2 |
| MCG+07-23-019 | 11h03m54.0s +40d51m00.7s | (-159.7) | 11h03m54.0s +40d51m00.7s | (116.6) | 0.64 (0.01) | -0.55 (0.03) | 12.40 (1.24) | 1.14 | d | |
| CGCG011-076 | 11h21m12.2s -02d59m02.4s | (164.4) | 11h21m12.3s -02d59m03.0s | (157.9) | 0.32 (0.02) | -0.42 (0.03) | 4.35 (0.05) | 1.30 | a | |
| IRASF11231+1456 | 11h25m45.1s +14d40m35.8s | (-166.8) | 11h25m45.1s +14d40m36.4s | (117.0) | 0.60 (0.01) | -0.22 (0.03) | 8.90 (0.20) | 0.93 | a | 1 |
| ESO319-G022 | 11h27m54.1s -41d36m52.4s | (-126.3) | 11h27m54.1s -41d36m52.4s | (150.0) | 0.42 (0.02) | -0.30 (0.05) | 10.81 (0.17) | 1.11 | d | |
| NGC3690_W | 11h28m31.1s +58d33m41.6s | (108.8) | 11h28m31.1s +58d33m43.6s | (44.3) | 0.12 (0.002) | -0.77 (0.02) | 4.48 (0.00) | — | c | 3 |
| NGC3690_E | 11h28m33.8s +58d33m47.0s | (51.5) | 11h28m33.7s +58d33m48.3s | (44.3) | 0.38 (0.003) | -1.65 (0.02) | 12.12 (0.01) | 1.44 | c | 3 |
| ESO320-G030 | 11h53m11.6s -39d07m47.3s | (166.3) | 11h53m11.6s -39d07m45.6s | (158.2) | 0.58 (0.01) | -0.22 (0.02) | 13.24 (0.05) | 1.44 | N | |
| ESO440-IG058_N | 12h06m51.7s -31d56m46.4s | (-152.0) | 12h06m51.7s -31d56m46.3s | (124.3) | 0.56 (0.02) | 0.37 (0.04) | 9.80 (0.98) | — | b | |
| ESO440-IG058_S | 12h06m51.9s -31d56m59.2s | (-152.0) | 12h06m51.9s -31d56m59.1s | (124.3) | 0.66 (0.01) | -0.45 (0.03) | 7.56 (0.06) | 1.21 | b | |
| IRASF12112+0305 | 12h13m46.0s +02d48m40.8s | (-161.5) | 12h13m46.0s +02d48m40.6s | (114.8) | 0.30 (0.03) | -1.24 (0.14) | 16.65 (0.34) | 1.13 | d | 4 |
| ESO267-G030_W | 12h13m52.3s -47d16m25.9s | (-132.3) | 12h13m52.3s -47d16m25.8s | (144.0) | 0.68 (0.01) | -0.08 (0.04) | 7.39 (0.10) | 1.15 | a | |
| NGC4194 | 12h14m09.6s +54d31m34.3s | (179.7) | 12h14m09.5s +54d31m33.8s | (96.0) | 0.55 (0.005) | -0.29 (0.02) | 7.65 (0.05) | 1.37 | d |
| Source | Short-Low RA/DEC | (PA) | Long-Low RA/DEC | (PA) | 6.2 EQW() | s9.7μm() | () | Scale | Merger | MS |
|---|---|---|---|---|---|---|---|---|---|---|
| Name | [J2000] | [∘] | [J2000] | [∘] | [] | Factor | Stage | (HST) | ||
| ESO267-G030_E | 12h14m12.8s -47d13m43.0s | (-132.4) | 12h14m12.8s -47d13m42.9s | (143.9) | 0.50 (0.01) | -0.01 (0.03) | 4.86 (0.06) | 1.61 | a | |
| IRAS12116-5615 | 12h14m22.1s -56d32m32.9s | (-132.4) | 12h14m22.1s -56d32m32.8s | (143.9) | 0.36 (0.01) | -0.85 (0.03) | 7.93 (0.07) | 1.11 | N | 0 |
| IRASF12224-0624 | 12h25m03.9s -06d40m52.2s | (17.5) | 12h25m03.9s -06d40m52.1s | (-66.3) | 0.07 (0.02) | -2.12 (0.15) | 28.34 (1.46) | 0.95 | N | |
| NGC4418 | 12h26m54.6s -00d52m40.0s | (18.9) | 12h26m54.6s -00d52m40.1s | (-64.8) | 0.02 (—) | -3.51 (0.09) | 7.83 (0.01) | 1.04 | N | |
| UGC08058 | 12h56m14.3s +56d52m25.4s | (80.3) | 12h56m14.4s +56d52m24.7s | (-3.4) | 0.01 (0.001) | -0.48 (0.02) | 3.67 (0.01) | 1.02 | d | |
| NGC4922 | 13h01m25.3s +29d18m50.0s | — | 0.16 (0.003) | -0.60 (0.24) | — | — | c | |||
| CGCG043-099 | 13h01m50.3s +04d20m00.1s | (-164.9) | 13h01m50.3s +04d20m00.2s | (111.4) | 0.55 (0.01) | -0.81 (0.03) | 9.12 (0.17) | 1.14 | d | |
| MCG-02-33-098_W | 13h02m19.7s -15d46m04.0s | (-160.9) | 13h02m19.7s -15d46m03.9s | (115.3) | 0.55 (0.01) | -0.04 (0.03) | 5.77 (0.07) | 1.15 | b | |
| MCG-02-33-098_E | 13h02m20.4s -15d45m59.4s | (-160.9) | 13h02m20.4s -15d45m59.3s | (115.3) | 0.70 (0.02) | 0.04 (0.05) | 8.47 (0.21) | 1.29 | b | |
| ESO507-G070 | 13h02m52.4s -23d55m18.3s | (-153.1) | 13h02m52.4s -23d55m18.2s | (123.2) | 0.56 (0.01) | -1.24 (0.10) | 13.58 (0.19) | 1.10 | d | |
| IRAS13052-5711 | 13h08m18.7s -57d27m29.9s | (-144.6) | 13h08m18.7s -57d27m29.9s | (131.7) | 0.61 (0.01) | -0.51 (0.03) | 12.09 (0.21) | 1.12 | a | |
| IC0860 | 13h15m03.5s +24d37m08.0s | (-177.8) | 13h15m03.5s +24d37m08.1s | (98.4) | 0.43 (0.01) | -0.98 (0.11) | 33.15 (0.29) | 1.14 | N | |
| IRAS13120-5453 | 13h15m06.5s -55d09m23.6s | (-137.2) | 13h15m06.5s -55d09m23.8s | (139.1) | 0.45 (0.01) | -0.91 (0.03) | 12.54 (0.07) | 1.26 | d | 5 |
| VV250a_W | 13h15m30.7s +62d07m45.7s | (-137.5) | 13h15m30.7s +62d07m45.7s | (138.8) | 0.76 (0.03) | -0.23 (0.11) | 8.09 (0.33) | 1.35 | b | 2 |
| VV250a_E | 13h15m35.0s +62d07m29.1s | (-137.5) | 13h15m35.0s +62d07m29.1s | (138.8) | 0.63 (0.01) | -0.67 (0.03) | 7.65 (0.05) | 1.03 | b | 2 |
| UGC08387 | 13h20m35.4s +34d08m22.1s | (-169.5) | 13h20m35.4s +34d08m22.2s | (105.6) | 0.62 (0.01) | -1.01 (0.03) | 10.80 (0.10) | 1.07 | d | 4 |
| NGC5104 | 13h21m23.1s +00d20m32.6s | (-167.4) | 13h21m23.2s +00d20m33.2s | (113.7) | 0.51 (0.01) | -0.47 (0.04) | 6.67 (0.11) | 1.21 | N | |
| MCG-03-34-064 | 13h22m24.5s -16d43m42.7s | (-159.5) | 13h22m24.5s -16d43m42.6s | (116.8) | 0.01 (—) | -0.18 (0.02) | 2.13 (0.00) | 0.96 | a | |
| NGC5135 | 13h25m44.1s -29d50m00.7s | (15.0) | 13h25m44.2s -29d50m00.4s | (-68.7) | 0.49 (0.01) | -0.24 (0.02) | 5.78 (0.03) | 1.53 | N | |
| ESO173-G015 | 13h27m23.8s -57d29m21.7s | (-148.7) | 13h27m23.8s -57d29m21.6s | (127.5) | 0.53 (0.01) | -1.31 (0.08) | 15.04 (0.07) | — | N | |
| IC4280 | 13h32m53.4s -24d12m25.3s | (-157.6) | 13h32m53.4s -24d12m25.2s | (118.6) | 0.59 (0.01) | 0.13 (0.04) | 5.24 (0.09) | 1.56 | N | |
| NGC5256 | 13h38m17.7s +48d16m32.9s | (-162.4) | 13h38m17.6s +48d16m33.9s | (113.9) | 0.44 (0.02) | -0.47 (0.03) | 6.41 (0.03) | — | b | 3 |
| Arp240_W | 13h39m53.0s +00d50m25.3s | (19.1) | 13h39m53.0s +00d50m25.3s | (-64.6) | 0.63 (0.01) | -0.01 (0.03) | 7.18 (0.19) | 1.66 | b | 2 |
| Arp240_E | 13h39m57.7s +00d49m51.0s | (19.1) | 13h39m57.7s +00d49m51.0s | (-64.6) | 0.54 (0.01) | 0.12 (0.03) | 6.31 (0.19) | 1.69 | b | |
| UGC08696 | 13h44m42.2s +55d53m13.2s | (93.5) | 13h44m42.3s +55d53m12.6s | (9.8) | 0.12 (0.01) | -1.37 (0.05) | 12.36 (0.07) | 1.06 | d | 4 |
| UGC08739 | 13h49m13.9s +35d15m26.6s | (-169.7) | 13h49m13.9s +35d15m26.6s | (106.5) | 0.51 (0.01) | -0.59 (0.03) | 6.74 (0.12) | 2.14 | N | |
| ESO221-IG010 | 13h50m56.9s -49d03m19.2s | (-153.3) | 13h50m56.9s -49d03m19.1s | (123.0) | 0.69 (0.01) | 0.03 (0.03) | 7.26 (0.08) | 1.48 | N | |
| NGC5331_S | 13h52m16.2s +02d06m05.5s | (-171.0) | 13h52m16.2s +02d06m05.5s | (105.2) | 0.61 (0.01) | -0.43 (0.03) | 7.06 (0.10) | 1.19 | c | 3 |
| NGC5331_N | 13h52m16.5s +02d06m31.3s | (-171.0) | 13h52m16.4s +02d06m31.3s | (105.2) | 0.60 (0.01) | 0.13 (0.03) | 5.24 (0.24) | 1.11 | c | 3 |
| Arp84_N | 13h58m33.6s +37d27m13.2s | (-178.0) | 13h58m33.6s +37d27m13.2s | (98.2) | 0.62 (0.01) | -0.08 (0.03) | 6.84 (0.03) | 1.09 | c |
| Source | Short-Low RA/DEC | (PA) | Long-Low RA/DEC | (PA) | 6.2 EQW() | s9.7μm() | () | Scale | Merger | MS |
|---|---|---|---|---|---|---|---|---|---|---|
| Name | [J2000] | [∘] | [J2000] | [∘] | [] | Factor | Stage | (HST) | ||
| Arp84_S | 13h58m37.9s +37d25m28.2s | (-178.0) | 13h58m37.9s +37d25m28.2s | (98.2) | 0.17 (0.02) | 0.52 (0.07) | 3.82 (0.24) | 2.10 | c | |
| CGCG247-020 | 14h19m43.3s +49d14m11.5s | (-152.2) | 14h19m43.3s +49d14m11.6s | (115.2) | 0.56 (0.01) | -0.20 (0.03) | 7.64 (0.10) | 1.13 | N | |
| NGC5653 | 14h30m10.4s +31d12m56.1s | (172.7) | 14h30m10.4s +31d12m56.1s | (89.0) | 0.54 (0.01) | 0.25 (0.03) | 7.35 (0.04) | — | N | |
| IRASF14348-1447 | 14h37m38.4s -15d00m24.0s | (-167.2) | 14h37m38.3s -15d00m24.6s | (109.1) | 0.25 (0.01) | -1.36 (0.16) | 16.76 (0.36) | 1.14 | d | 4 |
| IRASF14378-3651 | 14h40m59.0s -37d04m33.1s | (-160.3) | 14h40m58.9s -37d04m33.0s | (116.0) | 0.39 (0.03) | -1.14 (0.16) | 15.71 (0.30) | 1.08 | d | 6 |
| NGC5734_N | 14h45m09.0s -20d52m13.2s | (-167.1) | 14h45m09.0s -20d52m13.2s | (109.1) | 0.47 (0.01) | 0.12 (0.03) | 5.01 (0.14) | 1.66 | a | |
| NGC5734_S | 14h45m11.0s -20d54m48.7s | (-167.1) | 14h45m11.0s -20d54m48.5s | (109.1) | 0.49 (0.01) | -0.04 (0.04) | 5.07 (0.08) | 2.15 | a | |
| VV340a_S | 14h57m00.3s +24d36m24.2s | (177.8) | 14h57m00.3s +24d36m24.3s | (94.1) | 0.58 (0.02) | 0.33 (0.04) | 4.82 (0.31) | 1.37 | b | 1 |
| VV340a_N | 14h57m00.7s +24d37m05.4s | (177.8) | 14h57m00.7s +24d37m05.5s | (94.1) | 0.58 (0.01) | -0.63 (0.03) | 6.21 (0.10) | 0.82 | b | 1 |
| CGCG049-057 | 15h13m13.1s +07d13m33.1s | (155.9) | 15h13m13.0s +07d13m35.2s | (59.8) | 0.51 (0.04) | -0.83 (0.03) | 31.40 (0.39) | 1.05 | N | |
| VV705 | 15h18m06.4s +42d44m36.6s | (-145.5) | — | 0.75 (0.06) | 0.32 (0.06) | — | — | b | ||
| ESO099-G004 | 15h24m58.0s -63d07m29.2s | (-169.3) | 15h24m58.0s -63d07m29.1s | (106.9) | 0.53 (0.01) | -0.78 (0.04) | 7.74 (0.06) | 1.04 | d | 3 |
| IRASF15250+3608 | 15h26m59.4s +35d58m37.7s | (170.1) | 15h26m59.4s +35d58m37.2s | (86.3) | 0.03 (0.01) | -2.69 (0.07) | 10.52 (0.03) | 0.97 | d | 5 |
| NGC5936 | 15h30m00.8s +12d59m22.3s | (-172.2) | 15h30m00.8s +12d59m22.4s | (104.0) | 0.62 (0.01) | -0.13 (0.03) | 6.41 (0.07) | 1.25 | N | |
| Arp220 | 15h34m57.3s +23d30m11.7s | (178.0) | 15h34m57.2s +23d30m11.1s | (94.2) | 0.17 (0.004) | -2.26 (0.06) | 20.38 (1.67) | 1.08 | d | 4 |
| NGC5990 | 15h46m16.4s +02d24m55.7s | (-171.3) | 15h46m16.4s +02d24m55.8s | (104.9) | 0.15 (0.002) | -0.11 (0.03) | 4.74 (0.02) | 1.22 | a | |
| NGC6052 | 16h05m13.1s +20d32m35.6s | (59.0) | 16h05m12.9s +20d32m35.5s | (51.7) | 0.69 (0.03) | -0.06 (0.03) | 6.63 (0.04) | 3.08 | c | |
| NGC6090 | 16h11m40.2s +52d27m24.9s | (26.8) | 16h11m40.3s +52d27m24.7s | (-57.0) | 0.73 (0.02) | -0.04 (0.03) | 7.54 (0.03) | — | c | 4 |
| IRASF16164-0746 | 16h19m11.8s -07d54m02.7s | (-177.8) | 16h19m11.8s -07d54m02.7s | (102.1) | 0.61 (0.01) | -1.18 (0.07) | 11.58 (0.20) | 1.03 | d | 5 |
| CGCG052-037 | 16h30m56.5s +04d04m58.5s | (16.1) | 16h30m56.5s +04d04m58.8s | (101.2) | 0.62 (0.01) | -0.21 (0.02) | 7.07 (0.09) | 1.16 | N | |
| NGC6156 | 16h34m52.5s -60d37m07.5s | (-179.8) | 16h34m52.5s -60d37m07.5s | (96.4) | 0.37 (0.01) | 0.47 (0.02) | 5.89 (0.02) | 1.23 | N | |
| ESO069-IG006 | 16h38m11.8s -68d26m08.0s | (178.6) | 16h38m11.8s -68d26m07.9s | (94.8) | 0.64 (0.01) | -0.40 (0.04) | 7.91 (0.10) | 1.17 | b | 2 |
| IRASF16399-0937 | 16h42m40.1s -09d43m13.5s | (-176.4) | 16h42m40.1s -09d43m13.4s | (99.9) | 0.43 (0.01) | -1.12 (0.04) | 9.09 (0.09) | 1.14 | d | 3 |
| ESO453-G005_N | 16h47m29.4s -29d19m06.8s | (-175.6) | 16h47m29.4s -29d19m06.7s | (100.7) | 0.74 (0.07) | 0.47 (0.05) | 5.21 (0.14) | 1.51 | N | |
| ESO453-G005_S | 16h47m31.1s -29d21m21.6s | (-175.6) | 16h47m31.1s -29d21m21.5s | (100.6) | 0.42 (0.01) | -0.47 (0.09) | 27.11 (2.71) | 1.22 | N | |
| NGC6240 | 16h52m58.9s +02d24m03.7s | (-177.4) | 16h52m58.9s +02d24m03.0s | (98.9) | 0.35 (0.01) | -0.92 (0.07) | 7.72 (0.04) | 1.05 | d | 4 |
| IRASF16516-0948 | 16h54m23.9s -09d53m20.6s | (-177.9) | 16h54m23.9s -09d53m20.5s | (98.4) | 0.69 (0.01) | 0.18 (0.03) | 7.02 (0.15) | 1.67 | d | |
| NGC6286_N | 16h58m24.0s +58d57m21.4s | (-117.4) | 16h58m24.0s +58d57m21.9s | (116.3) | 0.66 (0.02) | 0.08 (0.03) | 6.81 (0.07) | 1.14 | b | |
| NGC6286_S | 16h58m31.3s +58d56m10.7s | (27.8) | 16h58m31.7s +58d56m13.5s | (116.3) | 0.59 (0.01) | -0.40 (0.03) | 5.97 (0.04) | 0.91 | b | |
| IRASF17132+5313 | — | 17h14m20.2s +53d10m30.4s | (-102.2) | — | — | 9.67 (0.97) | — | b |
| Source | Short-Low RA/DEC | (PA) | Long-Low RA/DEC | (PA) | 6.2 EQW() | s9.7μm() | () | Scale | Merger | MS |
|---|---|---|---|---|---|---|---|---|---|---|
| Name | [J2000] | [∘] | [J2000] | [∘] | [] | Factor | Stage | (HST) | ||
| IRASF17138-1017 | 17h16m35.6s -10d20m37.9s | (173.8) | 17h16m36.0s -10d20m41.2s | (1.2) | 0.68 (0.01) | -0.37 (0.04) | 7.17 (1.51) | 4.12 | d | 6 |
| IRASF17207-0014 | 17h23m22.0s -00d17m00.8s | (173.2) | 17h23m22.0s -00d17m01.0s | (89.5) | 0.31 (0.01) | -1.26 (0.07) | 26.39 (0.24) | 1.22 | d | 5 |
| ESO138-G027 | 17h26m43.4s -59d55m54.8s | (-177.1) | 17h26m43.3s -59d55m54.7s | (99.1) | 0.52 (0.01) | -0.35 (0.06) | 8.13 (0.03) | 1.14 | N | |
| UGC11041 | 17h54m51.9s +34d46m34.0s | (-14.4) | 17h54m51.9s +34d46m34.0s | (-98.2) | 0.58 (0.01) | 0.07 (0.03) | 5.27 (0.04) | 2.26 | N | |
| CGCG141-034 | 17h56m56.6s +24d01m01.8s | (-11.9) | 17h56m56.6s +24d01m01.8s | (-95.6) | 0.48 (0.01) | -0.64 (0.06) | 9.35 (0.16) | 1.18 | N | |
| IRAS17578-0400_W | 18h00m24.3s -04d01m04.2s | (171.6) | 18h00m24.3s -04d01m04.1s | (87.9) | 0.62 (0.02) | 0.16 (0.09) | 8.56 (0.25) | 2.28 | b | |
| IRAS17578-0400_N | 18h00m31.8s -04d00m53.8s | (171.6) | 18h00m31.8s -04d00m53.7s | (87.9) | 0.68 (0.01) | -0.67 (0.05) | 21.18 (0.24) | 1.45 | b | |
| IRAS17578-0400_S | 18h00m34.1s -04d01m44.3s | (171.6) | 18h00m34.1s -04d01m44.2s | (87.9) | 0.78 (0.01) | 0.15 (0.07) | 6.38 (0.21) | 1.83 | a | |
| IRAS18090+0130_W | 18h11m33.4s +01d31m42.3s | (169.3) | 18h11m33.4s +01d31m42.4s | (85.5) | 0.52 (0.03) | -0.72 (0.10) | 8.04 (0.26) | 1.19 | b | |
| IRAS18090+0130_E | 18h11m38.4s +01d31m40.2s | (169.3) | 18h11m38.4s +01d31m40.3s | (85.5) | 0.61 (0.01) | -0.28 (0.04) | 7.16 (0.06) | 1.22 | b | 2 |
| NGC6621 | 18h12m55.2s +68d21m48.4s | (21.6) | 18h12m54.8s +68d21m48.7s | (5.2) | 0.56 (0.01) | -0.16 (0.02) | 5.83 (0.01) | 1.26 | b | |
| IC4687 | 18h13m39.7s -57d43m30.5s | (13.6) | 18h13m40.2s -57d43m33.5s | (2.1) | 0.73 (0.02) | 0.12 (0.02) | 6.50 (0.02) | 1.56 | b | |
| CGCG142-034_W | 18h16m33.8s +22d06m38.9s | (172.9) | 18h16m33.8s +22d06m39.0s | (89.1) | 0.48 (0.01) | -0.24 (0.03) | 5.62 (0.21) | 1.03 | a | |
| CGCG142-034_E | 18h16m40.7s +22d06m46.4s | (172.9) | 18h16m40.7s +22d06m46.5s | (89.1) | 0.51 (0.01) | -0.48 (0.03) | 7.34 (0.11) | 1.95 | a | |
| IRASF18293-3413 | 18h32m41.1s -34d11m27.1s | (-8.8) | 18h32m41.1s -34d11m27.1s | (-92.5) | 0.63 (0.01) | -0.51 (0.02) | 7.66 (0.05) | 1.38 | c | 1 |
| NGC6670_W | 18h33m34.3s +59d53m17.9s | (-7.3) | 18h33m34.3s +59d53m17.9s | (-91.0) | 0.63 (0.01) | -0.22 (0.03) | 8.82 (0.11) | 1.85 | b | 2 |
| NGC6670_E | 18h33m37.8s +59d53m22.8s | (-7.3) | 18h33m37.8s +59d53m22.8s | (-91.0) | 0.61 (0.01) | -0.34 (0.03) | 8.78 (0.10) | 1.26 | b | 2 |
| IC4734 | 18h38m25.8s -57d29m25.4s | (167.4) | 18h38m25.8s -57d29m25.3s | (83.7) | 0.51 (0.01) | -0.60 (0.04) | 8.26 (0.09) | 1.35 | N | |
| NGC6701 | 18h43m12.5s +60d39m11.9s | (-6.0) | 18h43m12.5s +60d39m11.9s | (-89.8) | 0.55 (0.01) | -0.15 (0.09) | 7.10 (0.07) | 1.27 | N | |
| VV414_W | 19h10m53.9s +73d24m36.1s | (0.6) | 19h10m53.9s +73d24m36.1s | (-83.2) | 0.64 (0.01) | 0.10 (0.03) | 7.24 (0.06) | 1.41 | c | 2 |
| VV414_E | 19h11m04.3s +73d25m32.6s | (0.6) | 19h11m04.3s +73d25m32.6s | (-83.1) | 0.29 (0.01) | -0.08 (0.02) | 5.46 (0.02) | 1.08 | c | 2 |
| ESO593-IG008 | 19h14m31.2s -21d19m06.4s | (-13.2) | 19h14m31.2s -21d19m06.3s | (-96.9) | 0.56 (0.01) | -0.59 (0.03) | 8.92 (0.12) | 1.38 | d | 4 |
| IRASF19297-0406 | 19h32m22.3s -04d00m00.2s | (156.3) | 19h32m22.3s -04d00m00.2s | (72.6) | 0.30 (0.02) | -1.05 (0.13) | 15.07 (0.25) | 1.16 | d | 4 |
| IRAS19542+1110 | 19h56m35.8s +11d19m05.4s | (-6.4) | 19h56m35.8s +11d19m05.4s | (-90.1) | 0.29 (0.02) | -0.74 (0.08) | 14.53 (0.31) | 1.07 | N | 0 |
| ESO339-G011 | 19h57m37.6s -37d56m08.4s | (-22.0) | 19h57m37.6s -37d56m08.4s | (-105.8) | 0.27 (0.01) | -0.31 (0.03) | 4.64 (0.04) | 1.22 | N | |
| NGC6907 | 20h25m06.5s -24d48m32.6s | (-22.2) | 20h25m06.5s -24d48m32.5s | (-105.9) | 0.57 (0.01) | 0.10 (0.03) | 6.67 (0.04) | 1.62 | N | |
| MCG+04-48-002 | 20h28m35.1s +25d44m00.2s | (2.8) | 20h28m35.1s +25d44m00.2s | (-80.9) | 0.57 (0.01) | -0.47 (0.03) | 5.22 (0.05) | 1.73 | a | |
| NGC6926 | 20h33m06.1s -02d01m38.8s | (-12.0) | 20h33m06.1s -02d01m38.7s | (-95.7) | 0.37 (0.01) | -0.49 (0.03) | 5.07 (0.05) | 1.45 | d | |
| IRAS20351+2521 | 20h37m17.7s +25d31m39.1s | (3.8) | 20h37m17.7s +25d31m39.1s | (-79.9) | 0.57 (0.01) | -0.24 (0.04) | 7.50 (0.10) | 1.68 | N | 0 |
| CGCG448-020_W | 20h57m24.0s +17d07m35.1s | (-11.9) | 20h57m24.0s +17d07m35.2s | (-95.6) | 0.48 (0.01) | -0.42 (0.02) | 9.14 (0.04) | — | c | 3 |
| Source | Short-Low RA/DEC | (PA) | Long-Low RA/DEC | (PA) | 6.2 EQW() | s9.7μm() | () | Scale | Merger | MS |
|---|---|---|---|---|---|---|---|---|---|---|
| Name | [J2000] | [∘] | [J2000] | [∘] | [] | Factor | Stage | (HST) | ||
| CGCG448-020_E | 20h57m24.3s +17d07m39.1s | (-11.9) | 20h57m24.3s +17d07m39.2s | (-95.6) | 0.27 (0.01) | -0.92 (0.03) | 9.82 (0.04) | — | c | 3 |
| IRAS20551-4250 | 20h58m26.8s -42d39m01.7s | (162.1) | 20h58m26.7s -42d39m02.8s | (78.4) | 0.10 (0.01) | -2.52 (0.10) | 7.59 (0.02) | 1.04 | d | 5 |
| ESO286-G035 | 21h04m11.1s -43d35m34.4s | (-27.5) | 21h04m11.1s -43d35m34.4s | (-111.2) | 0.69 (0.01) | -0.24 (0.03) | 7.02 (0.09) | 1.43 | a | |
| IRAS21101+5810 | 21h11m29.3s +58d23m07.6s | (10.5) | 21h11m29.3s +58d23m07.6s | (-73.2) | 0.55 (0.02) | -0.87 (0.07) | 11.06 (0.15) | 1.04 | c | 2 |
| ESO343-IG013_S | 21h36m10.5s -38d32m42.4s | (-31.9) | 21h36m10.5s -38d32m42.4s | (-115.6) | 0.61 (0.01) | -0.09 (0.03) | 9.21 (0.18) | — | c | |
| ESO343-IG013_N | 21h36m10.9s -38d32m32.6s | (-1.9) | 21h36m10.9s -38d32m32.6s | (-115.6) | 0.47 (0.01) | -0.48 (0.02) | 6.71 (0.07) | — | c | |
| NGC7130 | 21h48m19.6s -34d57m01.9s | (154.1) | 21h48m19.5s -34d57m02.1s | (70.4) | 0.30 (0.01) | -0.27 (0.03) | 5.67 (0.03) | 1.42 | N | |
| ESO467-G027 | 22h14m39.9s -27d27m51.4s | (-36.7) | 22h14m39.9s -27d27m51.3s | (-120.4) | 0.62 (0.01) | 0.29 (0.02) | 5.48 (0.09) | 2.24 | N | |
| IC5179 | 22h16m09.0s -36d50m38.1s | (121.5) | 22h16m09.3s -36d50m33.8s | (115.9) | 0.63 (0.01) | 0.07 (0.02) | 5.42 (0.02) | 2.43 | N | |
| ESO602-G025 | 22h31m25.5s -19d02m04.0s | (-31.4) | 22h31m25.4s -19d02m04.0s | (-117.1) | 0.45 (0.01) | -0.66 (0.04) | 6.23 (0.08) | 1.17 | N | |
| UGC12150 | 22h41m12.2s +34d14m56.9s | (-20.1) | 22h41m12.2s +34d14m56.8s | (-98.7) | 0.53 (0.01) | -0.42 (0.02) | 8.14 (0.09) | 1.27 | N | |
| ESO239-IG002 | 22h49m39.8s -48d50m58.4s | (-48.3) | 22h49m39.8s -48d50m58.4s | (-132.0) | 0.45 (0.02) | -0.49 (0.04) | 10.35 (0.12) | 1.08 | d | 5 |
| IRASF22491-1808 | 22h51m49.4s -17d52m24.5s | (155.2) | 22h51m49.2s -17d52m24.8s | (71.5) | 0.48 (0.02) | -1.04 (0.13) | 17.63 (0.33) | 1.14 | d | 4 |
| NGC7469 | 23h03m15.6s +08d52m26.2s | (-29.7) | 23h03m15.6s +08d52m27.3s | (-113.4) | 0.23 (0.002) | 0.06 (0.02) | 4.81 (0.03) | 1.12 | a | 2 |
| CGCG453-062 | 23h04m56.5s +19d33m07.6s | (-24.9) | 23h04m56.6s +19d33m07.8s | (-103.6) | 0.58 (0.02) | -0.46 (0.04) | 12.83 (0.10) | 1.50 | N | |
| ESO148-IG002 | 23h15m47.0s -59d03m17.0s | (136.3) | 23h15m47.0s -59d03m18.4s | (52.6) | 0.31 (0.01) | -0.66 (0.03) | 6.49 (0.05) | 1.03 | c | 4 |
| IC5298 | 23h16m00.7s +25d33m24.4s | (-19.5) | 23h16m00.7s +25d33m24.5s | (-103.3) | 0.12 (0.004) | -0.37 (0.02) | 7.41 (0.02) | 1.01 | N | 0 |
| NGC7552 | 23h16m10.6s -42d35m03.8s | (112.9) | 23h16m10.6s -42d35m05.8s | (107.8) | 0.56 (0.01) | -0.21 (0.02) | 6.62 (0.01) | 1.72 | N | |
| NGC7591 | 23h18m16.3s +06d35m08.7s | (-27.4) | 23h18m16.2s +06d35m09.2s | (-109.7) | 0.48 (0.01) | -0.37 (0.05) | 7.96 (0.13) | 1.21 | N | |
| NGC7592_W | 23h18m21.7s -04d24m57.6s | (119.1) | 23h18m21.5s -04d24m54.2s | (112.9) | 0.30 (0.01) | -1.08 (0.03) | 5.13 (0.02) | 1.10 | b | |
| NGC7592_E | 23h18m22.7s -04d24m57.8s | (119.1) | 23h18m22.8s -04d25m02.3s | (112.9) | 0.69 (0.01) | 0.11 (0.02) | 8.38 (0.07) | 1.20 | b | |
| ESO077-IG014_W | 23h21m03.7s -69d13m00.9s | (-55.8) | 23h21m03.7s -69d13m00.9s | (-139.5) | 0.63 (0.01) | -0.59 (0.04) | 11.84 (0.17) | — | b | 2 |
| ESO077-IG014_E | 23h21m05.4s -69d12m47.2s | (-55.8) | 23h21m05.4s -69d12m47.2s | (-139.5) | 0.49 (0.01) | -0.61 (0.03) | 12.54 (0.12) | — | b | 2 |
| NGC7674 | 23h27m56.7s +08d46m44.5s | (116.5) | 23h27m56.6s +08d46m41.8s | (20.5) | 0.02 (0.01) | -0.13 (0.02) | 2.52 (0.02) | 1.13 | a | 2 |
| NGC7679 | 23h28m46.6s +03d30m41.7s | (-27.4) | 23h28m46.6s +03d30m41.7s | (-111.1) | 0.64 (0.01) | 0.34 (0.02) | 5.78 (0.06) | 1.41 | a | |
| IRASF23365+3604 | 23h39m01.3s +36d21m10.2s | (-35.5) | 23h39m01.4s +36d21m11.3s | (-119.2) | 0.41 (0.02) | -1.41 (0.17) | 10.04 (0.11) | 1.89 | d | 5 |
| MCG-01-60-022 | — | 23h42m00.7s -03d36m54.7s | (-114.0) | — | — | 7.24 (0.13) | — | a | ||
| IRAS23436+5257 | 23h46m05.4s +53d14m01.3s | (-3.9) | 23h46m05.4s +53d14m01.3s | (-87.7) | 0.37 (0.01) | -0.22 (0.03) | 7.00 (0.06) | 1.24 | c | 4 |
| Arp86_S | 23h46m58.5s +29d27m31.6s | (-19.8) | 23h46m58.5s +29d27m31.8s | (-103.5) | 0.72 (0.01) | 0.12 (0.02) | 6.14 (0.11) | 1.61 | b | |
| Arp86_N | 23h47m04.8s +29d28m59.6s | (-19.7) | 23h47m04.8s +29d28m59.8s | (-103.5) | 0.32 (0.01) | 0.14 (0.04) | 6.72 (0.18) | 1.53 | b |
| Source | Short-Low RA/DEC | (PA) | Long-Low RA/DEC | (PA) | 6.2 EQW() | s9.7μm() | () | Scale | Merger | MS |
|---|---|---|---|---|---|---|---|---|---|---|
| Name | [J2000] | [∘] | [J2000] | [∘] | [] | Factor | Stage | (HST) | ||
| NGC7771_W | 23h51m04.0s +20d09m02.0s | (-19.8) | 23h51m04.0s +20d09m02.0s | (-103.6) | 0.39 (0.01) | 0.27 (0.06) | 6.26 (0.11) | 1.34 | N | |
| NGC7771_S | 23h51m22.5s +20d05m47.0s | (-19.8) | 23h51m22.5s +20d05m47.0s | (-103.6) | 0.36 (0.01) | -0.20 (0.04) | 4.42 (0.05) | 2.11 | c | |
| NGC7771_N | 23h51m24.9s +20d06m43.0s | (-19.8) | 23h51m24.9s +20d06m43.1s | (-103.6) | 0.52 (0.01) | -0.24 (0.03) | 8.43 (0.04) | 1.95 | a | |
| MRK0331 | 23h51m26.7s +20d35m10.1s | (-19.6) | 23h51m26.7s +20d35m10.3s | (-103.3) | 0.63 (0.01) | -0.35 (0.03) | 9.40 (0.05) | 1.19 | a | 1 |
MIR Spectral Parameters of the GOALS Sample. Column (1): Source Name, Columns (2)-(5): the central right ascension, declination, and
position angle of the field of view
for the SL and LL observations (for staring mode data:
RA_FOV, DEC_FOV, & PA_FOV from the headers with a
pointing accuracy within 1′′; for mapping mode data: calculated
from the four corners of the extraction aperture used in CUBISM), Column (6): the equivalent width of the
6.2m PAH feature in m, Column (7): the apparent depth of the
9.7m silicate absorption feature, Column (8): the MIR slope calculated
using Fν at 15 and 30m, Column (9): the SL-to-LL scale factor, Column (10): the merger stage (N nonmerger, a pre-merger, b early stage merger, c mid-stage merger, and d late stage merger, see Section 2.5 for details), and Column (11): merger stage as derived from the high resolution HST data (0 nonmerger, 1 pre-merger, 2 ongoing merger with separable progenitor galaxies, 3 ongoing merger with progenitors sharing a common envelope, 4 ongoing merger with double nuclei plus tidal tail, 5 post-merger with single nucleus plus prominent tail, and 6 post-merger with single nucleus with disturbed morphology, as described in Haan et al. (2011)).
Data was taken in mapping mode, and so the PA was user-selected.