11email: pmaggi@mpe.mpg.de 22institutetext: Warsaw University Observatory, Al. Ujazdowskie 4, 00-478 Warzawa, Poland 33institutetext: Institut für Astronomie und Astrophysik Tübingen, Universität Tübingen, Sand 1, 72076 Tübingen, Germany
Discovery of a 168.8 s X-ray pulsar transiting in front of its
Be
companion star in the Large Magellanic Cloud ††thanks: Based on observations
obtained with XMM-Newton, an ESA science mission with instruments and contributions
directly funded by ESA Member States and NASA.
Abstract
Aims. We report the discovery of LXP 169, a new high-mass X-ray binary in the Large Magellanic Cloud. The optical counterpart has been identified and appears to exhibit an eclipsing light curve. We performed follow-up observations to clarify the eclipsing nature of the system.
Methods. Energy spectra and time series were extracted from two XMM-Newton observations to search for pulsations, characterise the spectrum, and measure spectral and timing changes. Long-term X-ray variability was studied using archival ROSAT data. The XMM-Newton positions were used to identify the optical counterpart. We obtained ultraviolet to near-infrared photometry to characterise the companion, along with its 4000 d -band light curve and colour-magnitude variability. We observed LXP 169 with Swift at two predicted eclipse times.
Results. We found a spin period of 168.8 s that did not change between two XMM-Newton observations. The X-ray spectrum, well characterised by a power law, was harder when the source was brighter. The X-ray flux of LXP 169 is found to be variable by a factor of at least 10. The counterpart is highly variable on short and long timescales, and its photometry is that of an early-type star with an ouflowing circumstellar disc producing a near-infrared excess. This classifies the source as a Be/X-ray binary pulsar. We observe a transit in the ultraviolet, thereby confirming that the companion star itself is eclipsed. We give an ephemeris for the transit of MJD . We propose and discuss the scenario where the matter captured from the companion’s equatorial disc creates an extended region of high density around the neutron star, which partially eclipses the companion as the neutron star transits in front of it.
Conclusions. This is most likely the first time the compact object in an X-ray binary is observed to eclipse its companion star. LXP 169 would be the first eclipsing Be/X-ray binary, and a wealth of important information might be gained from additional observations, such as a measure of the possible Be disc / orbital plane misalignment, or the mass of the neutron star.
Key Words.:
X-rays: binaries – Stars: neutron – Stars: emission-line, Be – binaries: eclipsing – X-rays: individuals: LXP 169 – Magellanic Clouds| Identifier | Date of observation start | Central coordinates (J2000) | Total / filtered exposure time (ks) a𝑎aa𝑎aPerformed duration (total) and useful (filtered) exposure times, after removing high background intervals. | Off-axis | Orbital | |||
| (date / MJD) | RA | DEC | pn | MOS1 | MOS2 | angle b𝑏bb𝑏bAngle in arcmin between the central coordinates and the X-ray source. Swift observations were on-axis. | phase d𝑑dd𝑑dfootnotemark: | |
| XMM-Newton | ||||||||
| 0690742501 (XMM1) | 2012 Jul 13 / 56121.23 | 05h 06m 40.9s | 68° 18m 30s | 24.2/19.4 | 26.7/20.1 | 26.7/20.2 | 9.5 | 0.603-0.612 |
| 0690742401 (XMM2) | 2012 Sep 09 / 56179.06 | 05h 09m 44.3s | 68° 21m 13s | 29.4/26.0 | 30.5/27.2 | 30.5/27.2 | 10.8 | 0.980–0.994 |
| ROSAT | Exposure time | Count rate | Off-axis | Orbital | ||||
| (ks) | ( cts s-1) | angleb𝑏bb𝑏bAngle in arcmin between the central coordinates and the X-ray source. Swift observations were on-axis. | phase | |||||
| rp300129n00 | 1992 Apr 09 / 48721.07 | 05h 08m 00.0s | 68° 37m 48s | 3.7 | 3.21.2 | 12.8 | 0.433–0.447 | |
| rp500037n00 | 1992 Apr 09 / 48721.54 | 04h 49m 00.0s | 68° 43m 48s | 4.8 | 8.21.6 | 19.7 | 0.452–0.618 | |
| rp500060n00 | 1992 Apr 11 / 48723.20 | 05h 05m 43.2s | 67° 52m 47s | 3.9 | c𝑐cc𝑐c upper limit. | 34.8 | 0.520–0.662 | |
| Swift/XRT | ||||||||
| 00032578001 | 2012 Oct 02 / 56202.00 | 05h 07m 51.3s | 68° 24m 25s | 1.1 | 7.1 c𝑐cc𝑐c upper limit. | — | 0.923–0.942 | |
| 00032578002 | 2012 Oct 03 / 56203.61 | 05h 07m 49.2s | 68° 24m 20s | 3.5 | 4.0 c𝑐cc𝑐c upper limit. | — | 0.989–1.001 | |
| 00032578003 | 2012 Oct 04 / 56204.81 | 05h 07m 55.4s | 68° 24m 45s | 1.0 | 8.8 c𝑐cc𝑐c upper limit. | — | 0.038–0.039 | |
| 00032578004 | 2012 Oct 10 / 56210.41 | 05h 07m 37.5s | 68° 21m 33s | 1.3 | 11.4 c𝑐cc𝑐c upper limit. | — | 0.269–0.275 | |
| 00032578005 | 2012 Oct 27 / 56227.71 | 05h 07m 50.6s | 68° 23m 59s | 1.0 | 12.54.0 | — | 0.979–0.980 | |
| 00032578006 | 2012 Oct 28 / 56228.25 | 05h 07m 56.4s | 68° 24m 18s | 5.2 | 9.61.6 | — | 0.002–0.013 | |
| 00032578007 | 2012 Oct 29 / 56229.51 | 05h 07m 52.6s | 68° 23m 22s | 0.3 | 50.4 c𝑐cc𝑐c upper limit. | — | 0.054 | |
1 Introduction
Be/X-ray binaries (hereafter BeXRBs) are a major subclass of X-ray binaries. In these systems, a compact object accretes material from a normal companion star. The optical counterparts are non-supergiant, emission-line stars, which have spectral classes later than O5 and earlier than B9, with the bulk of the population concentrated around B0–B1 (Coe et al. 2005). Classical OBe stars are rapid rotators surrounded by an equatorial disc of circumstellar material. The disc emits lines, chiefly the Balmer and Paschen series of hydrogen, but also a few He and Fe lines. An infrared excess is also produced by the equatorial disc (for a recent review, see e.g. Reig 2011).
In BeXRBs the neutron star (there is no confirmed black hole/Be X-ray binary yet) is usually in a wide orbit with a significant eccentricity (orbital periods of tens to a few hundred of days, and , Townsend et al. 2011) around its companion, leading to a transient nature of the system. Copious amounts of X-rays can be produced when the neutron star captures material from the equatorial disc of the Be star. This occurs when the separation between the two components is the smallest, i.e. at or near periastron passage, and leads to the so-called Type I X-ray outbursts, which last for a small fraction of the orbital period and have X-ray luminosities erg s-1. Less frequently, giant (Type II) outbursts can occur, reaching luminosities in excess of erg s-1 and lasting for several orbital periods. Although many questions remain open, it has been suggested that giant outbursts are associated to warping episodes of a Be disc misaligned with respect to the orbital plane (see Okazaki et al. 2012, and references therein).
The study of BeXRBs in our nearest neighbour galaxies, the Large and Small Magellanic Clouds (LMC and SMC, respectively), is rewarding. It presents several advantages over a similar study in our own Galaxy (in particular, low foreground absorption and known distances). In recent years a large population of BeXRBs has been identified in the SMC, with a total of confirmed systems (Haberl & Pietsch 2004; Coe et al. 2005, 2010). About 45 candidates have also been identified during the XMM-Newton survey of the SMC (Sturm et al. 2013). While the LMC is about ten times as massive as the SMC, it contains only 14 confirmed BeXRBs so far (Liu et al. 2005; Masetti et al. 2006; Sturm et al. 2012; Klus et al. 2013). This discrepancy is possibly explained by different star formation histories (SFHs). Antoniou et al. (2010) find that the locations of SMC BeXRBs correlate with stellar populations of ages 25–60 Myr. Despite large spatial variations, the most recent episodes of enhanced star formation activity in the LMC occurred 12 Myr and 100 Myr ago (Harris & Zaritsky 2009). This is different from the time at which most Be stars develop their equatorial discs, which was found to peak at Myr (McSwain & Gies 2005). However, the X-ray coverage of the LMC is still not as complete as for the SMC, precluding early interpretations on the role of different SFHs. The situation will improve in upcoming years, with the completion of an XMM-Newton survey, homogeneously covering the 4.5° 4.5° central region of the LMC (Haberl et al., in prep.). Even though no single-epoch survey can reveal the complete population of transient BeXRBs, we are likely to detect many new systems.
In this work we present the discovery of a new member of the BeXRB population of the LMC, recently identified in our survey with XMM-Newton. The X-ray observations and results are described in Sect. 2. The analysis of the optical companion is presented in Sect. 3. The system presents unusual and very interesting properties, which we analyse and discuss in Sects. 4 & 5. Our findings are then summarised in Sect. 6.
2 X-ray analysis
2.1 XMM-Newton observations and data reduction
In the course of the ongoing XMM-Newton survey of the LMC, we discovered a bright source in an observation (ObsId 0690742501, hereafter XMM1) carried out on 2012 July 13. In a later observation (ObsId 0690742401, hereafter XMM2) on 2012 September 9, the source was again detected. The European Photon Imaging Camera (EPIC), comprising a pn CCD imaging camera (Strüder et al. 2001) and two MOS CCD imaging cameras (Turner et al. 2001), was used as the primary instrument. Both observations were performed using the same instrumental setting: the cameras were operated in full-frame mode, with the thin and medium optical filter for pn and MOS cameras, respectively. We used the XMM SAS 222Science Analysis Software, http://xmm.esac.esa.int/sas/ version 11.0.1 for the data reduction. In observation XMM1, the source had a 0.2–12 keV EPIC-pn count rate of cts s-1 (background-subtracted and corrected for vignetting and the finite point spread function), while it was fainter in the second observation ( cts s-1).
The first observation was affected by a high background. The useful exposure time for the pn detector was only 5.8 ks. Because the source is bright, the effect of the background is less important, and we increased the pn rate threshold for background filtering to improve the photon statistics of the spectra and time series. Instead of the standard thresholds of 8 cts ks-1 arcmin-2 (in the 7–15 keV band), which we apply to image analyses, we used a higher value of 50 cts ks-1 arcmin-2. Doing so, we reached an useful exposure time of 19 ks. The MOS cameras were less affected and we used a 7–15 keV rate threshold for background filtering of 2.5 cts ks-1 arcmin-2, which yielded 20 ks of useful exposure times. Observation XMM2 was less contaminated by solar flares. Using rate thresholds of 8 and 2.5 cts ks-1 arcmin-2 for pn and MOS yielded exposure times in excess of 26 ks. In Table 1 we list the details of all the X-ray observations.
2.2 XMM-Newton timing analysis
We produced time series (barycentre corrected) for observations XMM1 and XMM2. For the timing analysis we used the merged time series, combining pn and MOS data across the 0.3–10 keV range in common Good Times Intervals. The power spectrum density of observation XMM1 (shown in Fig. 1) prominently peaks at Hz. The second and third harmonics are detected as well.
We used the Bayesian periodic signal detection method described in Gregory & Loredo (1996) to determine the pulse period with a uncertainty. For observation XMM1 we found s. During the XMM2 observation we measured s. The time series from observation XMM2 contained less events (1918) than the time series of observation XMM1 (13329 events), when the source was brighter, and this explains the (purely statistical) larger uncertainty measured in the second observation. Within the uncertainties, no variation of is detected.
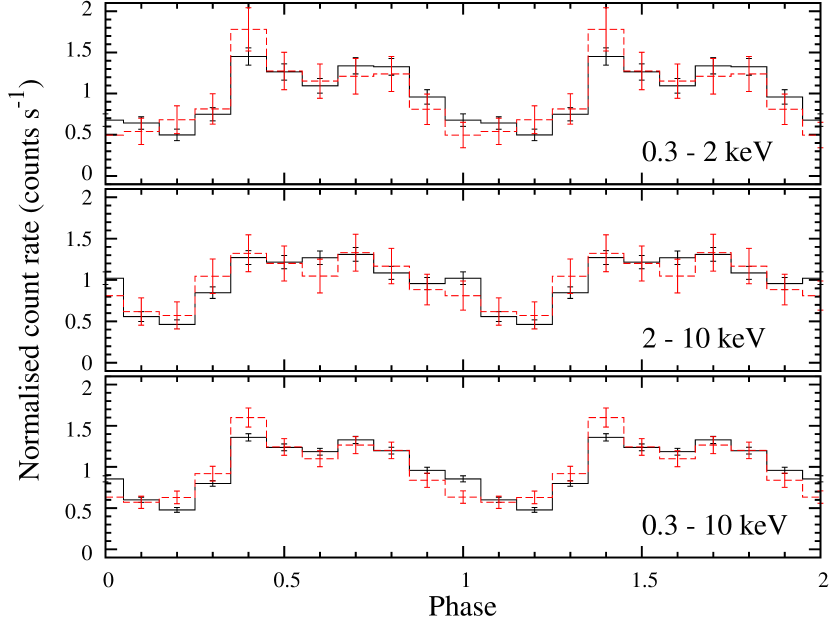
In Fig. 2, we show the background-corrected X-ray pulse profiles folded to the period measured from observation XMM1 (having lower statistical uncertainty). Within the error bars, no significant profile differences are seen between observation XMM1 and XMM2. In the broad 0.3–10 keV band we estimate pulse fractions of 39.72.2 per cent and 38.9 per cent in the XMM1 and XMM2 datasets, respectively, assuming a sinusoidal pulse profile. Thus, the pulse fraction shows no variability between the two epochs.
In line with the detection of pulsations and due to the confusion in the ROSAT nomenclature (see Sect. 2.5), we propose LXP 169 as the identifier for this source. The acronym “LXP” stands for “Large Magellanic Cloud X-ray Pulsar” and the following number indicates the spin period of the system to three significant figures. We thereby follow the notation of Coe et al. (2005) who used “SXP” for X-ray pulsars in the SMC. In the remainder of the paper we refer to the source as LXP 169.

2.3 X-ray position
The statistical uncertainty in the position of LXP 169 for observation XMM1 and XMM2 is ″ and 0.24″, respectively, to which a systematic uncertainty , accounting for the uncertainty in the spacecraft pointing, should be added. is typically in the range 1″–2″ (Watson et al. 2009) but can be improved to ″ by correlating the X-ray sources detected in an observation with optical counterparts having a better astrometry. As finding the true optical counterpart is crucial, it is definitely worthwhile to improve the precision of the X-ray position.
In the field of view of our two observations there were no bright, previously known sources to use. Instead, we correlated the catalogue of mid-infrared-selected active galactic nucleii (AGN) candidates from Kozłowski & Kochanek (2009) with our X-ray detection lists. While these sources have not yet been spectroscopically confirmed (only a fraction of them have been already observed, see Kozłowski et al. 2012) and risks of contamination exist, we checked that the hardness ratios of the X-ray sources with a mid-IR counterpart were consistent with an AGN nature. Note that Kozłowski et al. (2012) showed that the false positive rate is significantly reduced in the presence of an X-ray source. The positions in the catalogue of Kozłowski & Kochanek (2009) are from the Spitzer survey of the LMC (Meixner et al. 2006), matched to the 2MASS catalogue, which have a typical uncertainty of 0.3″ (1). We used 0.8″ as a systematic uncertainty in the corrected positions to take this into account.
We identified three and seven X-ray source /ṁid-IR AGN candidate associations in observations XMM1 and XMM2, respectively, which we used to compute the average right ascension and declination offsets. The total linear shifts are 2.4″ and 2.3″. The corrected X-ray positions of LXP 169 are listed in Table 2.
2.4 Spectral analysis
We extracted energy spectra from observations XMM1 and XMM2 for all three cameras. Source and background spectra were taken from circles with radii of 22.5″ and 42.5″, respectively. Single and double-pixel events (PATTERN = 0 to 4) from the pn detector were used and all single to quadruple-pixel (PATTERN = 0 to 12) events from the MOS detectors were used. We rebinned the spectra with a minimum of 20 counts per bin in order to allow the use of the -statistic. The spectral analysis was performed with XSPEC (Arnaud 1996) version 12.7.0u.
We fitted the EPIC spectra in the 0.3–10 keV range with an absorbed power law. Two photoelectric absorption components were used, one with solar abundances (according to the table of Wilms et al. 2000) and a fixed column density N for the Galactic foreground absorption (Dickey & Lockman 1990), and another one with a free N for the LMC. Metal abundances for the latter were fixed to the average metallicity in the LMC (i.e. half their solar values, Russell & Dopita 1992).
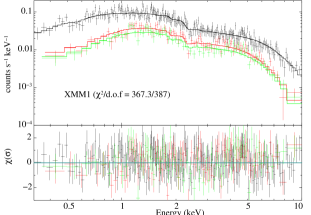
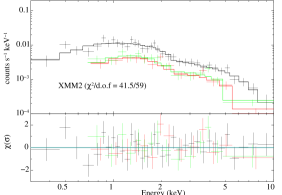
Spectra from the three EPIC cameras were fitted simultaneously and we included cross-calibration factors for the MOS data ( and ). The absorbed power law provided satisfactory fits, as seen from the and residuals (spectra are shown in Fig. 3). No additional component, such as a black-body one, was needed. The best-fit parameter values are given in Table 2, along with the derived fluxes and luminosities. Bad pixels and bad columns in the extraction regions explain the behaviour of and . In XMM2, the source was partially located on a pn CCD gap, resulting in % higher and . Consequently, the flux quoted for the second observation comes from MOS data.
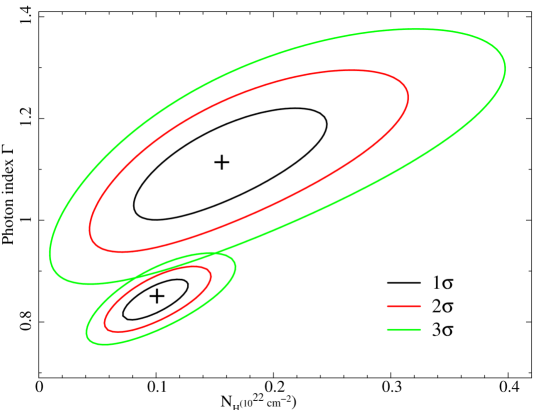
We show the confidence regions in the – NH plane for observations XMM1 and XMM2 in Fig. 4. The spectrum is harder in the first observation, when the source was about six times brighter. The column density is poorly constrained in the (softer and fainter) second observation, precluding a comparison of NH between the two epochs. We note that the anticorrelation of the spectral index and the X-ray flux (that is, the brighter the source, the harder the spectrum) has been observed in other high-mass (likely Be/) X-ray binary pulsars in outburst (e.g. Baykal et al. 2002; Inam et al. 2009). This behaviour is consistent with the source being in the so-called “horizontal branch” (as defined by Reig 2008; Reig & Nespoli 2012), traced by BeXRBs in the hardness-intensity diagram during giant outbursts, as long as they are below a critical luminosity.
| Parameter | XMM1 | XMM2 |
|---|---|---|
| RA (J2000) | 05h 07m 55.38s | 05h 07m 55.25s |
| DEC (J2000) | 68° 25m 04.6s | 68° 25m 06.0s |
| (s) | ||
| N () | 9.84 | 15.4 |
| Photon index | 0.84 | 1.11 |
| 1.06 | 1.17 | |
| 0.95 | 1.22 | |
| d.o.f | 367.3 / 387 | 41.5 / 59 |
| FX ( erg cm-2 s-1) | 35.9 | 5.9 |
| LX ( erg s-1) | 11.2 | 1.8 |
2.5 ROSAT observations
The catalogue of ROSAT PSPC sources in the LMC (Haberl & Pietsch 1999) includes [HP99] 659, for which the error circle contains LXP 169. The second ROSAT PSPC catalogue has two detections whose positions are consistent with LXP 169 (2RXP J050754.4-682457 and 2RXP J050756.5-682452). We searched the ROSAT archive for all observations where LXP 169 was located in the field of view, at an off-axis angle smaller than 45′. We found three such pointings. In two of them (rp500037 and rp300129, those used for the catalogue entries given above), the source was detected with count rates of and cts s-1, respectively. This translates into a 0.3–10 keV flux of (4.0 – 10.2) erg cm-2 s-1, assuming the same spectral parameters as measured in observation XMM1, which have better statistics. In the shallower observation rp500060, the source was not detected. We used the ximage tool uplimit to estimate a upper limit for the intensity of cts s-1, corresponding to a 0.3–10 keV flux level erg cm-2 s-1. ROSAT observations and results are summarised in Table 1.
3 The optical counterpart
3.1 Identification
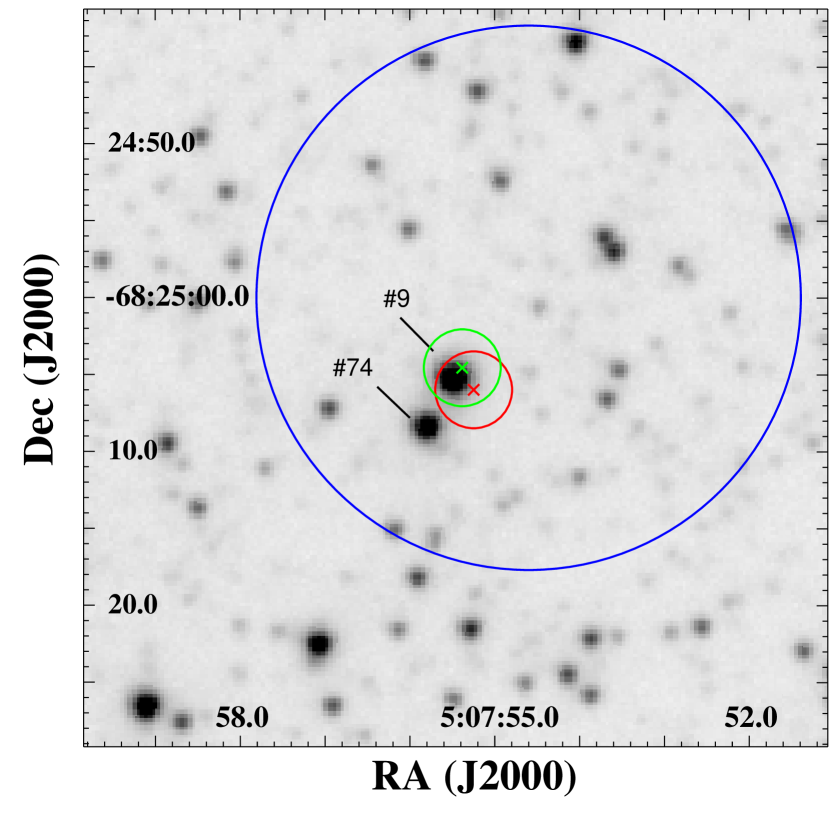
The much better astrometrical accuracy of XMM-Newton compared to ROSAT allows us to identify the optical counterpart. We searched for an optical counterpart to the X-ray source in the catalogue from the Optical Gravitational Lensing Experiment (OGLE) III survey (using a telescope based at Las Campanas, Chile, see Udalski et al. 2008a), whose positions have also been matched to 2MASS. As maximum separation between X-ray and optical positions, we take the uncertainty ″ for both observations XMM1 and XMM2, as the systematic uncertainty dominates over the statistical one. We found two candidates near the X-ray position (see finding chart in Fig. 5). In the OGLE-III nomenclature, these stars are lmc.118.4.46009 and lmc.118.4.46074, which we hereafter refer to as “OGLE 9” and “OGLE 74”, for short. OGLE 9 is the nearer source, being 0.8″ and 1.4″ away from the X-ray positions measured in observations XMM1 and XMM2. i.e. within the error circle. It corresponds to the source 2MASS J05075546-6825052 (Skrutskie et al. 2006). The separations with OGLE 74 are significantly larger (4.4″ and 3.8″), suggesting OGLE 9 is the true counterpart to LXP 169.
Because we expect the optical counterpart to be an early-type star, most probably a Be type star, we can secure the association of LXP 169 with OGLE 9, even in the absence of spectroscopic observations, by studying the optical and near-infrared (NIR) photometry, colour, and variability of OGLE 9. In Table 3, we list the optical photometry of the two candidates, using the Magellanic Clouds Photometric Survey (MCPS, Zaritsky et al. 2004) and OGLE-III, and the NIR magnitudes from the 2MASS and DENIS catalogue. We also include the ultraviolet UVW1 magnitude measured with Swift (see Sect. 4.1). The USNO-B1 catalogue only includes one source located between the two candidates, showing that due to confusion one cannot use these magnitudes.
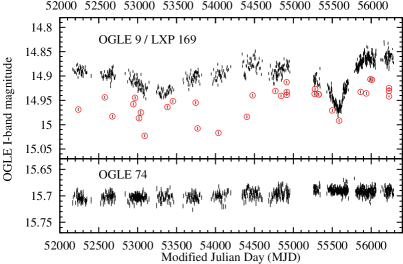
The reddening-free -parameter is -1.049 mag and 0.748 mag for OGLE 9 and 74, respectively. It is derived from MCPS photometry, which might have been measured non-simultaneously. Although this is not ideal when we expect variability, it shows that OGLE 9 is of a much earlier spectral type than OGLE 74. The optical and NIR colours of OGLE 9 ( mag and mag) are typical of a Be star (e.g. Coe et al. 2005), whereas OGLE 74 appears as a red giant. Finally, OGLE 9 exhibits a strong optical long-term variability (see Fig. 6, left; details of the light curve are discussed in Sect. 3.3) that is typical of the optical counterpart to a BeXRB, whereas OGLE 74 does not show any significant variability.
Based on all evidence available (position, photometry, variability), OGLE 9 appears as a typical counterpart to a Be/X-ray binary system. We conclude it is the true counterpart to LXP 169. Spectroscopic observations would enable us to definitely confirm the emission-line star nature of the counterpart and determine its spectral type.
| Band | Magnitude | Catalogue | Ref. | |
| OGLE 9 | OGLE 74 | |||
| U | 14.0180.080 | 20.3170.175 | MCPS | 1 |
| B | 15.0160.022 | 18.5130.061 | MCPS | 1 |
| V | 14.9450.026 | 17.0460.035 | MCPS | 1 |
| V | 15.1060.017 | 17.0970.011 | OGLE-III | 2 |
| I | 14.8940.038 | 15.6720.186 | MCPS | 1 |
| I | 14.9060.023 | 15.7020.007 | OGLE-III | 2 |
| I | 14.7830.04 | — | DENIS | 3 |
| J | 14.7700.039 | 14.6370.069 | 2MASS | 4 |
| K | 14.3540.080 | 13.6960.054 | 2MASS | 4 |
| Band | OGLE 9 | Instrument | Ref. | |
| UVW1 | 14.940.03 | Swift/UVOT | 5 | |
| g’ | 14.800.05 | GROND | 5 | |
| r’ | 15.020.04 | GROND | 5 | |
| i’ | 15.210.04 | GROND | 5 | |
| z’ | 15.420.04 | GROND | 5 | |
| J | 15.720.06 | GROND | 5 | |
| H | 16.010.07 | GROND | 5 | |
| K | 16.410.09 | GROND | 5 | |
3.2 GROND photometry
We observed OGLE 9 on 2012 October 1 in 33 consecutive four minute observations with the Gamma-Ray Burst Optical/Near-Infrared Detector (GROND) instrument, mounted on the ESO/MPG 2.2-m telescope in La Silla, Chile. GROND performs simultaneous imaging in seven filter bands, from visual (g′r′i′z′ filters) to near-infrafred (NIR, JHK filters). Technical details on the instrument and its operations are presented in Greiner et al. (2008).
The data were reduced and analysed with the standard tools and methods described in Krühler et al. (2008). The g′, r′, i′, and z′ photometric calibration was obtained relative to a standard star calibrated observation of the field taken on 2012 December 6. The J, H, and Ks photometry was calibrated against selected 2MASS stars (Skrutskie et al. 2006). During the 2012 October 1 monitoring, the source remained constant and the resulting magnitudes are presented in Table 3.
To deredden the optical observations, we used the extinction curve given by Pei (1992), which can be used for both the Milky Way and the LMC. The foreground Galactic reddening was set to mag, or mag, using the map of Schwering & Israel (1991). Converting N into extinction, using the correlation from Predehl & Schmitt (1995), yields a similar value ( mag). The intrinsic LMC reddening is much harder to estimate: although the LMC is seen at a moderate inclination angle and is only 1.7 kpc thick (e.g. Haschke et al. 2012), LXP 169 could be in front, within, or behind the LMC disc. The MCPS reddening estimator555http://djuma.as.arizona.edu/~dennis/lmcext.html gives an average extinction of mag, using all the hot stars within 5′ of LXP 169, but the scatter is large (standard deviation of 0.42 mag). However, we adopted this value, as it is consistent with the best-fit N of observation XMM1 which gives mag. As a lower limit we assumed no LMC extinction. For the upper limit we converted the total LMC NH measured from H I observations (Kim et al. 2003) at the position of LXP 169 () into mag, taking into account the half-solar metallicity of the LMC.
3.3 OGLE light curve
Combining phase III and IV of the OGLE program, one gets accurate photometry of the optical counterpart to LXP 169, for a period of time longer than 4000 d on an almost daily basis (Fig. 6, left, top panel). The light curve is characterised by brightness changes as large as 0.15 mag, typical of the long term behaviour of Be stars (Sabogal et al. 2005).
We also make use of the OGLE -band observations to study the colour variability of LXP 169. In phase IV of the OGLE program there are 106 simultaneous (i.e. taken the same night) and measurements, which were used to produce an vs. - colour-magnitude diagram (CMD, Fig. 6, right). Correction for colour terms was performed as described in Udalski et al. (2008b). Strikingly, the star follows a loop-like track in the CMD, and the loop is traversed in a clock-wise sense. This was found to be a rather ubiquitous property of classical Be stars (at least in the SMC) by de Wit et al. (2006). These authors showed that this bi-valued colour-magnitude relation can be explained by the presence of an outflowing circumstellar disc and a variable mass-loss rate of the central star. The loop-like track in the CMD is yet another (strong) evidence that the companion is indeed a classical Be star. The detection of an infrared excess with GROND, as presented in Sect. 5.1, is consistent with that picture.
The most intriguing feature of the light curve is the presence of drops in brightness, appearing at all epochs. These dips are short, as they are usually seen in only one OGLE datum point at a time (see discussion in Sect. 5.2.2), and are up to 0.1 mag deep.
We empirically searched for a periodicity by assuming the interval between the first and last clear dips (at MJD 52238.25 and 55936.15) to be an integer number multiple of a period . We varied until all dips occurred at their predicted time. We obtained a satisfactory result for , corresponding to a tentative period of d. We can get a first estimate of the error on the period by noting that when using or 153, many dips were not matching the predicted occurrence time. This gives a conservative error for this tentative period of 0.16 d.
These periodic events would naturally be explained if the binary system is seen at high inclination angle. One then expects to observe eclipses (or better here, transits, as the flux does not fall to zero) separated in time by an interval reflecting the orbital period of the system. We present detailed observations of two recent transits in Sect. 4. Note that in the remainder of the text we will use both the terms “eclipse” and “transit”.
4 Dedicated observations of two recent transits
4.1 Transits in UV and -band
To study LXP 169 and its enigmatic eclipses, we increased the observing frequency of the system in the OGLE-IV project. When possible, it was followed at least once per night throughout all the orbital period, and even more often the nights of the predicted eclipses. Then, we requested observations with the Swift observatory. This enables us to measure the visual (OGLE-IV) and UV magnitudes (using the Swift UV/Optical Telescope, UVOT) of the counterpart, while simultaneously monitoring possible X-ray emission from the neutron star (with the X-Ray Telescope, XRT, see Sect. 4.2).
For the UVOT filter we asked UVW1, firstly because no UV magnitude of the system existed in the literature, and secondly, because contribution from the circumstellar disc around the Be star should be minimal in the UV compared to the -band. We can therefore check if the star itself is eclipsed. In addition, contaminating light from the close neighbour (in projection) OGLE 74 might in principle fall within the UVOT aperture, but since it appears to be a red giant, its UVW1 magnitude is at least a factor of 7 or 8 fainter than LXP 169. It should therefore contribute only by a negligible amount.
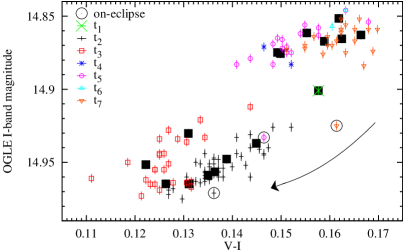
We were awarded 8.1 ks of Swift observing time, half of it around the predicted eclipse time MJD 56203.76, as determined using d (see Sect. 3.3). The other 4 ks were distributed before and after the eclipse, allowing a measurement of the “out-of-eclipse” UV magnitude. We used the HEASoft task UVOTMAGHIST to derive flux densities from all UVOT exposures. The UVW1 light curve of this observation is shown in the top panel of Fig. 7, between MJD 56202 and MJD 56211.
A clear dip is seen at MJD 56203.877 in five UVOT exposures. These “on-eclipse” observations span only 15 minutes in total and we cannot find any variability amongst them given the flux uncertainties. Nonetheless, we conclude that Swift successfully observed an eclipse of the optical counterpart. Simultaneous observations of this eclipse with the OGLE telescope were not possible as it occurred during Chilean daytime. The -band magnitude measured the nights before and after this eclipse are shown in the lower left panel of Fig. 7. A conservative duration limit of 1.13 day for this transit is set by the last Swift measurements before and after the transit. We discuss the transit duration in more details in Sect. 5.2.2.
With the constraint on the duration of the transit and the d long baseline of the OGLE monitoring, we could improve the period estimate to d. We propose an ephemeris for the transit of:
| (1) |
We obtained a second set of observations with Swift around the time of the predicted next transit (MJD 56228.206), using the same instrumental setting as the first time. We also planned simultaneous optical follow-up from the ground, using the OGLE telescope and the GROND instrument. Much to our dismay, thick clouds covered almost all of northern Chile the night of the eclipse (and the night before). While no image at all could be taken with GROND, the OGLE telescope managed to take three images through holes in the clouds (at MJD 56228.18, see Fig. 7). Compared to previous and subsequent measurements, the magnitude was 0.07 mag fainter the night of the predicted transit, i.e. much larger than the typical photometric accuracy of the OGLE survey (0.003 mag). In these three observations the magnitude was declining, suggesting that we partially resolved the transit’s ingress in .
Although we had quasi-simultaneous observations with Swift/UVOT, we did not detect a transit as sharp and significant in UV as one orbit earlier. However the UVW1 flux density was % fainter than the “out-of-eclipse” level measured in the first dataset. The observations around MJD 53228.206 span 1.8 d in total. A shallower and longer transit could still explain these results (see Sect. 5.2.2).
4.2 Simultaneous X-ray monitoring
The XRT did not detect LXP 169 in the first set of Swift observations, around MJD 56203 (Table 1 gives observation details). We estimated upper limits of 3 to 8 erg cm-2 s-1 for the 0.3–10 keV fluxes in the various exposures, using the same method as used in Sect. 2.5.
In the second data set (around MJD 56228), however, we detected the X-ray source in all the XRT observations. We measured the count rates and translated them into 0.3–10 keV fluxes, assuming the spectral parameters found in observation XMM1 (the uncertainties in the count rate dominate over the uncertainties in the spectral parameters). We found fluxes ranging from 8 to 11 erg cm-2 s-1. We cannot assess the short-term variability of the X-ray emission throughout the transit, given the large uncertainties associated to the flux measurement in such short XRT observations.
5 Results and discussion
5.1 Spectral energy distribution
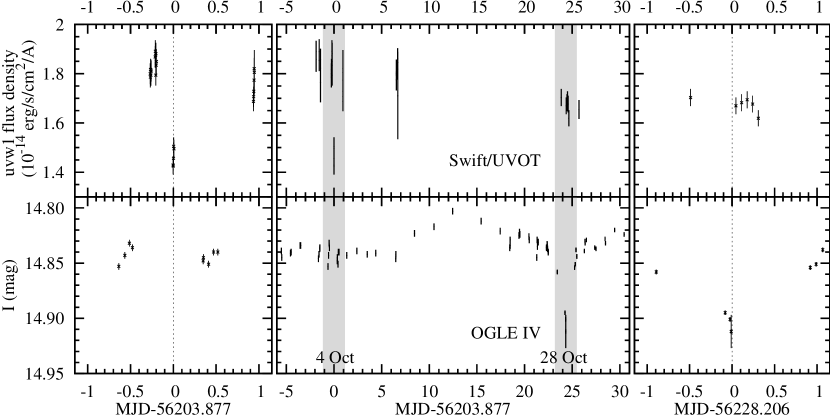
The spectral energy distributions (SEDs) of OBe stars have two components (e.g. Waters et al. 1988; Dougherty et al. 1994): a hot stellar atmosphere with an effective temperature depending on the spectral type (in the range 18 000 K – 38 000 K), and an infrared (IR) excess produced in a dense equatorial disc (from which emission lines are also emitted). The presence of such a disc is supported by the colour-magnitude variability (Sect. 3.3). Because we have the photometry of the optical companion from NIR to UV, we can study its SED and look for an IR excess. As Be stars are intrisically variable, their SED should be constructed from observations taken (quasi-)simultaneously. For this reason, values from MCPS observations were not included. Instead we took advantage of the broad-band coverage of the GROND photometry, supplemented by the UV data from Swift (described in Sect. 4.1), obtained less than two days later.
The dereddened flux densities are shown in Fig. 8. We used the TLUSTY grid of stellar atmosphere models (Lanz & Hubeny 2003, 2007, for O and B spectral types, respectively) to reproduce the observed photometry. The model normalisations were set by the ratio of the radius of the star to the distance, for which we took 50 kpc. Depending on the adopted LMC extinction, temperatures from 18 000 to 45 000 K and radii in the range 8–12 were required to yield a good agreement of the model with the data from the UVW1 band to the z’ band. In any case, the JHK bands show a moderate but significant excess, providing strong evidence that the companion is, indeed, an OBe-type star.
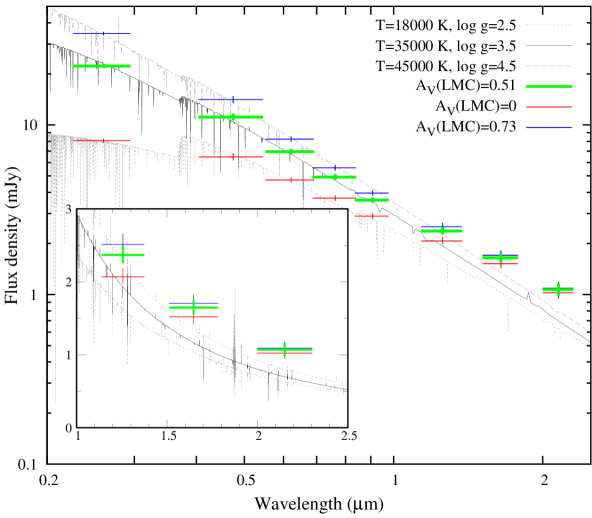
In the case with no LMC absorption, the required temperature would suggest a spectral type B3 (for luminosity class V, Panagia 1973), which is somewhat too late for a typical BeXRB. The spectral types of the companions in LMC BeXRBs are in the range O9–B2 (Negueruela & Coe 2002), though the sample is small compared to the SMC one, where the distribution extend up to O5 and down to B9 (Coe et al. 2005). A contrario, in the case with a high LMC extinction, an effective temperature of 45 000 K would require an O5V type (Vacca et al. 1996), which is then too early (with the previous caveats). For the adopted value of , the effective temperature (35 000 K) indicates an O9V-O9.5V type, suitable for a BeXRB. In addition, the predicted -band magnitude in this case (Vacca et al. 1996) is the only one to reproduce the observed value. However, only future spectroscopic observations will confirm the spectral type.
5.2 An eclipsing Be/X-ray binary
The association of the variable X-ray source LXP 169, exhibiting pulsations and a hard spectrum, with the optical counterpart OGLE-III lmc.118.4.46009, a highly variable early-type star with a near-infrared excess produced in an outflowing circumstellar disc, leads us to the conclusion that this system is a BeXRB. It is the 15th member of the BeXRB LMC population.
What makes this system especially interesting is the eclipsing light curve of the optical counterpart. We now discuss a scenario in which the compact object transiting in front of its companion causes the features observed in the light curve of the normal star. We make use of two strong observational results, namely the depth of the transit seen in UV, and the orbital period , which is well constrained to d. In addition, the X-ray pulsations detected with XMM-Newton are the spectral fingerprints of a neutron star, so we can assume the canonical value of 1.4 as the mass of the compact object . Other orbital parameters, such as the inclination , eccentricity , and longitude of periastron are unknown, although must be rather close to 90° for transits to be observable, and is usually between 0.3 and 0.9 for BeXRBs (Townsend et al. 2011).
5.2.1 Size of the eclipsing object
Because of its very small size (radius of 10 km), it is obvious that a neutron star will not cause any detectable change in the light curve of a B-type star when passing in front of it. In this case however, the neutron star orbits around a star having a dense and slow equatorial outflow. The intense gravitational field of the neutron star can capture matter up to a radius much larger than its own surface or magnetospheric radius. The highly enhanced density in this extended region can block light from the normal star as the neutron star transits in front of it.
Much like in the case of a transiting exoplanet, it is possible to derive the size of the eclipsing body from the depth of the dip in the light curve during transit, using:
| (2) |
where is the flux of the normal star, is the change in flux during transit, and and are the radii of the eclipsing object and companion, respectively. Equation 2 is formally only valid for completely opaque objects, but can be used to a good approximation if the eclipses are caused by a region of large optical depth. It is also assumed here that the two objects are spherical, but more generally the change in flux is a measure of the fraction of the eclipsed object area covered by the eclipsing object. We therefore have the opportunity to measure in terms of the companion star’s radius, using . The NIR emission of the companion is contaminated / dominated by contributions from the equatorial decretion disc, whereas the UV flux should come only from the stellar surface. Therefore Eq. 2 should be applied using the dip observed with Swift/UVOT on MJD 56203.877, i.e. . This value might be larger because we have not covered a full transit yet. Until then, and also because of the finite optical depth, we can use as a lower limit. Using a radius suitable for a non-supergiant Be star, for instance means .
The observed transit depth also rules out the possibility that LXP 169 is a triple system, with the eclipsing object being either a planet, a brown dwarf, or even Sun-like star. The two formers would cause an undetectable change in flux of per cent, and the latter a mere 1 per cent.
The incomplete knowledge of the depth of the transit and of the size of the companion results in large uncertainties in the determination of . Nevertheless, we can perform order-of-magnitude calculations to see if such a large eclipsing region of dense material around the neutron star can be formed. We consider the Bondi-Hoyle-Lyttleton accretion process (first developed by Hoyle & Lyttleton 1939; Bondi & Hoyle 1944; Bondi 1952): a neutron star, going through the Be-star outflow (with density ) at the relative velocity , can capture matter within the capture radius given by (Ghosh 2007):
| (3) |
In the simplest case of a circular (or low-eccentricity) orbit, , with and the orbital and radial outflow (“wind”) velocities, respectively. Then we have:
| (4) |
where is the mass of the companion and the semi-major axis of the binary. Using Kepler’s third law and defining we have
| (5) |
and therefore
| (6) |
| (7) |
Combining Eqs. 3 & 7 with the appropriate scaling factors, one obtains:
| (8) |
For the wind velocity we use (Waters et al. 1988), where is the initial velocity at the stellar surface (). It is clear that the uncertainty in estimating is dominated by our poor knowledge of the wind velocity structure and of the mass of the companion. We used km s-1 and (van Kerkwijk et al. 1995) and assumed a companion mass of 10 , yielding and 15 km s-1. Under these crude assumptions we get . This is smaller than the Roche lobe radius of the neutron star for (from Eq. 5 and the approximation of Eggleton 1983), which is the maximal radius up to which the neutron star can capture matter. Note that is in turn an upper limit for , as the size of the eclipsing object depends on the way the captured matter evolves around and is accreted onto the neutron star.
The exact effect of a significant eccentricity is difficult to assess: the neutron star would reach faster orbital velocity closer to the Be star, where is slower. Although would become strongly orbital-phase-dependent, it should remain roughly in the same range as in the case of a circular orbit.
We also consider, instead of an outflowing wind disc scenario à la Waters et al. (1988), a viscously driven decretion disc, which can explain most of the observations of Be star discs (Lee et al. 1991; Porter 1999, and references therein). Equation 8 does not apply in such a case, because the orbital velocity of the neutron star matches that of the (quasi-)Keplerian disc. This leads to slow relative velocities (the radial drift velocities in viscous discs are less than a few km s-1) and therefore high values of in the Bondi-Hoyle-Lyttleton formalism. In that case the Roche lobe radius of the neutron star is most likely the upper limit for the size of the eclipsing object.
The analysis above shows that, at least to a first order, it is possible that the transits observed in the light curve of the companion star are caused by the matter captured by the orbiting neutron star.
5.2.2 Transit duration
The transit duration is another proxy for the size of the eclipsing object. It depends in a complex manner on the orbital parameters (particularly , , and ), most of which are yet unknown. In the simple case of a circular orbit, the duration of transit is
| (9) |
If we further assume that we can neglect . Then, assuming , (Sect. 5.2.1), and , Eqs. 5 & 9 give d, which is slightly longer than the upper limit of 1.13 d found in Sect. 4.1.
This discrepancy can easily be reconciled by using various reasonable values for , , , or adding eccentricity (expected in the case of BeXRB, Townsend et al. 2011). For instance, only changing in the range 0.25–0.5 (leaving other parameters unchanged and using ), yields transit durations ranging from 1.13 d to 0.85 d). However, there is a high level of degeneracy between all the parameters and one would first need to measure some of them (e.g. by spectroscopy, and by radial velocity/light curve modelling) before being able to obtain from the transit duration.
Due to the detection of several consecutive transits in the OGLE light curve, which has a sampling period of typically one day or more, we can estimate the duration of the transit in the -band. Were these significantly shorter than a day, one could not easily detect two transits separated by 24.329 d from the same location (here, Chile), simply because the next one would occur during daytime. OGLE observations on MJD 54914.03, 54914.99, and 54915.09, showing the star eclipsed (0.06 mag depth) in two consecutive nights, confirm that day-long -band transits do exist. The absence of transits seen in three consecutive nights suggest that two days is a reasonable upper limit for the transit duration in the near-infrared.
We stress, however, that the transit durations are likely to be variable. Indeed, due to the Be-star activity, the circumstellar disc can grow or shrink, or even present asymmetries (e.g. Okazaki 1991), changing the starting and/or ending point of the transit and resulting in different durations, in particular in the near-infrared. Asymmetric transits do exist, as exemplified by OGLE-III -band observations around the transits predicted on MJD 55279.375 and MJD 55328.033 (using Eq. 1): 0.03 mag deep transits were detected, starting six and five days earlier than expected, but not extending after the predicted times. Changes in the velocity and density structure of the disc would cause the size of the eclipsing object to vary (as the accretion radius and rate would be affected), resulting in a shorter or longer transit duration in the UV as well.
5.2.3 Comparison to other eclipsing X-ray binaries
Although a few other eclipsing X-ray pulsar binaries are known (eleven at the time of the writing, Mason et al. 2012), they are all supergiant X-ray binaries (SGXBs) or low-mass X-ray binaries, in which the compact object is eclipsed by the mass donor. LXP 169 would be the first confirmed eclipsing BeXRB.
Furthermore, we see transits/eclipses of the optical counterpart and not from the X-ray source, as is the case in known eclipsing SGXBs. Such X-ray eclipses are likely to be also present in LXP 169. However, due to i) the transient nature of the X-ray emission in this system; ii) the wider, most likely eccentric orbit; and iii) the absence of an orbital solution, observing an eclipse in X-ray might prove to be an arduous task.
A similar system is possibly XMMU J010743.1-715933 in the SMC (Coe et al. 2012). The light curve of the optical counterpart (their Fig. 15) folded to the 100.3 d orbital period of the system reveals eclipse-like features of 0.1 mag depth (). Also intriguing is the fact that these transits are followed by optical outbursts. These features are not explained in Coe et al. (2012), although they remark the similarity with other transiting eclipsing binaries in the LMC (Graczyk et al. 2011), for which variations of eclipse features are explained by regression of the nodes of the orbital plane due to the presence of a third body in the system.
5.3 X-ray variability
The X-ray luminosity of LXP 169 in the available observations (up to erg s-1) suggests we see Type I outbursts, when the neutron star is at or near periastron. Because the major axis of the orbit does not have to be aligned with our line-of-sight, there is no reason for the periastron passage and transit to be simultaneous. The highest X-ray flux observed so far ( erg cm-2 s-1) is reached in the observation XMM1, taken at an orbital phase . A flux about six times lower is measured in observation XMM2, at a phase 0.98–0.99.
ROSAT has a much lower effective area and therefore lower accuracy in the determination of a flux in the to erg cm-2 s-1 range. The three available ROSAT observations have been done at similar epochs and span orbital phases of 0.43 to 0.66, during which the flux varied between erg cm-2 s-1 and a non-detection, with an upper limit of erg cm-2 s-1.
Also Swift/XRT only provides rough estimates of the X-ray flux because of the short exposure times. While the source was not detected around the transit on MJD 56203.877 (the flux was always lower than erg cm-2 s-1), observations during the next transit detected the source at a roughly constant level of 8 to 11 erg cm-2 s-1, i.e. consistent with the flux measured in observation XMM2, which was performed at a similar orbital phase.
The variability factor is at least 10 but is poorly constrained due to the absence of high-sensitivity and/or deep observations during “quiescence”. Monitoring the X-ray emission during several orbits, across all phases, will allow us to learn more about the X-ray cycle, such as the phase of the outbursts onset and their durations. We can also look for a Type II (i.e. longer and brighter) outburst, in which case an X-ray eclipse would be easier to find.
5.4 Future observations
The detection of transits in the light curve of the optical counterpart gives us the unique opportunity to estimate the size and structure of both the matter captured by the neutron star and the equatorial disc around the Be-star companion. To do this one needs to cover the transit from NIR to UV wavelengths, measuring the time of ingress/egress and the transit duration across a broad spectral domain. If the eclipsing object is indeed completely opaque, the I-band transit durations are expected to be longer than UV transits, because the neutron star will first cover one side of the circumstellar disc before passing in front of the star itself. It will then cover the other side of the disc. If, on the other hand, transits from UV to NIR have similar durations, it would mean the eclipsing object has a high but finite optical depth. The latter could be estimated by measuring colour changes across a transit.
We already attempted such simultaneous observations using Swift, GROND, and OGLE during the transit on MJD 56228.18, but bad weather conditions prevented us from covering the transit (Sect. 4.1). The relative short orbital period of 24.329 d means we can repeat these attempts more regularly than for longer period systems, such as XMMU J010743.1-715933 (see Sect. 5.2.3), having a period of 100.3 d.
Optical spectroscopy will provide us with a lot of valuable information. Firstly, one can confirm the emission-line nature of the companion (as expected from the observed NIR excess and variability). Secondly, the resulting spectral classification would provide additional constraints on the size of the Be-star. Thirdly, as we know that the orbital plane is highly inclined, we could use the H-line profile to study a possible Be disc/orbital plane misalignment, which have been recently suggested by Okazaki et al. (2012) to explain the two types of X-ray outbursts seen in BeXRBs. If the Be disc were also highly inclined, we expect a double-peaked H line, and the separation between the blue- and redshifted part of the line becomes narrower as the disc is seen from a more polar direction (i.e. as the tilt angle between the orbital plane and the Be disc plane increases). Another proxy for the Be disc inclination could come from the study of brightness and colour variations, as observed in Fig. 6. Haubois et al. (2012) showed that inclination angle is a parameter relevant to the observed photometric variations and in-depth modelling of the system, though beyond the scope of this paper, could result in an estimate for . It is also worth mentionning that phase-resolved spectroscopy might detect the equivalent of a Rossiter-McLaughlin effect in the H-line profile. The main idea is that as the eclipsing neutron star transits in front of the approaching part of the equatorial disc, it covers first the blueshifted peak of the line; then, it passes in front of the receding part of the line and the redshifted peak is masked. This, of course, assumes we see a double-peaked H line out of transit.
Ultimately, the mass of the neutron star could be determined, as the eclipsing nature of the system constrains the inclination angle. This requires to obtain the radial velocity curve of the companion and to measure the pulse arrival time delays at various phases. The observational effort needed is justified by the scarcity of dynamically-determined neutron star masses, even though there are the main constraints on the variety of equations of state available (e.g. Kiziltan et al. 2010). A mass has been derived from only seven out of eleven eclipsing X-ray pulsars (Rawls et al. 2011; Mason et al. 2012).
6 Summary
We discovered a new X-ray pulsar in the LMC, using XMM-Newton observations. The neutron star has a spin period of 168.8 s and we gave the identifier LXP 169 for the source. Its spectrum could be characterised by a power law, which was harder when the flux was higher. The X-ray brightness is variable by a factor of at least 10, as shown by comparison of the XMM-Newton results with archival ROSAT data and subsequent Swift follow-up observations.
Using the XMM-Newton position, we identified the optical counterpart of LXP 169. A strong variability is present in the long-term OGLE light curve of the companion, and its path in the colour-magnitude diagram is typical of a star surrounded by an outflowing circumstellar disc. Observations from UV to NIR wavelengths revealed an NIR excess, which is most likely produced in such a disc. These photometric properties are very strong evidence that the companion is an OBe star. Therefore, LXP 169 is classified as a new BeXRB.
The OGLE light curve suggests that the system is eclipsing. We observed the system with Swift at a predicted eclipse time. The detection of a transit in the UV proved that the companion itself is eclipsed. We determined an ephemeris for the transit times of MJD . We proposed that the orbiting neutron star, and in particular the matter captured from the companion, are responsible for the eclipses. We used the depth and duration of the transit to derive first constraints on the size of the eclipsing object.
We concluded that not only is LXP 169 the first confirmed eclipsing BeXRB, but also that for the first time the companion star in an X-ray binary itself is seen eclipsed by the compact object. We showed how much can be learned from future observations of this important system.
Acknowledgements.
We thank the anonymous referee for fruitful suggestions. The XMM-Newton project is supported by the Bundesministerium für Wirtschaft und Technologie / Deutsches Zentrum für Luft- und Raumfahrt (BMWi/DLR, FKZ 50 OX 0001) and the Max-Planck Society. The OGLE project has received funding from the European Research Council under the European Community’s Seventh Framework Programme (FP7/2007-2013) / ERC grant agreement no. 246678 to A. U. P. M. and R. S. acknowledge support from the BMWi/DLR grants FKZ 50 OR 1201 and FKZ 50 OR 0907, respectively. Part of the funding for GROND (both hardware and staff) was generously granted from the Leibniz-Prize to Prof. G. Hasinger (DFG grant HA 1850/28-1). This research has made use of Aladin, SIMBAD and VizieR, operated at the CDS, Strasbourg, France. We thank the Swift team for accepting and carefully scheduling the target of opportunity observations, and we acknowledge the use of public data from the Swift data archive.References
- Antoniou et al. (2010) Antoniou, V., Zezas, A., Hatzidimitriou, D., & Kalogera, V. 2010, ApJ, 716, L140
- Arnaud (1996) Arnaud, K. A. 1996, in Astronomical Society of the Pacific Conference Series, Vol. 101, Astronomical Data Analysis Software and Systems V, ed. G. H. Jacoby & J. Barnes, 17
- Baykal et al. (2002) Baykal, A., Stark, M. J., & Swank, J. H. 2002, ApJ, 569, 903
- Bondi (1952) Bondi, H. 1952, MNRAS, 112, 195
- Bondi & Hoyle (1944) Bondi, H. & Hoyle, F. 1944, MNRAS, 104, 273
- Coe et al. (2010) Coe, M., Corbets, R. H. D., McGowan, K. E., & McBride, V. A. 2010, in Astronomical Society of the Pacific Conference Series, Vol. 422, High Energy Phenomena in Massive Stars, ed. J. Martí, P. L. Luque-Escamilla, & J. A. Combi, 224
- Coe et al. (2005) Coe, M. J., Edge, W. R. T., Galache, J. L., & McBride, V. A. 2005, MNRAS, 356, 502
- Coe et al. (2012) Coe, M. J., Haberl, F., Sturm, R., et al. 2012, MNRAS, 424, 282
- de Wit et al. (2006) de Wit, W. J., Lamers, H. J. G. L. M., Marquette, J. B., & Beaulieu, J. P. 2006, A&A, 456, 1027
- DENIS Consortium (2005) DENIS Consortium. 2005, VizieR Online Data Catalog, 2263, 0
- Dickey & Lockman (1990) Dickey, J. M. & Lockman, F. J. 1990, ARA&A, 28, 215
- Dougherty et al. (1994) Dougherty, S. M., Waters, L. B. F. M., Burki, G., et al. 1994, A&A, 290, 609
- Eggleton (1983) Eggleton, P. P. 1983, ApJ, 268, 368
- Ghosh (2007) Ghosh, P. 2007, Rotation and Accretion Powered Pulsars (World Scientific Publishing Co)
- Graczyk et al. (2011) Graczyk, D., Soszyński, I., Poleski, R., et al. 2011, Acta Astron., 61, 103
- Gregory & Loredo (1996) Gregory, P. C. & Loredo, T. J. 1996, ApJ, 473, 1059
- Greiner et al. (2008) Greiner, J., Bornemann, W., Clemens, C., et al. 2008, PASP, 120, 405
- Haberl & Pietsch (1999) Haberl, F. & Pietsch, W. 1999, A&AS, 139, 277
- Haberl & Pietsch (2004) Haberl, F. & Pietsch, W. 2004, A&A, 414, 667
- Harris & Zaritsky (2009) Harris, J. & Zaritsky, D. 2009, AJ, 138, 1243
- Haschke et al. (2012) Haschke, R., Grebel, E. K., & Duffau, S. 2012, AJ, 144, 106
- Haubois et al. (2012) Haubois, X., Carciofi, A. C., Rivinius, T., Okazaki, A. T., & Bjorkman, J. E. 2012, ApJ, 756, 156
- Hoyle & Lyttleton (1939) Hoyle, F. & Lyttleton, R. A. 1939, Proceedings of the Cambridge Philosophical Society, 35, 405
- Inam et al. (2009) Inam, S. Ç., Townsend, L. J., McBride, V. A., et al. 2009, MNRAS, 395, 1662
- Kim et al. (2003) Kim, S., Staveley-Smith, L., Dopita, M. A., et al. 2003, ApJS, 148, 473
- Kiziltan et al. (2010) Kiziltan, B., Kottas, A., & Thorsett, S. E. 2010, ArXiv e-prints
- Klus et al. (2013) Klus, H., Bartlett, E. S., Bird, A. J., et al. 2013, MNRAS, 428, 3607
- Kozłowski & Kochanek (2009) Kozłowski, S. & Kochanek, C. S. 2009, ApJ, 701, 508
- Kozłowski et al. (2012) Kozłowski, S., Kochanek, C. S., Jacyszyn, A. M., et al. 2012, ApJ, 746, 27
- Krühler et al. (2008) Krühler, T., Küpcü Yoldaş, A., Greiner, J., et al. 2008, ApJ, 685, 376
- Lanz & Hubeny (2003) Lanz, T. & Hubeny, I. 2003, ApJS, 146, 417
- Lanz & Hubeny (2007) Lanz, T. & Hubeny, I. 2007, ApJS, 169, 83
- Lee et al. (1991) Lee, U., Osaki, Y., & Saio, H. 1991, MNRAS, 250, 432
- Liu et al. (2005) Liu, Q. Z., van Paradijs, J., & van den Heuvel, E. P. J. 2005, A&A, 442, 1135
- Masetti et al. (2006) Masetti, N., Morelli, L., Palazzi, E., et al. 2006, The Astronomer’s Telegram, 783, 1
- Mason et al. (2012) Mason, A. B., Clark, J. S., Norton, A. J., et al. 2012, MNRAS, 422, 199
- McSwain & Gies (2005) McSwain, M. V. & Gies, D. R. 2005, ApJS, 161, 118
- Meixner et al. (2006) Meixner, M., Gordon, K. D., Indebetouw, R., et al. 2006, AJ, 132, 2268
- Negueruela & Coe (2002) Negueruela, I. & Coe, M. J. 2002, A&A, 385, 517
- Okazaki (1991) Okazaki, A. T. 1991, PASJ, 43, 75
- Okazaki et al. (2012) Okazaki, A. T., Hayasaki, K., & Moritani, Y. 2012, ArXiv e-prints
- Panagia (1973) Panagia, N. 1973, AJ, 78, 929
- Pei (1992) Pei, Y. C. 1992, ApJ, 395, 130
- Porter (1999) Porter, J. M. 1999, A&A, 348, 512
- Predehl & Schmitt (1995) Predehl, P. & Schmitt, J. H. M. M. 1995, A&A, 293, 889
- Rawls et al. (2011) Rawls, M. L., Orosz, J. A., McClintock, J. E., et al. 2011, ApJ, 730, 25
- Reig (2008) Reig, P. 2008, A&A, 489, 725
- Reig (2011) Reig, P. 2011, Ap&SS, 332, 1
- Reig & Nespoli (2012) Reig, P. & Nespoli, E. 2012, ArXiv e-prints
- Russell & Dopita (1992) Russell, S. C. & Dopita, M. A. 1992, ApJ, 384, 508
- Sabogal et al. (2005) Sabogal, B. E., Mennickent, R. E., Pietrzyński, G., & Gieren, W. 2005, MNRAS, 361, 1055
- Schwering & Israel (1991) Schwering, P. B. W. & Israel, F. P. 1991, A&A, 246, 231
- Skrutskie et al. (2006) Skrutskie, M. F., Cutri, R. M., Stiening, R., et al. 2006, AJ, 131, 1163
- Strüder et al. (2001) Strüder, L., Briel, U., Dennerl, K., et al. 2001, A&A, 365, L18
- Sturm et al. (2013) Sturm, R., Haberl, F., Pietsch, W., et al. 2013, A&A, submitted
- Sturm et al. (2012) Sturm, R., Haberl, F., Rau, A., et al. 2012, A&A, 542, A109
- Townsend et al. (2011) Townsend, L. J., Coe, M. J., Corbet, R. H. D., & Hill, A. B. 2011, MNRAS, 416, 1556
- Turner et al. (2001) Turner, M. J. L., Abbey, A., Arnaud, M., et al. 2001, A&A, 365, L27
- Udalski et al. (2008a) Udalski, A., Soszynski, I., Szymanski, M. K., et al. 2008a, Acta Astron., 58, 89
- Udalski et al. (2008b) Udalski, A., Szymanski, M. K., Soszynski, I., & Poleski, R. 2008b, Acta Astron., 58, 69
- Vacca et al. (1996) Vacca, W. D., Garmany, C. D., & Shull, J. M. 1996, ApJ, 460, 914
- van Kerkwijk et al. (1995) van Kerkwijk, M. H., Waters, L. B. F. M., & Marlborough, J. M. 1995, A&A, 300, 259
- Waters et al. (1988) Waters, L. B. F. M., van den Heuvel, E. P. J., Taylor, A. R., Habets, G. M. H. J., & Persi, P. 1988, A&A, 198, 200
- Watson et al. (2009) Watson, M. G., Schröder, A. C., Fyfe, D., et al. 2009, A&A, 493, 339
- Wilms et al. (2000) Wilms, J., Allen, A., & McCray, R. 2000, ApJ, 542, 914
- Zaritsky et al. (2004) Zaritsky, D., Harris, J., Thompson, I. B., & Grebel, E. K. 2004, AJ, 128, 1606