Crystal structure and properties of barium thorate BaThO3 from first principles
Abstract
The phonon spectrum of cubic BaThO3 with the perovskite structure is calculated from first principles within the density functional theory. The analysis of unstable modes in the phonon spectrum enables to determine the symmetry of all possible distorted phases, calculate their energies, and show that the ground-state structure of barium thorate is . For this structure, the static and optical dielectric constants, elastic moduli, heat capacity, Raman spectra, and the energy band gap in the LDA and approximations are calculated. The possibility of the structural phase transitions in BaThO3 is also discussed.
pacs:
61.50.Ah, 63.20.-e, 77.84.-sI Introduction
The O3 perovskite oxides constitute an important family of materials that display interesting physical properties (ferroelectricity, ferroelasticity, superconductivity, magnetism) and are widely used in technological applications. Barium thorate BaThO3 is one of the members of this family. High thermal stability of barium thorate (its melting point is above 2300∘C) and relatively low work function of thorium enable to use BaThO3 for thermionic cathodes of high-intensity discharge lamps (see, for example, patents Noble and Rooksby (1946); White (1962); Speros (1965)). Barium thorate ceramics doped with neodymium Tsuji et al. (1994); Furøy et al. (2007) and yttrium Tsuji et al. (1995) are solid electrolytes, which have the highest proton conductivity at temperatures above 900∘C among solid electrolytes. Since barium thorate is produced as the fission product in nuclear reactors (especially in uranium–thorium reactors), the knowledge of its properties is also important for predicting the reliability of nuclear fuel elements.
Insufficient knowledge of the properties of BaThO3 becomes evident from the fact that even its crystal structure is not well established. In the very first work, Hoffmann (1935) the structure of barium thorate was identified as a simple perovskite structure with the lattice parameter of Å. A more detailed study Smith and Welch (1960) found the superstructure reflections on the diffraction patterns, but because of the lack of splitting of the strong peaks, the structure was considered as a pseudocubic one with a doubled lattice parameter. Finally, after the splitting of the main reflections was observed, Nakamura (1974); Purohit et al. (2000) the structure of BaThO3 was identified as orthorhombic, but neither the space group nor the atomic coordinates were determined.
Thermodynamic properties of barium thorate (the Gibbs energy of formation) were determined in Refs. Bharadwaj et al., 1999; Mishra et al., 1999. In Ref. Murtaza et al., 2011, the electronic structure, optical and elastic properties of BaThO3 were calculated from first principles using the FP-LAPW approach, but for some reason the calculations were limited to the cubic five-atom unit cell, whereas X-ray studies clearly indicate the lower symmetry. According to these calculations, the cubic barium thorate is a direct-gap insulator with the band gap of eV. This result, however, contradicts the density-of-states calculations presented in Ref. Murtaza et al., 2011, according to which the energy gap between the valence and conduction bands is 3.33 eV, and the calculations of the optical spectra in which the absorption starts at an energy below 5 eV.
The knowledge of the true crystal structure of BaThO3 is crucial for correct prediction of its properties. In this work, we use the first-principles calculations to determine the equilibrium structure of barium thorate, calculate some of its properties, and discuss the possibility of the structural phase transitions in it.
II Calculation details
To predict the properties of BaThO3, we must first determine its ground-state structure which has the lowest energy at . For this purpose, we must first calculate the phonon spectrum of its parent phase and then, by adding the distortions corresponding to unstable modes in the phonon spectrum to the structure, seek for a minimum-energy structure in which the energy of all optical phonons at all points of the Brillouin zone are positive and the structure is mechanically stable (the stability criterion is the positive values of the determinant and all leading principal minors of the 66 matrix of elastic moduli in the Voigt notation). Lebedev (2009)
| Atom | Configuration | |||||||||
|---|---|---|---|---|---|---|---|---|---|---|
| Ba | 1.85 | 1.78 | 1.83 | 7.07 | 7.07 | 7.07 | 0.1 | 1.68 | 1.95 | |
| Th | 1.88 | 2.04 | 2.04 | 7.57 | 7.27 | 7.07 | 0.01 | 1.76 | 0.75 | |
| O | 1.40 | 1.55 | 1.40 | 7.07 | 7.57 | 7.07 | — | — | — |
In this work, the first-principles calculations were performed within the density functional theory (DFT) using the ABINIT software. Gonze et al. (2009) The exchange-correlation interaction was described in the local density approximation (LDA). Pseudopotentials for Ba and O atoms used in the calculations were taken from Ref. Lebedev, 2009. Scalar-relativistic pseudopotential for the Th atom was constructed using the RRKJ scheme Rappe et al. (1990) with the OPIUM program. opi To improve the transferability of the pseudopotential, the local potential correction Ramer and Rappe (1999) was used. The parameters used for the construction of pseudopotentials are presented in Table 1. Testing of the Th pseudopotential using ThO2 as an example revealed its high enough quality: the calculated lattice parameter of this compound (5.606 Å) differed from the experimental value by only 0.15% and the bulk modulus (205 GPa) differed by 4%.
The lattice parameters and the equilibrium atomic coordinates in the unit cell were determined from the condition that the residual forces acting on the atoms are less than Ha/Bohr (0.25 meV/Å) and the total energy is calculated self-consistently to an accuracy of better than Ha. The integration over the Brillouin zone was performed on the 888 Monkhorst–Pack mesh for the cubic phase or on the meshes with equivalent -point density for low-symmetry phases. The maximum plane-wave energy was 30 Ha.
The quasiparticle band gap of BaThO3 was calculated using the so-called one-shot approximation. Onida et al. (2002); Bechstedt et al. (2009) The Kohn–Sham wave functions and energies calculated within DFT-LDA were used as a zeroth-order approximation. The dielectric matrix was computed for a 666 -point mesh from the independent-particle polarizability matrix calculated for 3743 reciprocal-lattice vectors , 20 occupied and 280 unoccupied bands. The dynamic screening was described using the Godby–Needs plasmon-pole model. The components of wave functions with kinetic energy up to 24 Ha were used in these calculations. The energy correction to the DFT-LDA solution was computed as diagonal matrix elements of the operator, where is the self-energy operator, is the exchange-correlation energy operator, is the Green’s function, and is the screened Coulomb interaction. In the calculations of , the components of wave functions with kinetic energy up to 24 Ha for both exchange and correlation parts of were used. The accuracy of the band gap calculation estimated from the convergence tests is 0.05 eV.
III Results
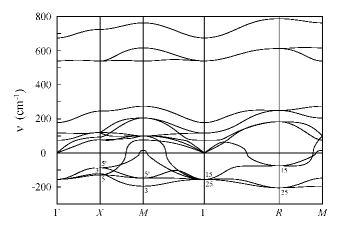
The phonon spectrum of BaThO3 in the cubic phase is shown in Fig. 1. It is seen that there are nine unstable modes in the phonon spectrum of barium thorate. They include the triply degenerate mode associated with the ferroelectric instability; the triply degenerate mode describing the uniform deformation of the oxygen octahedra; the triply degenerate mode and nondegenerate mode, which describe the rotation of the octahedra; the doubly degenerate antiferroelectric , , and modes; the non-degenerate mode describing spatially non-uniform deformation of the octahedra; and the triply degenerate mode describing the vibrations of the Ba atom in its oxygen environment.
| Phase | Unstable mode | Energy (meV) |
|---|---|---|
| — | 0 | |
| 55.9 | ||
| 90.9 | ||
| 99.3 | ||
| 101.4 | ||
| 118.8 | ||
| 123.0 | ||
| 148.0 | ||
| 153.1 | ||
| 228.0 | ||
| 234.5 | ||
| 255.9 | ||
| 303.2 | ||
| 326.4 | ||
| 337.2 | ||
| 529.2 | ||
| 599.3 | ||
| 696.4 | ||
| 710.1 | ||
| ; | 754.4 | |
| 797.8 |
The energies of all phases obtained from the condensation of the unstable phonons as well as the energies of and phases resulting from simultaneous condensation of the and modes are given in Table 2. Among these phases, the phase has the lowest energy.
| Atom | Position | |||
|---|---|---|---|---|
| Ba | 0.01246 | 0.03717 | 0.25000 | |
| Th | 0.50000 | 0.00000 | 0.00000 | |
| O1 | 0.10447 | 0.46199 | 0.25000 | |
| O2 | 0.70713 | 0.29227 | 0.05723 |
The calculation of the phonon spectrum in the phase shows that the frequencies of all optical phonons at the center of the Brillouin zone and at the high-symmetry points on its boundary are positive; the determinant and all leading principal minors constructed from the elastic tensor are also positive. This means that the phase is the ground-state structure of BaThO3. The calculated lattice parameters of this phase are , , and Å; the atomic coordinates are given in Table 3. The obtained lattice parameters are in good agreement with the experimental data of Ref. Nakamura, 1974 (, , Å) and Ref. Purohit et al., 2000 (, , Å).
We now consider some physical properties of BaThO3 in the ground state. Although the ferroelectric instability was found in the parent cubic phase, the structural distortions suppress this instability, and in the ground state barium thorate is a paraelectric. The static dielectric tensor in the phase is characterized by three diagonal components of , , and ; the tensor of the optical dielectric constant is described by the components of , , and . The elastic moduli are GPa, GPa, GPa, GPa, GPa, GPa, GPa, GPa, GPa. The bulk modulus in the orthorhombic phase is GPa; in the phase its value is 124.2 GPa and is very close to the value of 124 GPa obtained in Ref. Murtaza et al., 2011.
| The mode symmetry | Frequency (cm-1) |
|---|---|
| 75; 89; 157; 207; 300; 341; 523 | |
| 95; 109; 169; 283; 312; 387; 666 | |
| 92; 217; 331; 508; 681 | |
| 96; 123; 298; 520; 613 |
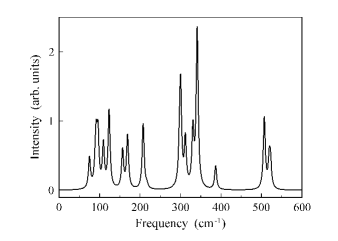
For identification of the phase of BaThO3 it is convenient to use the Raman spectroscopy. The calculated frequencies of the Raman-active modes in this phase are given in Table 4, and the theoretical Raman spectrum calculated for a polycrystalline sample at 300 K using the formulas from Ref. Prosandeev et al., 2005 is shown in Fig. 2.
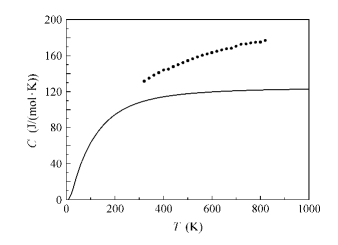
The energies of different phases obtained in this work (Table 2) enable to make some remarks on the possible phase transitions in barium thorate. The phase closest in energy to the ground-state structure has the energy only by 43.4 meV higher than the ground-state energy. This means that a second-order phase transition can occur in BaThO3 at a temperature slightly above 300 K. In the experimental study of the heat capacity, Krishnan et al. (2001) no anomalies were detected in the temperature range 320–820 K, but the peculiarity of the results of Ref. Krishnan et al., 2001 is that the measured values of the specific heat are much higher than our calculated ones (Fig. 3) and, more significantly, they even exceed the theoretical limit of 3 per atom in the unit cell (the Dulong–Petit law). This may indicate that the investigated sample was likely not pure.111It is known that, when exposed to air, barium thorate absorbs moisture and reacts with CO2 thus forming a mixture of ThO2 + BaCO3. Hoffmann (1935); Harada and Bradstreet (1960) The annealing temperature before the specific heat measurements in Ref. Krishnan et al., 2001 (550∘C) was sufficient to remove moisture, but was not high enough to decompose BaCO3. After the interaction with CO2, the number of atoms in a mole of the substance increases, and this results in an increase of the heat capacity. We believe that the predicted phase transition was hidden by this fact. In this regard, we note that the features in the dielectric properties of BaThO3 at about 260∘C, which were observed in Ref. Harada and Bradstreet, 1960 and interpreted as an evidence for the ferroelectric phase transition, can actually be associated with the phase transition under discussion.
To resolve the contradictions mentioned in the Introduction on the energy band gap in cubic BaThO3, we performed our own calculations of in both the LDA approximation used in this work and in the approximation Onida et al. (2002); Bechstedt et al. (2009) which takes into account the many-body effects and enables to obtain the energy band gap in much better agreement with the experiment. Lebedev (2012) According to our data, in the LDA approximation eV in the phase; in the orthorhombic phase the band gap increases to 3.947 eV. As the DFT calculations always underestimate the energy band gap, more realistic values can be obtained in the approximation. These calculations gave the energy band gap eV for the cubic phase. This value is intermediate between the two values, 5.7 eV and 3.33 eV, reported for this phase in Ref. Murtaza et al., 2011. In both cubic and orthorhombic phases, the extrema of the valence and conduction bands are located at the point of the Brillouin zone (the optical transitions are direct).
The calculations presented in this work were performed on the laboratory computer cluster (16 cores).
IV Conclusions
First-principles calculations of the phonon spectra and structure of cubic BaThO3 and its distorted phases have shown that the ground-state structure of barium thorate is . The static and optical dielectric constants, elastic moduli, heat capacity, Raman spectra, and the energy band gap in the LDA and approximations have been calculated for this structure. It has been shown that the structural phase transition can occur in BaThO3 at a temperature slightly above 300 K.
References
- Noble and Rooksby (1946) S. H. Noble and H. P. Rooksby, “Activated electrode,” U.S. Patent No. 2,394,095 (05 Feb 1946).
- White (1962) J. E. White, “Thermoionic electrode for discharge lamps,” U.S. Patent No. 3,029,359 (10 Apr 1962).
- Speros (1965) D. M. Speros, “Cathodes and method of manufacture,” U.S. Patent No. 3,188,236 (08 June 1965).
- Tsuji et al. (1994) T. Tsuji, T. Suzuki, and H. Iwahara, Solid State Ionics 70–71, 291 (1994).
- Furøy et al. (2007) K. A. Furøy, R. Haugsrud, M. Hänsel, A. Magrasó, and T. Norby, Solid State Ionics 178, 461 (2007).
- Tsuji et al. (1995) T. Tsuji, N. Miyajima, and M. Ochida, Solid State Ionics 79, 183 (1995).
- Hoffmann (1935) A. Hoffmann, Z. Physik. Chem. B 28, 65 (1935).
- Smith and Welch (1960) A. J. Smith and A. J. E. Welch, Acta Cryst. 13, 653 (1960).
- Nakamura (1974) T. Nakamura, Chem. Lett. 3, 429 (1974).
- Purohit et al. (2000) R. D. Purohit, A. K. Tyagi, M. D. Mathews, and S. Saha, J. Nucl. Mater. 280, 51 (2000).
- Bharadwaj et al. (1999) S. R. Bharadwaj, R. Mishra, M. Ali(Basu), D. Das, A. S. Kerkar, and S. R. Dharwadkar, J. Nucl. Mater. 275, 201 (1999).
- Mishra et al. (1999) R. Mishra, M. Ali(Basu), S. R. Bharadwaj, A. S. Kerkar, D. Das, and S. R. Dharwadkar, J. Alloys Comp. 290, 97 (1999).
- Murtaza et al. (2011) G. Murtaza, I. Ahmad, B. Amin, A. Afaq, M. Maqbool, J. Maqssod, I. Khan, and M. Zahid, Opt. Mater. 33, 553 (2011).
- Lebedev (2009) A. I. Lebedev, Phys. Solid State 51, 362 (2009).
- Gonze et al. (2009) X. Gonze, B. Amadon, P.-M. Anglade, J.-M. Beuken, F. Bottin, P. Boulanger, F. Bruneval, D. Caliste, R. Caracas, M. Côté, T. Deutsch, L. Genovese, P. Ghosez, M. Giantomassi, S. Goedecker, D. R. Hamann, P. Hermet, F. Jollet, G. Jomard, S. Leroux, M. Mancini, S. Mazevet, M. J. T. Oliveira, G. Onida, Y. Pouillon, T. Rangel, G.-M. Rignanese, D. Sangalli, R. Shaltaf, M. Torrent, M. J. Verstraete, G. Zerah, and J. W. Zwanziger, Computer Phys. Commun. 180, 2582 (2009).
- Rappe et al. (1990) A. M. Rappe, K. M. Rabe, E. Kaxiras, and J. D. Joannopoulos, Phys. Rev. B 41, 1227 (1990).
- (17) “Opium—pseudopotential generation project,” http://opium.sourceforge.net/.
- Ramer and Rappe (1999) N. J. Ramer and A. M. Rappe, Phys. Rev. B 59, 12471 (1999).
- Onida et al. (2002) G. Onida, L. Reining, and A. Rubio, Rev. Mod. Phys. 74, 601 (2002).
- Bechstedt et al. (2009) F. Bechstedt, F. Fuchs, and G. Kresse, Phys. Status Solidi B 246, 1877 (2009).
- Prosandeev et al. (2005) S. A. Prosandeev, U. Waghmare, I. Levin, and J. Maslar, Phys. Rev. B 71, 214307 (2005).
- Krishnan et al. (2001) R. V. Krishnan, K. Nagarayan, and P. R. V. Rao, J. Nucl. Mater. 299, 28 (2001).
- Note (1) It is known that, when exposed to air, barium thorate absorbs moisture and reacts with CO2 thus forming a mixture of ThO2 + BaCO3. Hoffmann (1935); Harada and Bradstreet (1960) The annealing temperature before the specific heat measurements in Ref. \rev@citealpnumJNuclMater.299.28 (550∘C) was sufficient to remove moisture, but was not high enough to decompose BaCO3. After the interaction with CO2, the number of atoms in a mole of the substance increases, and this results in an increase of the heat capacity.
- Harada and Bradstreet (1960) Y. Harada and S. W. Bradstreet, Synthesis of refractory mixed oxide with perovskite structure, Tech. Rep. ARF-6046 (Illinois Inst. of Technol., Chicago. Armour Research Foundation, 1960).
- Lebedev (2012) A. I. Lebedev, Phys. Solid State 54, 1663 (2012).