Muon capture rates from precision measurements of the muon disappearance
Abstract
In a typical experiment the nuclear -capture rate is determined from measurements of the time constant of the muon decay exponential in a target. We propose a new approach for the evaluation of the -capture rate, which is based on direct measurements of the disappearance rate in the target. Considering, as an example, the reaction of -capture on proton, we demonstrate that measurements of the disappearance at different values of the hydrogen gas pressure in the target could be used to avoid a pressure-dependent correction and determine the ”vacuum” reaction rate with accuracy better than after extrapolation to zero gas density. The proposed method could be used to perform precision measurements of the capture rate on different types of nuclei in one experiment.
pacs:
14.80.-j, 12.20.Fv, 13.20.CzI Introduction
Precise measurements of muon capture rates on nuclei are important to test concepts in nuclear and particle physics and to discover physics beyond the standard model of electroweak interactions, see e.g. meas ; kam . Among variety of possible reactions, the muon capture on proton, , attracts significant attention kam1 ; aav . The precise measurements of the capture rate from the singlet state in this process is of fundamental interest to determine the pseudoscalar form factors in the axial nucleon current contributing to the week interaction between the muon and the proton. The reaction has low rate and its precision measurement presents a challenge for the design and performance of the experiment. The measurements are complicated by the fact that negative muons stopped in hydrogen could be captured not only from the atomic state, but also from the molecules, where the muon capture rate differs significantly. The most precise results on the muon capture in hydrogen has been recently reported by the MuCap collaboration. For singlet rate they have obtained the value mucap , which corresponds to the branching fraction
| (1) |
determined with the precision of , or the overall precision of with respect to the muon decay rate.
The MuCap detector was specially designed to significantly reduce the density-dependent formation of molecules by employing a low density hydrogen gas target. In this experiment, as well as in many others, the nuclear -capture rate was determined from measurements of the time constant of the muon decay exponential in the target. In this paper we discuss a novel approach allowing to improve the experimental precision of the muon capture rate on protons or other nuclei with a new type of measurements. Instead of measuring the muon exponential decay constant, we proposed to measure directly the muon disappearance rate in the target. The rest of the paper is organized as follows. In Sec. II we describe the new approach, simulations of the signal, and the preliminary design of the experimental setup. The background sources and the expected sensitivity are discussed in Sec. III and Sec. IV, respectively. Section V contains concluding remarks.
II Precision measurements of the muon capture rate on protons
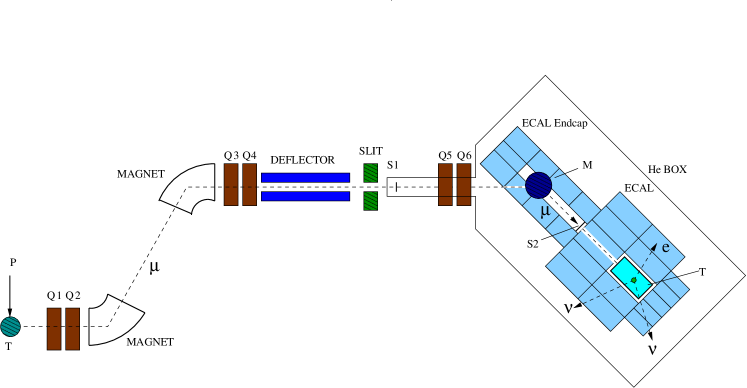
To illustrate the method, consider an experiment on measurements of the muon capture rate on protons in the hydrogen gas target. The main components of the experimental setup are schematically illustrated in Fig. 1, see also sngmu ; gkm . The beam of surface ’s passing through the beam defining counters S1,2 is focused through a narrow aperture into a target () used for the muonic hydrogen formation. The target is an Al vessel filled with high purity hydrogen. Shown are also the quadrupole magnets (Q) used for the beam focusing. The energy of the beam is degraded by the counters material to maximize the muon stopping rate in the target, where about 97% of the muon captures occur in the singlet state. The target is surrounded by a hermetic 4 electromagnetic calorimeter (ECAL) to detect the energy deposited from the all muon processes in the target. As shown in Fig. 1, before muons reach the entrance to the ECAL, they are bent in magnetic field. The purpose of utilizing the magnet is to provide a transverse kick to negative muons in order to allow them to enter the target through the narrow aperture, and to detect photons, positrons, or muons that could escape the detection region through the entrance by a set of ECAL counters placed around the muon bend region, see e.g. gkm . This additional detector is placed up stream of the entrance aperture. The counter S2 is also used as a veto against decay electrons or backscattered muons that could escape the ECAL through the entrance hole. The deflector could be used in order to operate the setup in a ”muon on request mode” with the repetition rate of the order 100 kHz. The readout of the energy deposited in the ECAL is triggered by a high efficiency tag signal of the muon appearance on the target, defined as the coincidence of signals from the counters S1 and S2 and enhanced by using the muon time-of-flight information. To estimate the accuracy of the experiment a feasibility study based on simplified GEANT4 geant simulations combined with numerical calculations has been performed. The ECAL is an array of bismuth germanate (BGO) counters each of 52 mm in diameter and 220 mm long, which was previously used in the experiment searching for invisible decay of positronium bader . The analysis takes into account active materials of the ECAL and passive materials from 3 mm thick aluminum (Al) vessel walls.
For negative muons stopped in the target the expected distribution of the energy deposited in the ECAL is given by a sum of four spectra:
| (2) |
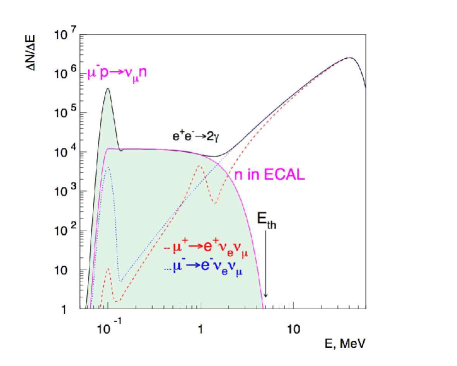
where , and and are the number of events and the normalized shapes of the energy distributions from the processes , without () and with () recoil neutron energy deposition in the ECAL, and background, respectively. The background shape including the ECAL counter’s pedestals width is taken from simulations of measurements performed with a random trigger and assuming beam intensity of ’s/s, see, also Sec. III. The ECAL energy distribution obtained after background component subtraction for ’s and ’s stopped in the target is shown in Fig. 2. For the ordinary muon decay the experimental signature is the ECAL energy deposition from a single decay electron with energy , where are the electron and muon neutrino energy, respectively. The function is calculated from the pure Michel spectrum convoluted with the ECAL energy resolution bader , and taking into account decay electron interactions with the passive material.
The ECAL energy from the reaction originates from the recoil neutron interactions with nuclei of the ECAL matter, which are not or poorly detected. In this case the neutron energy dissipates in a variety of mechanisms, resulting in the invisible final state described by the function . The neutrino, obviously, cannot be detected with any reasonable size calorimeter. The experimental signature of the process with the apparent energy disappearance in the ECAL is an event with the sum of the ECAL crystal energies deposited by the final-state particles equal zero. Zero energy is defined in this case as an energy deposition below of a certain ECAL energy threshold, . Examples of such kind of measurements can be found in Ref.bader describing the experiment on a search for invisible decay of positronium, see also opsmos , or in a recent proposal on a search for the muonium annihilation gkm . The function defined as ”zero energy” in the ECAL, is parametrized by the Gaussian with the keV FWHM, in order to reproduce the distribution of the ECAL counter pedestals bader . The same feature, peak at zero energy , is also present in the Michel spectrum in the ECAL corresponding to cases when decay electrons are not detected (see discussion below).
A fraction of the reaction energy may be recovered when the recoil neutron is scattered or captured by other nuclei giving rise to a visible signal in the ECAL. The ratio depends on the ECAL crystal type. For BGO crystals it is of the order nbgo . The function is parametrized by using the BGO crystal prompt response to 4 - 6 MeV neutrons from Ref.nbgo with a proper rescaling. The uncertainties of the shape of the -distribution are not very important (actually, the function can be measured in the proposed experiment). The most important fact is that the neutron energy spectrum vanishes at 5 MeV, i.e. it is below the energy threshold of MeV. So, one can consider the energy region MeV as the signal region for the reaction . The higher energy part of the spectrum, above 5 MeV, is assumed to be not affected by the energy deposition from the recoil neutron in the reaction . It is calculated from the pure Michel spectrum convoluted with the ECAL energy resolution.
As shown in Fig. 2, the and spectra are not completely separated. In order to extract the number of signal events and determine the rate of the reaction , one has to measure accurately the corresponding number of background events from the decay in the region MeV:
| (3) |
This inevitable background came from the muon decay into a final state electron which after energy loss in the vessel material either completely stop in it or enters the ECAL with the kinetic energy 5 MeV. In both cases the event results in a fake signal. The partial muon decay rate into an electron with as a function of is given by
| (4) |
where is the muon mass. To reduce the number of such background events one has to use as low as possible threshold . Taking into account that energy of positrons that stop in the Al vessel is typically MeV, the fraction of stopped ’s is estimated to be . The target vessel should be optimized in size by keeping the amount of passive material as small as possible.
The contribution of low energy electrons from the muon decay in the signal region, can be obtained by using spectrum of the energy deposition in the ECAL from the decays of positive muons. The decay rate of positive muons that stopped in the target is not affected by the capture reaction. Hence, assuming the initial identity of the and spectra, the fraction of low energy positron in the signal region can be precisely measured and used for the evaluation of the corresponding fraction of electron events from the decay .
The calculated distribution of the energy deposition in the ECAL from decay positrons is shown in Fig. 2. The spectrum is a superposition of two spectra: one from positrons that stopped and annihilated in the target, another one corresponds to positrons that struke the ECAL. The letter is shifted to higher energies by the amount of additional energy MeV, from the positron annihilation in the BGO crystals. Positrons that stopped in the vessel, differently from the electrons, produce visible signal due to their annihilation into 2 or 3 ’s at a lifetime scale of the order of a few ns. One can see a peak around 1 MeV in Fig. 2 from these events, whose fraction depends on the Al vessel thickness. As the attenuation length for 511 keV annihilation ’s in Al is much smaller then that of MeV electrons ( 3 cm for ’s, and a few mm for e-’s with energy of 1 MeV), most of ’s are detected. Simulations show that the main contribution to the -detection inefficiency comes from the total (due to photo-absorption) or fractional (due to Compton effect) photon energy loss in the material of the vessel. Therefore, it is preferable to have the vessel made of a low-Z material to minimize the e±’s energy loss and the cross-section of the photo-absorption, which is . For the vessel thickness of 3 mm, however, only a fraction of 1% of annihilation photons would be completely absorbed. A negligibly small peak at zero energy in Fig. 2 represents such losses of annihilation energy. Thus, for the most positrons stopped in the vessel, the energy deposited in the ECAL would be MeV, making these events visible, as illustrated in Fig. 2.
The fraction of ’s events from muon decays with energy below the threshold MeV is . In order to be competitive with the reported precision of Eq.(1), one has to determine the contribution from to the signal region with accuracy at least or better. As discussed previously, this number of events from decays can be determined by using the proper normalized spectrum of the energy deposition in the ECAL from positive muon decays. For a value far from the annihilation peak, see Fig. 2, the corresponding numbers of and events are assumed to be connected by the relation
| (5) |
Below, we discuss the accuracy up to which Eq.(5) is valid, and show that it is suitable for the purpose of the experiment. The statistical error at the level in determining of from Eq.(5), could be easily achieved during one day of running the experiment at a moderate intensity /s. Several sources of systematic uncertainties, such as possible difference between the ECAL responses to the energy deposited by electrons, positrons and photons, backscattering from the BGO crystals, etc.. have been considered. The dominant source of systematic uncertainties is found to be due to a small difference between the electron and positrons energy loss in matter. For the energy region MeV, the ECAL energy spectra of ’s and ’s are related by
| (6) |
where the correction appears due to the difference between the ’s and ’s energy loss rate in the vessel. Comparison of positron and electron energy loss in Al shows that for the energy range MeV the collisional energy loss ratio is in the range epdiff :
| (7) |
while for the total energy loss it is
| (8) |
Simplified simulations of events were performed to obtained the and spectra. The ECAL energy distribution was corrected for the energy loss difference by using Eqs.(6,8) and normalized to the spectrum in the energy region MeV. For decays, the ratio of the number of background electron events in the signal region MeV, determined from the decay spectrum, to the number of true background electron events were found to be . The error in this estimate is defined by the statistical one combined with the uncertainty of corrections in Eq.(8), taken to be . If one extrapolates this result to the total number of events accumulated during one day of running, then, the number of background electron events in the signal region can be predicted with a precision . Although such extrapolation may be imperfect and the question - have all sources of systematic errors been properly estimated?- still remains, we do not see a potential source of systematic uncertainty which prevents us from doing this. Indeed, even if we neglect the - difference and take in Eq.(6), the and spectra are systematically shifted with respect to each other by MeV in the energy region MeV. Taking into account Eq.(4), results in systematic error in the prediction of background events due to this energy shift, which is comparable with the required precision. Therefore, this procedure of background estimate from low energy electrons allows potentially to reach accuracy in the muon capture rate as small as .
In order to cross-check simulations of spectra features, one could also compare the number of electrons stopped in the passive material with those predicted from the annihilation peak in the positron spectrum. For this purpose, the region around the peak is described by a function , which is a sum of a distribution corresponding to the 1 MeV peak from the positron annihilation in the ECAL and a polynomial background. The fit results in prediction of background events contributing to the signal region, which is found to be in a good agreement with the true number of 4503 ’s stopped in the target.
III Background
The background processes for the reaction can be classified as being due to physical, detector-, and beam-related backgrounds. To perform the full detector simulation and to investigate these backgrounds down to the level would require the generation of a large number of muon decays resulting in a large amount of computer time. Consequently, background processes are estimated with a smaller statistics combined with numerical calculations.
The following sources of physical- and detector-related backgrounds are considered. The first one is related to the incomplete ECAL hermiticity. Our study identified this background as due to energetic decay products, and ’s, escaping the detection region though the entrance aperture. This process increases the disappearance rate of the muon and hence must be addressed. If a muon decays in flight in the target into a fast electron (positron) with momentum pointing to the ECAL entrance hole it also contribute to the signal region. The feasibility study of the experiment on the muonium decay into neutrino, shows that this contribution from the incomplete ECAL hermiticity is well under the level ; for more detail discussions, see Ref.gkm . For the Al vessel thickness of 3 mm, background due to the annihilation photons absorption in the vessel material is found to be small.
The beam-related backgrounds produce the fake muon tag and can be classified as being due to a beam particle misidentified as a muon, or several beam particles which produce fake muon tag due to accidental coincidence of signals from S1,2. Identification of the incoming particle as a muon based on the requirements of the delayed by the muon time-of-flight coincidence between the beam counter signals suppresses the single-beam background down to the negligible level. The performed analysis shows that the beam-related background is dominated by the pileup events. The pileup energy, which corresponds to extra energy deposited in the ECAL counters by an additional undetected and uncorrelated particle, increases values of the counters pedestals and shifted them into higher energy region. The amount of additional energy in each ECAL counter can be accurately measured with the random trigger provided by an external clock of low frequency bader and then subtracted from the energy spectrum, as discussed previously.
IV Expected results
The number of observed signal events for a given hydrogen gas pressure in the target is given by
| (9) |
where , and is the running time of the experiment. The is taken from the high precision measurements results of the positive muon lifetime recently reported by the MuLan collaboration mulan1 ; mulan2 ; mulan3 :
| (10) |
and assuming that the lifetimes of and are equal to each other. Note, that the muon lifetime found in these measurements is obtained with precision ppm. The muon disappearance rate in the detector is given by mucap
| (11) |
where is a calculable correction due to the bound-state effect c1 ; c2 and is pressure depending correction, which takes into account a fraction of muons captured from molecular states. In the MuCap experiment the latter corresponds to about 3% of muons. The correction depends on the muon capture rate from orth- or para- state, and on the ortho-to-para transition rate. It could be derived from fits to simulated data mucap . This evaluation, however, is known with a limited accuracy.
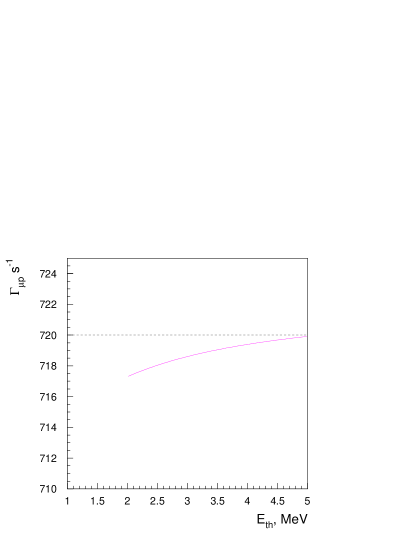
A more appropriate way to obtain the rate would be the extrapolation of obtained from measurements at several different values of the hydrogen gas pressure in the target to zero gas density. In Fig. 3 the dependence of the value extracted from simulated spectra of Fig.2 by using Eq.(9) as a function of the ECAL energy threshold for a given hydrogen gas pressure is shown for illustration. Assuming the muon intensity of s and using Eq.(1), we anticipate signal events per one day of running the experiment. The estimate shows, that the ”vacuum” capture rate can be obtained by a 0.2% extrapolation of six measured values at the gas pressure from 5 to 10-bar to zero gas density. Here, we use linear extrapolation, assuming that for each pressure value the rate is measured with precision %, and the formation rate of states is proportional to the gas density. Clearly, the statistical accuracy can be easily improved with more accumulated data. The extrapolation will remove pressure-dependent systematic effects related to the reaction from molecular states in the target. Hence, this experiment is virtually a direct measurement of the ”vacuum” muon capture rate on protons. However, it is a subject to very different systematic effects than in the MaCap experiment, as discussed above. In Table I contributions from the previously discussed processes to the uncertainty of the capture rate determination are summarized. The dominant sources are expected to be due to the small difference between the electron and positron energy loss in the vessel material, uncertainties of the extrapolation procedures and of the recoil neutron energy distribution in the ECAL.
| Source of uncertainty | Expected level |
|---|---|
| fake , tag | |
| , difference | |
| ECAL hermiticity | |
| recoil neutron ECAL spectrum | |
| extrapolation vs | |
| extrapolation vs gas pressure | |
| Total |
Now, let us discuss several additional limitation factors. The first one is related to the relatively long muon lifetime. In order to get the measurement precision of the branching fraction of the order , the ECAL gate duration , and hence the dead-time per trigger, has to be
| (12) |
in order to avoid background from the muon decays outside the gate. In the ETH-INR positronium experiment, the ECAL gate was about for orthopositronium lifetime in the target of 132 ns. This resulted in distribution of the sum of pedestals of all () ECAL counters corresponded to the threshold of 80 keV used to define the signal range for the decay. In the proposed experiment the longer gate will lead to an increase of the pile-up and pick-up electronic noise and hence to the overall broadening of the signal, approximately by a factor and, hence to an increase of the energy threshold roughly up to keV bader . For this threshold the probability of the energy loss from the positron annihilation is about bader , which is still comparable with the expected overall sensitivity of the experiment.
V Summary
In summary, in a typical experiment the nuclear -capture rate is determined from measurements of the time constant of the muon decay exponential in a target. Here, we propose a new technique for the evaluation of the -capture rate, which is based on direct measurements of the disappearance rate in the target. As an example, we consider the reaction of -capture on proton, and show that measurements of the disappearance at different values of the hydrogen gas pressure in the target allow to avoid a pressure-dependent correction and determine the vacuum reaction rate with accuracy better than after extrapolation to zero gas density. This experiment is a subject to very different systematic effects than, e.g., in the recent MuCap experiment mucap . The quoted sensitivity could be obtained with a setup optimized for several its properties. Namely, i) the energy resolution, material composition and dimensions of the target vessel, ii) the efficiency of the beam (veto) counters, and iii) the pile-up effect and zero-energy threshold in the ECAL , are of importance. The question -how reliable are simulations of the difference between electron and positron energy loss and response of the ECAL - might require further study. The described technique could be used for precision measurement of the muon capture rate in cold deuterium gas, which is the main goal of the MuSun experiment musan . Since these measurements have important astrophysical implications, it would be interesting to perform independent experiment with different methods, by using, for example, a setup, which has been recently proposed to search for the muonium annihilation into two neutrino at the Paul Scherrer Institute gkm ; loi . A similar detector without high pressure gas requirements is simpler and could be used for precise measurements with proposed method of the nuclear muon capture rate with different targets in one experiment.
Finally note, that the reported analysis gives an illustrative correct order of magnitude for the precision of the proposed method of muon capture rate measurements and may be strengthened by more accurate and detailed Monte Carlo simulations of the concrete experimental setup, which are beyond the scope of this work.
Acknowledgements.
I am grateful to D. Sillou for usefull comments and his help in calculations. The members of the PSI Advisory Committee are gratefully acknowledged for their valuable comments on type of the measurements described in this work.References
- (1) D.F. Measday, Phys. Rep. 354, 243 (2001).
- (2) P. Kammel and K. Kubodera, Ann. Rev. Nucl. Part. Sci. 60, 327 (2010).
- (3) P. Kammel, Nucl. Phys. A 844, 181c (2010).
- (4) A.A. Vorobyov, Yad. Fiz. 72, 135 (2009).
- (5) V.A. Andreev et al.(MuCap Collaboration), Phys. Rev. Lett. 110, 012504 (2013).
- (6) S.N. Gninenko, N.V. Krasnikov, and V.A. Matveev , Phys. Rev. D 87, 015016 (2013); arXiv:1209.0060.
- (7) S.N. Gninenko, Phys. Rev. D 76, 055004 (2007).
- (8) S. Agostinelli et al. (GEANT4 Collaboration), Nucl. Instrum. Meth. A 506, 250 (2003); J. Allison et al. (GEANT4 Collaboration) IEEE Trans. Nucl. Sc. 53, 270 (2006).
- (9) A. Badertscher, P. Crivelli, U. Gendotti, S.N. Gninenko, V.E. Postoev, A. Rubbia, V.D. Samoylenko and D. Sillou, Phys. Rev. D 75, 032004 (2007)
- (10) G.S. Atoyan, S.N. Gninenko, V.I. Razin and Yu.V. Ryabov, Phys. Lett. B 220, 317 (1989).
- (11) O. Häusser, M.A. Lone, T.K. Alexander, S.A. Kushneriuk, J. Gascon, Nucl. Instr. Meth. 213, 301 (1983).
- (12) S.M. Seltzer and M.J. Berger, Int. J. of Applied Rad. 35, 665 (1984).
- (13) D.B. Chitwood et al. (MuLan Collaboration), Phys. Rev. Lett. 99, 032001 (2007); arXiv:0704.1981.
- (14) D. Webber et al. (MuLan Collaboration), Phys. Rev. Lett. 106, 041803 (2011); arXiv:1010.0991.
- (15) V. Tishchenko et al., arXiv:1211.0960.
- (16) H. Überall, Phys. Rev. 119, 365 (1960).
- (17) H. Von Baeyer and D. Leiter, Phys. Rev. A 19, 1371 (1979).
- (18) V.A. Andreev et al.(MuSan Collaboration), arxiv: 1004.1754.
- (19) V. Duginov et al., ”Letter of Intent on an Experiment to search for muonium decay ”. Submitted to PSI, December 15, 2012; S.N. Gninenko, talk given at the Open Users Meeting BV44, PSI, January 15, 2013.