Comprehensive Detection of Genes Causing a Phenotype using Phenotype Sequencing and Pathway Analysis
Abstract.
Discovering all the genetic causes of a phenotype is an important goal in functional genomics. In this paper we combine an experimental design for multiple independent detections of the genetic causes of a phenotype, with a high-throughput sequencing analysis that maximizes sensitivity for comprehensively identifying them. Testing this approach on a set of 24 mutant strains generated for a metabolic phenotype with many known genetic causes, we show that this pathway-based phenotype sequencing analysis greatly improves sensitivity of detection compared with previous methods, and reveals a wide range of pathways that can cause this phenotype. We demonstrate our approach on a metabolic re-engineering phenotype, the PEP/OAA metabolic node in E. coli, which is crucial to a substantial number of metabolic pathways and under renewed interest for biofuel research. Out of 2157 mutations in these strains, pathway-phenoseq discriminated just five gene groups (12 genes) as statistically significant causes of the phenotype. Experimentally, these five gene groups, and the next two high-scoring pathway-phenoseq groups, either have a clear connection to the PEP metabolite level or offer an alternative path of producing oxaloacetate (OAA), and thus clearly explain the phenotype. These high-scoring gene groups also show strong evidence of positive selection pressure, compared with strictly neutral selection in the rest of the genome.
1. Introduction
Discovering what genes cause a specific phenotype poses several experimental and analytical challenges, and there are several approaches in the literature for causal gene identification including direct identification of causal mutations from naturally evolving populations growing in the prescence of isobutanol [38] [2] , using transposon insertions to detect antibiotic targets [49] , use of chemical mutagenesis to produce randomly generated mutants and subsequent high-throughput sequencing to identify key mutation [45] [55] [22] . In particular, the method described in [22] , called phenotype sequencing, combines the last approach with sequencing techniques to produce more information at a substantially reduced total cost. See [11] and [10] for more on pooling methods.
Many such methods, while successful, have substantial drawbacks in terms of efficiency and comprehensivity of detection, total labor required to create mutants and verify mutations as causal, and overall cost. Unless the mutagenesis density is very low, there can be many mutations that must be checked; if there is only a single mutation in each mutant, causes of complex phenotypes requiring more than one mutation may be missed. Naturally evolved strains typically both have fewer mutations (10-20 typically) and a larger fraction of these directly contribute to the phenotype [24] [50] [47] [29] [33] [6] , with in some cases as few as 3 mutations per strain [23] [7] or more than 40 [48] . On the other hand, natural evolution typically involves a mixture of many mutants competing with each other. Even small differences in selective advantage will tend to give a winner-take-all outcome, in which the “top” mutant takes over the culture, and other causes of the phenotype are obscured. This can occur even over a relatively short period of competitive culture (illustrated in Fig. 1). Hence if mutants are allowed to compete, detection of smaller contributors to the phenotype can be washed out by the growth of other mutants. This means that only some of the causes of a particular phenotype will be detected. In particular, if there is a “trivial” way to get the phenotype, this can obscure the interesting, non-obvious causes of the phenotype.
While mutagenesis can aid the production of mutants with the desired phenotype, it also elevates the total number of mutations in each strain (often 50 - 100 mutations [39] [31] , of which perhaps only one actually causes the phenotype). Dissecting these many candidate mutations experimentally can be laborious, so we employ statistical methods to detect which mutations are most likely to be causal.
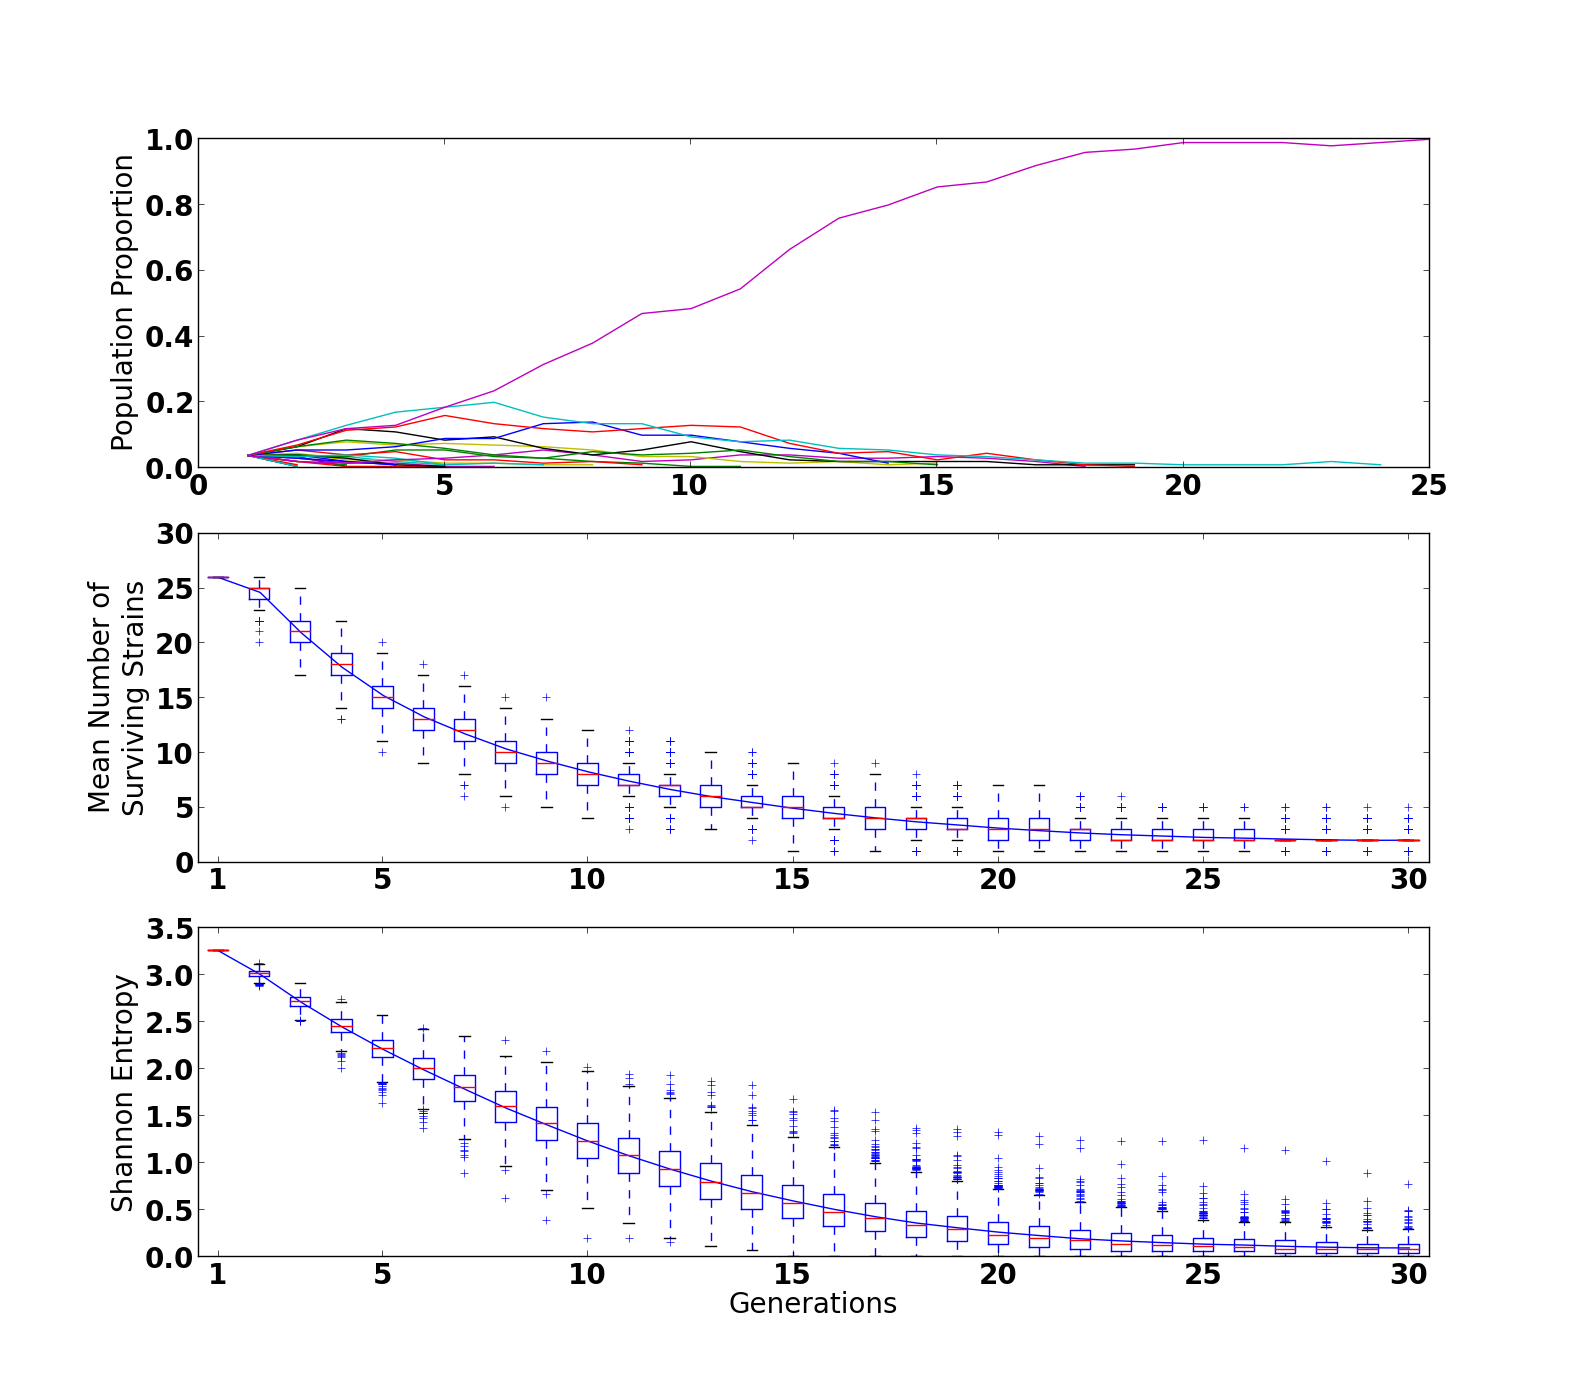
A. (Top) a simulation of 26 strains of various fitnesses that grow exponentially from a founder population of individual mutants to a carrying capacity under Wright-Fisher selection dynamics. The results of a single simulation show that one mutant dominates the population after a small number of generations. Note diversity is lost due not only to selection, but also genetic drift.
B. (Middle) As reproduction and selection proceeds, the mean number of distinct strains decreases very quickly. On average half of the strains are lost after just 6-7 generations.
C. (Bottom) Similarly, the mean Shannon entropy [8] of the population distribution also decreases quickly. This differs from (B) in that the population proportions are also taken into account.
Given these challenges, it would be very useful to have reliable high-throughput methods for comprehensively identifying all the genetic causes of a phenotype. Three features seem crucial for this goal. First, sufficient mutagenesis coverage is required to hit all the potential causes of the phenotype. Note this may require mutating two or more genes simultaneously to achieve the desired phenotype. For a gene to be identified with any kind of statistical significance in a high-throughput (genome-wide) analysis, the “target” set of mutations in a gene that can actually cause the phenotype must be hit not just once but multiple times in independent strains. Second, the different mutant strains (representing independent mutagenesis events) must be screened non-competitively, e.g. by either picking only one colony from each independent experiment, or by forgoing long growth rescue in liquid medium to avoid multiple colonies arising from genetically identical daughter cells of a single mutant. This ensures that the different strains with the phenotype will be independent mutation events that represent an unbiased sampling of the diverse possible causes of the phenotype. High-throughput sequencing of the independent mutant strains, yielding the total number of times a gene is independently “hit” by mutations across all the strains, can then directly reveal genes that cause the phenotype [22] . We refer to this bioinformatic approach as “phenotype sequencing”. The results of the first phenotype sequencing experiment were further verified in the study by Minty et al [38] , which found specific causal mutations in many of the genes identified by phenotype sequencing (and also verified partially by [2] ; see also [43] ). We argue now that phenotype sequencing is self-validating and also present strength of selection measures to further statistically validate results.
Third, to attain sensitive and comprehensive discovery of the causal genes, the analysis must be able to combine signals across multiple genes that function together, e.g. in the same pathway. When multiple genes in a pathway can cause the same phenotype, this “splits” the signal (concretely, the number of observed mutations) among them, making it much harder to detect. For example, our first phenotype sequencing analysis did not obtain a statistically significant score for some genes that are known to cause the phenotype, even though they were relatively highly ranked (due to having more mutations than expected by random chance) [22] . Combining signals from multiple such genes in a pathway greatly improves sensitivity and hence allows for comprehensive discovery.
To assess the possibility of attaining these goals, we first developed a “pathway-phenoseq” analysis that combines mutation signals across each specified pathway. For this first test, we used pathway information from the EcoCyc database of functionally associated genes in E. coli [12] . Second, we tested its ability to discover the multiple genetic causes of a metabolic phenotype which is known to involve many genes and pathways. Third, in addition to validating its results against the experimental literature, we also developed bioinformatic validation methods based on gene clustering and independent measures of positive selection.
As an experimental test, we sought a phenotype that involves many pathways and where existing experimental literature could validate the results of our analysis. We therefore chose a metabolic phenotype, namely recovery of ability to grow on glucose by E. coli lacking the Phosphoenolpyruvate carboxylase (PPC). Metabolic engineering of the pyruvate - phosphoenolpyruvate (PEP) - oxaloacetate (OAA) node has long been studied as a way of modifying the energy balance of the cell [5] [28] [35] . Phosphoenolpyruvate carboxylase (PPC) carboxylates PEP to OAA while releasing inorganic phosphate. Phosphoenolpyruvate carboxykinase (PEPCK) decarboxylates OAA and activates it to PEP using ATP as a substrate. PEPCK is reversible in some organisms and the reverse PEPCK reaction is more energy efficient than the PPC reaction because it conserves the phosphate from PEP by generating ATP. In E. coli, however, PEPCK is not reversible under normal conditions. Recently, with the increased focus on renewable resources from microbes, optimization of the PEP/OAA metabolic node has received renewed interest. Much of the interest has focused on increasing the production of succinate (a high value carboxylic acid of industrial relevance) in E. coli and other microbes. In recent studies PPC has been supplemented or replaced with pyruvate carboxylase (PYK) [3] , and more often with PEPCK [17] , which increases the ATP pool of the cell. This can lead to higher levels of succinate production from a variety of feedstocks [14] . The use of PEPCK and the resulting higher ATP concentration has also been exploited to increase production of malate, OAA [40] or fumarate [52] and even the amount of recombinantly expressed proteins [27] .
Overexpressing either a native or heterologous pepck gene is one way to compensate for the knockout of ppc and rescue an OAA auxotroph strain. However, a number of other pathways affect OAA levels and flux through the PEP node.
Selection for growth in glucose medium of ppc- mutants has been studied via naturally evolved mutants, resulting in the creation of two mutant strains [19] . After 45 days of growth and selection, these mutants had growth rates and glucose consumption rates very similar to the wild type strain, more than double the ppc- strain on day 0. While the underlying genetic causes were not determined in this study, it was found that metabolic flux through the glyoxylate shunt (aceA and aceB) increased and that there was variable transcription of several genes, including decreased expression of ptsH and ptsI, subunits of PEP-dependent phosphotransferase systems (PTS). The glyoxylate shunt is an alternative route for the cell to make OAA. Decreased expression of the PTS systems is likely to increase PEP levels, as the cell will use sugar transport pathways that do not require PEP. This is consitent with a study in which mutations in PTS were found using a laboratory evolution setup selecting for increased growth and succinate production [13] . The mutations increased flux through PEPCK in the non-native direction [13] . In accordance with Le Chatelier’s principle, increasing the level of cellular PEP leads to higher reverse PEPCK activity. Similarly, high PEP levels could also drive flux through the glyoxylate shunt. Without extensive modeling of the metabolic network of the cell it is hard to predict a priori which mutations would be most beneficial to raising PEP levels.
As a more fundamental study of the paths that can circumvent PPC, we designed a very simple selection, not focused on succinate production, but rather looking at the many ways that E. coli can replenish OAA levels without PPC. A strain cannot grow on glucose alone because there is no anaplerotic supply of OAA to replenish the TCA cycle. Unlike previous reports, we did not eliminate pflB and therefore allowed for mutants that could supply OAA through means other than PEPCK (for example through TCA intermediates). We mutagenized the strain and selected for growth on glucose. By performing 24 independent mutagenesis and selection experiments we produced 24 separate mutant strains, identified mutations via pooled sequencing, and identified genetic causes via by pathway-phenoseq and gene-phenoseq.
2. Results
Sequencing of Independent Mutants
Using growth on glucose medium as a selection, 24 mutants with the desired phenotype were produced. The genomic DNA was pooled into 8 libraries each consisting of exactly three strains. These libraries were tagged, combined, and sequenced in a single lane of a high-throughput Illumina Hi-Seq sequencer. The resulting fragments were filtered, aligned to the reference E. coli K-12 substr. MG1655 genome sequence, and scanned for sequence variants. Sequencing produced 145 million reads of 100 basepairs each for a total of 14.5 Gb of genomic sequence, of which approximately 118 million reads successfully demultiplexed (had an identifiable tag) and aligned to the reference genome. From the pooled libraries, we identified 2157 SNPS (1450 nonsynonymous, 707 synonymous) after filtering for quality and strand bias (see methods). These SNPs showed a strong preference for GC-sites in line with the mutagenesis spectrum of NTG [21] . SNPs were detected in 1348 genes; 1012 genes had one or more nonsynonymous mutations.
Pathway-Phenoseq Analysis
We developed a method for scoring individual pathways, based on the number of non-synonymous mutations occurring in genes in each pathway (see Method for details). As a comprehensive set of E. coli pathway annotations, we used the EcoCyc Functionally Associated Groups database, totaling 536 groups [12] , of which 336 were hit by non-synonymous mutations in our sequencing dataset. (For simplicity, we will refer to these EcoCyc Functionally Associated Groups as “pathways”). We applied our scoring method (which we will refer to throughout as “pathway-phenoseq”) to all 336 pathways, and ranked them by their p-values (Table 1). After the Bonferroni multiple hypothesis correction, the top five pathways (containing 12 genes total) were statistically significant.
| Group | Genes | p-value (phenoseq) |
|---|---|---|
| PD04099 | aceK iclR | |
| CPLX0-2101 | malE malF malG malK lamB | |
| ABC-16-CPLX | malF malE malG malK | |
| PD00237 | malS malT | |
| GLYCOGENSYNTH-PWY | glgA glgB glgC | |
| CPLX-155 | chbA chbB chbC ptsH ptsI | |
| PWY0-321 | paaZ paaA paaB paaC paaD paaE paaF paaG paaH paaJ paaK | |
| RNAP54-CPLX | rpoA rpoB rpoC rpoN | |
| APORNAP-CPLX | rpoA rpoB rpoC | |
| APORNAP-CPLX | rpoA rpoB rpoC rpoD |
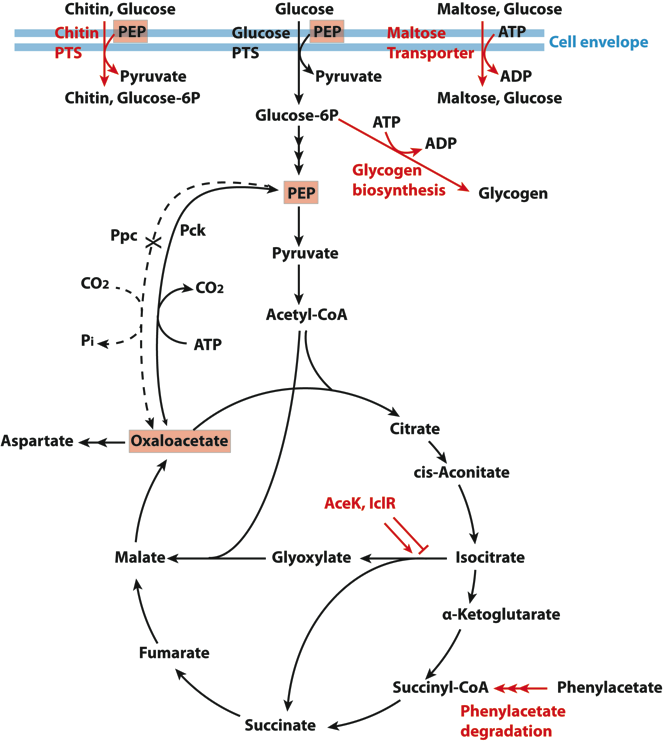
Overall, the top seven pathway-phenoseq scoring pathways either have a clear connection to the PEP metabolite level or offer an alternative path of producing oxaloacetate (OAA), and thus fit the growth phenotype (Figure 2). PD04099 (aceK and iclR) regulates the glyoxylate shunt [9] , [36] , which is an alternative way of producing OAA. By deregulating this pathway acetyl-CoA can be used to regenerate OAA instead of being completely consumed by the TCA cycle [30] . In fact iclR has been deliberately mutated for biotechnology applications to increase flux through the glyoxylate shunt and increase yields of biomass or desired products [51] . The next three association groups (CPLX0-2101, ABC-16-CPLX, and PD00237) relate to the maltose transport pathway. If deregulated the maltose transporter can transport glucose using ATP as energy, instead of PEP like the PTS system [4] . Therefore deregulation of this group would increase PEP levels. The fifth association group GLYCOGENSYNTH-PWY identified involves mutations in the glycogen synthesis pathway. Any mutations that decrease activity of this pathway would increase glucose and ATP levels of the cell and therefore decrease the PEP requirement of glucose transport. These mutations are again correlated with increasing cellular PEP levels. The chb (chitin PTS transport) pathway CPLX-155 (association group six) is another sugar transport pathway that requires PEP [26] . Any mutations that downregulate or deactivate this pathway lead to an increased pool of PEP in the cell, again consistent with the selection performed. The genes ptsH and ptsI encode general subunits of PTS systems that are required for transport and phosphorylation of all sugars [44] . Therefore, PEP-dependent sugar transport in general is affected by these mutations. In addition to hits in ptsHI, mutations were also found in crr, the regulator responsible for PEP-dependent transporters. We found mutations in sugar specific subunits of several other PTS systems, however we would need more data to boost the signal and determine which are significant. The seventh association group (PWY0-321) found in our selection encompasses genes of the phenylacetate degradation pathway [15] . Like the first association group, this pathway answers the selection not by increasing PEP levels, but instead by supplying OAA through another TCA intermediate (See Figure 2). The final product of the phenylacetate degradation pathway is succinyl-CoA, a TCA intermediate that can be metabolized to OAA. All of the identified hits are relevant to OAA levels, either by affecting PEP pools or by supplying direct precursors of OAA. Many of the hits identified here were not among those that have been rationally explored by metabolic engineers interested in the PEP/OAA node. This indicates that there is great value in performing high throughput evolution and sequencing experiments such as these to identify new avenues of metabolic modifications relevant to a pathway of interest. The final pathways in Table 1 consist of rpoABC and rpoD and N genes which affect gene expression globally. Mutations in these genes can have widespread effects on gene expression. We do not know the precise mechanisms of how these mutations may affect the observed phenotype.
Comparison with Gene-phenoseq
By contrast, gene-phenoseq identified only three of these genes (iclR and aceK in pathway PD04099; malT in pathway PD00237) as statistically significant (Table 2). Thus pathway-phenoseq detected more than twice as many causal pathways for this phenotype, and four times as many genes as the gene-phenoseq scoring.
| Gene | p-value |
|---|---|
| iclR | |
| aceK | |
| malT | |
| malE | |
| yjbH | |
| rplL | |
| ydfJ | |
| pgi | |
| yhcA | |
| tyrS | |
| yjaG | |
| yeeN | |
| tig | |
| glgB | |
| fdhF | |
| gntT | |
| dbpA | |
| ydfl | |
| lysC | |
| xylE |
Bioinformatic Validation Tests
As an additional test of the entire set of top scoring pathways, we computed a p-value for evidence of positive selection (Ka/Ks > 1) within this set (Table 3). Whereas the phenoseq scoring is based on the total number of mutations in a region, the Ka/Ks is based on the ratio of non-synonymous vs. synonymous mutations (note that the latter are not considered by the phenoseq scoring function). The Ka/Ks ratio for the total dataset of 2157 SNPs was 1.0026, consistent with neutral selection, as expected from random mutagenesis. We therefore computed a p-value for the null hypothesis that mutations in the top pathways are drawn from the same background distribution as the total set of mutations (i.e. neutral) using the Fisher Exact Test (see Methods for details). The top 10 pathway-phenoseq pathways contained a total of 103 non-synonymous mutations vs. only 21 synonymous mutations, yielding a p-value of . This is strong evidence of positive selection. Even leaving out the genes detected by gene-phenoseq (iclR, aceK, malT), the p-value is . Furthermore, this evidence of positive selection extends throughout the top ten pathways. For example, if one leaves out pathways 6 through 10, the p-value becomes weaker (, or again leaving out iclR, aceK, malT, 0.056). Indeed the p-value becomes stronger (smaller p-value) with each additional pathway added to the analysis, indicating that each pathway shows evidence of positive selection. Note that at the level of single-gene analysis, only one gene (iclR with 19 non-synonymous mutations and 1 synonymous mutation) could be detected as showing statistically significant evidence of positive selection (); other genes simply did not have enough total mutation counts to attain significance.
| Pathway | cumulative p-value | excluding iclR, aceK, malT |
|---|---|---|
| PD04099 | 0.0037 | N/A |
| CPLX0-2101 | 0.0044 | 0.28 |
| ABC-16-CPLX | 0.0027 | 0.28 |
| PD00237 | 0.0027 | 0.29 |
| GLYCOGENSYNTH-PWY | 0.0020 | 0.19 |
| CPLX-155 | 0.00043 | 0.056 |
| PWY0-321 | 0.000068 | 0.011 |
| RNAP54-CPLX | 0.000043 | 0.0063 |
| APORNAP-CPLX | 0.000043 | 0.0063 |
| APORNAP-CPLX | 0.000034 | 0.0051 |
It is interesting to ask what fraction of the genes in these pathways show evidence of causing the phenotype. It is evident (e.g. from the known experimentally validated genes) that real causal genes are present far below the 0.05 significance threshold of gene-phenoseq scoring (also found to be the case in a previous phenotype sequencing experiment [22] .) To assess this, we took the top 50 gene-phenoseq genes, and asked what pathways were strongly enriched (Table 4). Given a top list of genes, one can assess whether they cluster within specific subgroups of a standard functional annotation using the hypergeometric p-value test [20] . This analysis identified statistically significant clustering within three EcoCyc pathways. Furthermore, six of the top ten pathways matched the top 10 pathway-phenoseq pathways. These data indicate that at least 9 of the genes in these pathways contribute causally to the phenotype (since they were individually detected among the top 50 gene-phenoseq hits). Only 28 pathways intersected the top 50 list.
| Group | Genes | Genes in top 20 | p-value (hypergeometric) |
|---|---|---|---|
| ABC-16-CPLX | malF malE malG malK | ||
| PD04099 | aceK iclR | ||
| CPLX0-2101 | malE malF malG malK lamB | ||
| CPLX-63 | torY torZ | ||
| PD00237 | malS malT | ||
| ABC-42-CPLX | alsA alsB alsC | ||
| APORNAP-CPLX | rpoA rpoB rpoC | ||
| GLYCOGENSYNTH-PWY | glgA glgB glgC | ||
| SECE-G-Y-CPLX | secE secG secY | ||
| CPLX0-221 | rpoA rpoB rpoC fecI |
Causal Mutations Analysis
Finally, we sought to estimate the number of mutations in each group that actually help cause the phenotype (“causal mutations”). In principle, one can estimate this from the observed bias towards non-synonymous mutations (compared with that expected under neutral selection as observed in the total dataset). Specifically, we assume that all causal mutations must be non-synonymous, whereas non-causal mutations are drawn from the background mixture of synonymous + non-synonymous mutations (i.e. neutral selection). We can then estimate the fraction of mutations in each pathway that are causal, since the observed fraction of non-synonymous mutations in a pathway will reflect the mix of causal vs. non-causal mutations:
where is the fraction of non-synonymous mutations observed in the entire dataset (which almost exactly matches that expected for neutral selection). Then
We then estimated the number of causal mutations in a pathway as , where N is the total number of mutations observed in the pathway (Table 5). It is striking, for example, that the estimated number of causal mutations in the top pathway (iclR + aceK) precisely equals the number of independent mutant strains sequenced (24). This suggests that each strain with this phenotype was mutated once in this pathway. The number of causal mutations estimated in the remaining pathways ranged from 4 to 9, suggesting that at least one additional mutation in these other pathways was present in each strain. For each pool of three strains, at least three nonsynonymous mutations were observed in the (iclR + aceK) pathway, so our data is consistent with the hypothesis that there must be a mutation in this pathway to achieve the phenotype.
| Group | Synonymous Mutations | Non-synonymous Mutations | Causal Mutations |
|---|---|---|---|
| PD04099 | 5 | 34 | 24 |
| CPLX0-2101 / ABC-16-CPLX | 6 | 18 | 6 |
| PD00237 | 3 | 11 | 5 |
| GLYCOGENSYNTH-PWY | 3 | 10 | 4 |
| CPLX-155 | 0 | 7 | 7 |
| PWY0-321 | 1 | 11 | 9 |
| RNAP54-CPLX / APORNAP-CPLX / APORNAP-CPLX | 3 | 12 | 6 |
3. Discussion
These data show first that pathway-phenoseq greatly improves sensitivity and comprehensive discovery of the genetic causes of a phenotype, over gene-phenoseq. It detected a statistically significant signal for more than two times as many pathways, and an even greater proportion of genes. Second, our results indicate that independent (non-competitive) mutant strains do indeed reveal a wide variety of genetic causes of a phenotype, in this case: regulators of the glyoxylate shunt; the maltose transport pathway; the glycogen synthesis pathway; and the phosphotransferase system. Third, our analysis suggests that the phenoseq approach is far more sensitive for detecting such “selection loci” than standard measures of selection such as Ka/Ks or dn/ds. For example phenoseq detected a single pathway with a p-value of (Bonferroni- corrected), compared with a positive selection p-value on the same pathway of 0.0037 (not even Bonferroni-corrected).
We now consider some further implications and challenges in this work. First, it is evident that the number of mutant strains sequenced both in this study (24) and the previous isobutanol tolerance study (32) are inadequate for definitively identifying all genes that contribute to these phenotypes. That is, our results (and other experimental studies) have shown clear evidence for a number of genes causing this phenotype, that failed to attain statistical significance in the gene-phenoseq scoring, e.g. PEPCK mutations were not statistically significant in our study. In many cases gene-phenoseq scoring ranked these genes highly, but the sample size simply was not large enough to yield a strong p-value. This reflects a fact about our two phenotypes which may apply generally to many other phenotypes: they are complex, and involve many genes, more than can be reliably detected by gene-phenoseq with sequencing of 30 mutant strains. It also illustrates why pathway-phenoseq is needed: in our (admitedly limited) experience, inadequate sensitivity is the key factor limiting discovery.
Second, the same general approach should be applicable to other mutagens and types of mutations. As a minor example, in the current study we did analyze promoter mutations (separately from coding-region mutations), but did not find any significant results (data not shown). The same basic analysis should be applicable to deletion mutations, transposon insert events and any other mutational process for which one can build an adequate neutral model. In the worst case, one could simply obtain data for a control set of strains (i.e. mutated but not screened for the phenotype), to provide an empirical model of the mutational bias of the set of genes, that would be used as the null (non-target) model for scoring the results observed after phenotype screening.
Third, it seems interesting to ask how many causal mutations are required to produce the phenotype. We have presented a very simplistic way of estimating the number of mutations in each pathway that are actually causal. This already seems to yield intriguing suggestions, for example that the top pathway (glyoxylate shunt regulation) is mutated in essentially every strain that has the phenotype, and that this is typically accompanied by a “second mutation” in another pathway. It seems likely that more sophisticated approaches to this question will yield useful insights. This is but one example of exploring positive selection signals (concretely, by taking synonymous mutations into account, which phenoseq ignores). Another possible application of positive selection data is suggested by our Table 3: whereas the total mutation dataset is unequivocally neutral (Ka/Ks=1), the top-ranking pathways show clear evidence of positive selection (Ka/Ks > 1). Thus, it would be interesting to determine (via a robust probabilistic analysis) how far down the list of top-ranked phenoseq pathways this positive selection signal goes (i.e. where does it revert to neutrality). In principle, this could provide a measure of the depth of phenotype selection in the dataset, independent of the phenoseq p-value.
For the specific phenotype under study, we found that there appears to be a causal mutation in the regulatory pathway (iclR and aceK) of the glyoxylate shunt (aceA and aceB) in every strain (Table 5). Once activated, the shunt is then driven by a secondary mutation in another pathway that alters the levels of PEP and/or OAA in the cell. This is consistent with an earlier study [19] which produced two (naturally evolved) ppc- mutants able to grow in a glucose medium, both of which had increased flux through the glyoxylate shunt as well as decreased expression of ptsH or ptsI (our sixth ranked pathway), however the mutants in that study were not sequenced, so it is not known which genes were mutated. Moreover, selection strength analysis (Table 3) shows that there is evidence of positive selection in pathways beyond the top phenotype sequencing ranked pathway (iclR + AceK). It may be the case that the top pathway is effectively larger since it is potentially more likely that a causal mutation occurs in a regulatory gene than in an enzymatic gene (which may have a far smaller active region). Regardless, a mutation in the regulatory pathway is evidently not sufficient to induce the phenotype. Similarly, it is possible that, in order to see PEPCK reversal, PEP levels must be significantly elevated and pck must be deregulated. Our experiment may not have contained a large enough sample size to accommodate both of these requirements. In other studies the elevated PEP levels are often artificially achieved through pflB knockouts.
Finally, we must consider organisms where pathway annotation is lacking (compared with the high level of pathway annotation for E. coli). In principle, any source of functional groupings of genes (for example “Rosetta Stone”, phylogenetic profiles and related non-homology approaches) could be used, in the absence of human-curated pathway annotations. Another interesting possibility is to invert the problem: given a diverse set of easily screenable phenotypes, one could systematically perform phenotype sequencing on many such phenotypes, to obtain observed groupings of genes that appear to “function together” in the sense of causing the same phenotype(s). Note that in contrast with a typical “functional correlation” analysis (such as on expression levels), even seeing a pair of genes as correlated by a single data point (i.e. both causing one phenotype) would actually be significant. Thus far fewer phenotypes would have to be studied to obtain significant results, than for other functional correlation analyses such as expression levels. Thus phenotype sequencing could itself be used as a high-throughput method for finding functional groupings of genes in less well studied microbial organisms.
4. Methods
Bacterial strains and growth conditions
For strain construction and to prepare samples for NTG mutagenesis strains were grown in standard Luria Bertani medium [46] . Under selective conditions strains were grown in a modified M9 medium (6 g , 3 g , 1 g , 0.5 g NaCl, 1 mM , 1 mM , 10 mg vitamin B1 per liter of water) containing 1% glucose.
Mutagenesis was performed on parent strain . This strain was generated by P1 transduction to delete ppc from E. coli strain coli JCL16 (BW25113/F’ [traD36, proAB+, lacIq ZDM15]) [1] , using strain JW3928 from the Keio collection as a P1 donor [16] . This strain is unable to grow on glucose minimal medium.
NTG mutagenesis and selections
Random mutagenesis was performed with N’-nitro-N-nitrosoguanidine (NTG) as previously described [37] . Briefly, cultures of were grown to exponential phase in LB medium, washed twice with 0.1M citrate buffer and then concentrated two-fold by centrifugation and suspension in 0.1 M citrate buffer (pH 5.5). Samples of 2mL were exposed to N’-nitro-N-nitrosoguanidine (NTG) at a final concentration of 50 mg/ml for 30 minutes at 37°C to reach a percentage kill of approximately 50%. The cells were washed twice with 0.1 M phosphate buffer (pH 7.0) and grown in LB for one hour. The cells were then challenged by plating on glucose minimal medium and grown at 37°C for 3 days. This procedure was performed on 24 separate samples of , each of which was plated separately to ensure genetically distinct populations of mutants. One colony from each separate NTG experiment was selected, restreaked on selective medium plates to verify the phenotype and then cultured in liquid medium to obtain genomic DNA.
DNA library preparation and sequencing
Bacterial genomic DNA was prepared from 24 mutant strains using the DNEasy kit from Qiagen using the optional RNAse treatments. The isolated genomic DNA from the mutant strains was pooled in 8 pools, each at a total concentration of 20ng/L. Equal amounts of DNA from 3 mutant strains were mixed in each of the 8 pools. The pooled samples were then fragmented by sonication to an average size of 100–250 bp and confirmed by gel electrophoresis. 8 tagged genomic sequencing libraries (8 different indexes) were constructed using the TruSeq DNA Sample Prep Oligo Kit following the low throughput protocols provided by the manufacturer (Illumina). The final concentration of each of the 8 indexed libraries was measured by QuantiFluor assay and the 8 libraries were mixed in equal proportion at a final concentration of 10nM. 100bp single end read sequencing was carried out on a single lane of an Illumina Genome Analyzer HiSeq 2000 instrument by the UCLA Broad Stem Cell Research Center High Throughput Sequencing Facility.
Pathway-Phenoseq Analysis
Short read data were aligned to the reference E. coli genome (Genbank accession NC_000913) using Novoalign (Novocraft, Selangor, Malaysia) in single-end mode. Sequence variants were then called using samtools [34] mpileup and bcftools output to VCF format. Only single nucleotide substitutions were found via this analysis, consistent with NTG mutagenesis. We then employed our phenoseq software package to apply a succession of variant filters:
-
•
we excluded variants with inadequate samtools quality scores. Specifically, we required a QUAL value of greater than 90.
-
•
we excluded reported variants with strong evidence of strand bias (i.e. the evidence for the variant came primarily from reads in one direction but not the other). Specifically, we excluded variants with a samtools AF1 p-value of less than . This eliminated a large number of variant calls that appear to have been sequencing errors.
-
•
we excluded variants with samtools allele frequency estimate greater than 50% in any given pool. Concretely, each independent mutant strain is expected to have different mutations, so each mutation should be present in only one out of three of the strains mixed together in one pool.
-
•
we excluded variants that were found in multiple tagged pools. In all cases these were found in all 8 pools, indicating that they were parental strain mutations (i.e. differences versus the reference genome sequence).
We then used the EcoCyc functionally associated gene groups to score pathways as follows:
-
•
we only included non-synonymous mutations in the phenoseq analysis. Specifically, we used the Pygr software package [32] to map the Genbank CDS annotations on the reference genome, to map mutations to CDS (gene) intervals, and to determine their effect on the amino acid translation. Mutations that did not map to a CDS, or did not alter the amino acid translation, were excluded.
-
•
CDS-mapped mutations were mapped to each EcoCyc group using the EcoCyc database.
-
•
The expected mutational cross-section for each EcoCyc group was calculated based on its GC composition, and the total density of all observed mutations on GC sites vs. AT sites over the whole genome.
-
•
We computed a p-value for the null hypothesis that the observed mutations in an EcoCyc pathway were obtained by random chance, under a Poisson model
These calculations were performed with the scipy.stats module [25].
-
•
We applied a Bonferroni correction to this p-value by multiplying by the total number of EcoCyc pathways groups .
We performed positive selection tests on these EcoCyc pathway groups as follows:
-
•
for a given set of one or more EcoCyc pathways, we obtained the counts of non-synonymous vs. synonymous mutations in that set of pathways.
-
•
We computed the p-value for obtaining this result under a neutral (i.e. ), random model:
where N is the total number of all observed synonymous + non-synonymous mutations in the whole genome, and M is the total number of observed non-synonymous mutations in the whole genome. Specifically, we computed this p-value using the one-tailed (“greater”) Fisher Exact Test in R [42] .
-
•
Note that since only a single p-value test was performed (on the top-ranked set of pathways), no Bonferroni correction was applied.
Similarly, we computed p-values for pathway “enrichment” among the top 50 gene-phenoseq genes using the hypergeometric test, again computed using the Fisher Exact Test in R or scipy [25] , with a Bonferroni correction corresponding to the number of pathways that this test was applied to.
All of our code is available under an open source license at https://github.com/cjlee112/phenoseq.
5. Author Contributions
Conceived and designed the experiments: LG JCL MAH CJL. Performed the experiments: LG JCL. Analyzed the data: MAH CJL. Contributed reagents/materials/analysis tools: MAH CJL JCL. Wrote the paper: MAH LG CJL.
References
- 1. Shota Atsumi, Anthony F. Cann, Michael R. Connor, Claire R. Shen, Kevin M. Smith, Mark P. Brynildsen, Katherine J.Y. Chou, Taizo Hanai, and James C. Liao. Metabolic engineering of Escherichia coli for 1-butanol production. Metab Eng, 1:305–11, 2008.
- 2. Shota Atsumi, Tung-Yun Wu, Iara M.P. Machado, Wei-Chih Huang, Pao-Yang Chen, Matteo Pellegrini, and James C. Liao. Evolution, genomic analysis, and reconstruction of isobutanol tolerance in Escherichia coli. Mol Sys Biol, 6:DOI: MSB.2010.98, 2010.
- 3. M.D Blankschien, J.M. Clomburg, and Gonzalez. Metabolic engineering of Escherichia coli for the production of succinate from glycerol. Metabolic engineering, 12:409–419, 2010.
- 4. W. Boos and H. Shuman. Maltose/maltodextrin system of Escherichia coli: transport, metabolism, and regulation. Microbiology and molecular biology reviews : MMBR, 62:204–229, 1988.
- 5. Y.P. Chao and J.C Liao. Alteration of growth yield by overexpression of phosphoenolpyruvate carboxylase and phosphoenolpyruvate carboxykinase in Escherichia coli. Applied and environmental microbiology, 59:4261–4265, 1993.
- 6. P.E. Chen, K.M. Willner, A. Butani, S. Dorsey, M. George, A. Stewart, S.M. Lentz, C.E. Cook, A. Akmal, L.B. Price, P.S. Keim, A. Mateczun, T.N. Brahmbhatt, K.A. Bishop-Lilly, M.E. Zwick, T.D. Read, and S. Sozhamannan. Rapid identification of genetic modifications in Bacillus anthracis using whole genome draft sequences generated by 454 pyrosequencing. PLoS One, page e12397, 2010.
- 7. T.M. Conrad, A.R. Joyce, M.K. Applebee, C.L. Barrett, B Xie, Y Gao, and B.O. Palsson. Whole-genome resequencing of Escherichia coli K-12 MG1655 undergoing short-term laboratory evolution in lactate minimal media reveals flexible selection of adaptive mutations. Genome Biol, 1:R118, 2009.
- 8. T.M. Cover and J.A. Thomas. Elements of Information Theory. Wiley, New Yor, 1991.
- 9. A.J. Cozzone and M. El-Mansi. Control of isocitrate dehydrogenase catalytic activity by protein phosphorylation in Escherichia coli. Journal of molecular microbiology and biotechnology, 9:132–146, 2005.
- 10. Raineri Emanuele, Ferretti Luca, Esteve-Codina Anna, Nevado Bruno, Heath Simon, and Pérez-Enciso Miguel. Snp calling by sequencing pooled samples. BMC bioinformatics, 13:239, 2012.
- 11. Yaniv Erlich, Kenneth Chang, Assaf Gordon, Roy Ronen, Oron Navon, Michelle Rooks, and Gregory J Hannon. Dna sudoku—harnessing high-throughput sequencing for multiplexed specimen analysis. Genome research, 19(7):1243–1253, 2009.
- 12. I.M. Keseler et al. EcoCyc: A comprehensive view of Escherichia coli biology. Nucleic Acids Research, 37:D464–D470, 2011.
- 13. K. Jantama et al. Combining metabolic engineering and metabolic evolution to develop nonrecombinant strains of Escherichia coli C that produce succinate and malate. Biotechnology and bioengineering, 99:1140–1153, 2008.
- 14. R. Liu et al. Fermentation of xylose to succinate by enhancement of ATP supply in metabolically engineered Escherichia coli. Applied microbiology and biotechnology, 94:959–968, 2012.
- 15. R. Teufel et al. Bacterial phenylalanine and phenylacetate catabolic pathway revealed. Proceedings of the National Academy of Sciences of the United States of America, 107:14390–14395, 2010.
- 16. T. Baba et al. Construction of Escherichia coli K-12 in-frame, single-gene knock-out mutants: the Keio collection. Mol. Syst. Biol., 2:2006.0008, 2006.
- 17. X. Zhang et al. Metabolic evolution of energy-conserving pathways for succinate production in Escherichia coli. Proceedings of the National Academy of Sciences of the United States of America, 106:20180–20185, 2009.
- 18. W.J. Ewens. Mathematical population genetics: I. Theoretical introduction, volume 27. Springer, 2004.
- 19. S.S. Fong, A. Nanchen, B.O. Palsson, and U. Sauer. Latent pathway activation and increased pathway capacity enable Escherichia coli adaptation to loss of key metabolic enzymes. Journal of Biological Chemistry, 281(12):8024–8033, 2006.
- 20. Wen Fury, Franak Batliwalla, Peter Gregersen, and Wentian Li. Overlapping probabilities of top ranking gene lists, hypergeometric distribution, and stringency of gene selection criterion. In Proceedings of the 28th IEEE EMBS Annual International Conference, 2006.
- 21. M. Harper and C. Lee. Genome-wide analysis of mutagenesis bias and context sensitivity of N-methyl-N’-nitro-N-nitrosoguanidine (NTG). Mutation Research, 731:64–67, 2012.
- 22. Marc Harper, Stan Nelson, Zugen Chen, Lara Machado, James Liao, Traci Toy, and Chris Lee. Phenotype sequencing: identifying the genes that cause a phenotype directly from pooled sequencing of independent mutants. PLoS ONE, 6(2):e16517, 2011. doi:10.1371/journal.pone.0016517.
- 23. C.D. Herring, A. Raghunathan, C. Honisch, T. Patel, M.K. Applebee, A.R. Joyce, T.J. Albert, F.R. Blattner, D. van den Boom, C.R. Cantor, and B.O. Palsson. Comparative genome sequencing of Escherichia coli allows observation of bacterial evolution on a laboratory timescale. Nat Genet, 3:1406–12, 2006.
- 24. C. Honisch, A. Raghunathan, C.R. Cantor, B.O. Palsson, and D. van den Boom. High-throughput mutation detection underlying adaptive evolution of Escherichia coli-K12. Genome Res, 14:2495–502, 2004.
- 25. Eric Jones, Travis Oliphant, Pearu Peterson, et al. SciPy: Open source scientific tools for Python, 2001–.
- 26. N.O. Keyhani, L.X. Wang, Y.C. Lee, and S. Roseman. The chitin disaccharide, N,N’-diacetylchitobiose, is catabolized by Escherichia coli and is transported/phosphorylated by the phosphoenolpyruvate:glycose phosphotransferase system. The Journal of biological chemistry, 275:33084–33090, 2000.
- 27. H.J Kim, Y.D. Kwon, S.Y. Lee, and P. Kim. An engineered Escherichia coli having a high intracellular level of atp and enhanced recombinant protein production. Applied Microbiology and Biotechnology, 94:1079–1086, 2012.
- 28. P. Kim, M. Laivenieks, C. Vieille, and J.G. Zeikus. Effect of overexpression of Actinobacillus succinogenes phosphoenolpyruvate carboxykinase on succinate production in Escherichia coli. Applied and environmental microbiology, 70:1238–1241, 2004.
- 29. J. Klockgether, A. Munder, J. Neugebauer, C.F. Davenport, F. Stanke, K.D. Larbig, S. Heeb, U. Schöck, T.M. Pohl, L. Wiehlmann, and B. Tümmler. Genome diversity of Pseudomonas aeruginosa PAO1 laboratory strains. J Bacteriol, 19:1113–21, 2010.
- 30. H.L. Kornberg and H.A. Krebs. Synthesis of cell constituents from C2-units by a modified tricarboxylic acid cycle. Nature, 179:988–991, 1957.
- 31. S. Le Crom, W. Schackwitz, L. Pennacchio, J.K. Magnuson, and et al. Tracking the roots of cellulase hyperproduction by the fungus Trichoderma reesei using massively parallel DNA sequencing. Proc Natl Acad Sci, 10:16151–16156, 2009.
- 32. C.J. Lee, A. Alekseyenko, and C.T. Brown. Exploring the future of bioinformatics data sharing and mining with Pygr and Worldbase. SciPy, pages 62–67, 2009.
- 33. D.H. Lee and B.O. Palsson. Adaptive evolution of Escherichia coli K-12 MG1655 during growth on a nonnative carbon source, l-1,2-propanediol. App Env Microbiol, 7:4158–4168, 2010.
- 34. H. Li, B. Handsaker, A. Wysoker, T. Fennell, J. Ruan, N. Homer, G. Marth, G. Abecasis, R. Durbin, and 1000 Genome Project Data Processing Subgroup. The Sequence alignment/map (SAM) format and SAMtools. Bioinformatics, 25:2078–9, 2009.
- 35. J.C. Liao, Y.P. Chao, and R. Patnaik. Alteration of the biochemical valves in the central metabolism of Escherichia coli. Annals of the New York Academy of Sciences, 745:21–34, 1994.
- 36. S.R. Maloy and W.D. Nunn. Genetic regulation of the glyoxylate shunt in Escherichia coli K-12. Journal of bacteriology, 149:173–180, 1982.
- 37. J.H. Miller. Experiments in Molecular Genetics. Cold Spring Harbor Laboratory, 1972.
- 38. Jeremy J Minty, Ann A Lesnefsky, Fengming Lin, Yu Chen, Ted A Zaroff, Artur B Veloso, Bin Xie, Catie A McConnell, Rebecca J Ward, Donald R Schwartz, et al. Evolution combined with genomic study elucidates genetic bases of isobutanol tolerance in escherichia coli. Microb Cell Fact, 10:18, 2011.
- 39. J. Ohnishi, H. Mizoguchi, S. Takeno, and M. Ikeda. Characterization of mutations induced by N-methyl-N’-nitro-N-nitrosoguanidine in an industrial Corynebacterium glutamicum strain. Mutat Res, 64:239–244, 2008.
- 40. S. Park, K.S. Chang, E. Jin, S.P. Pack, and J. Lee. Oxaloacetate and malate production in engineered Escherichia coli by expression of codon-optimized phosphoenolpyruvate carboxylase2 gene from Dunaliella salina. Bioprocess and biosystems engineering, 36:127–31, 2012.
- 41. L. Peng, M.J. Arauzo-Bravo, and K. Shimizu. Metabolic flux analysis for a ppc mutant Escherichia coli based on 13C-labelling experiments together with enzyme activity assays and intracellular metabolite measurements. FEMS microbiology letters, 235(1):17–23, 2006.
- 42. R Core Team. R: A Language and Environment for Statistical Computing. R Foundation for Statistical Computing, Vienna, Austria, 2012. ISBN 3-900051-07-0.
- 43. Luis H Reyes, Maria P Almario, and Katy C Kao. Genomic library screens for genes involved in n-butanol tolerance in escherichia coli. PloS one, 6(3):e17678, 2011.
- 44. D.W. Saffen, K.A. Presper, T.L. Doering, and S. Roseman. Sugar transport by the bacterial phosphotransferase system. Molecular cloning and structural analysis of the Escherichia coli ptsH, ptsI, and crr genes. The Journal of biological chemistry, 262:16241–16253, 1987.
- 45. Sumeet Sarin, Vincent Bertrand, Henry Bigelow, Alexander Boyanov, Maria Doitsidou, Richard J Poole, Surinder Narula, and Oliver Hobert. Analysis of multiple ethyl methanesulfonate-mutagenized caenorhabditis elegans strains by whole-genome sequencing. Genetics, 185(2):417–430, 2010.
- 46. T.J. Silhavy, M.L. Berman, and L.W. Enquist. Experiments with Gene Fusions. Cold Spring Harbor Lab Press, 1984.
- 47. D.R. Smith, A.R. Quinlan, H.E. Peckham, K. Makowsky, W. Tao, B. Woolf, L. Shen, W.F. Donahue, N. Tusneem, M.P. Stromberg, D.A. Stewart, L. Zhang, S.S. Ranade, J.B. Warner, C.C. Lee, B.E. Coleman, Z. Zhang, S.F. McLaughlin, J.A. Malek, J.M. Sorenson, A.P. Blanchard, J. Chapman, D. Hillman, F. Chen, D.S. Rokhsar, K.J. McKernan, T.W. Jeffries, G.T. Marth, and P.M. Richardson. Rapid whole-genome mutational profiling using next-generation sequencing technologies. Genome Res, 1:1638–42, 2008.
- 48. A. Srivatsan, Y. Han, J. Peng, A.K. Tehranchi, R. Gibbs, J.D. Wang, and R. Chen. High-precision, whole-genome sequencing of laboratory strains facilitates genetic studies. PLoS Genet, page e1000139, 2009.
- 49. Timothy C Umland, L Wayne Schultz, Ulrike MacDonald, Janet M Beanan, Ruth Olson, and Thomas A Russo. In vivo-validated essential genes identified in acinetobacter baumannii by using human ascites overlap poorly with essential genes detected on laboratory media. mBio, 3(4), 2012.
- 50. G.J. Velicer, G. Raddatz, H. Keller, S. Deiss, C. Lanz, I. Dinkelacker, and S.C. Schuster. Comprehensive mutation identification in an evolved bacterial cooperator and its cheating ancestor. Proc Natl Acad Sci, 10:8108–12, 2006.
- 51. H. Waegeman, J. Beauprez, H. Moens, J. Maertens, M. De Mey, M.R. Foulquié-Moreno, J.J. Heijnen, D. Charlier, and W. Soetaert. Effect of iclR and arcA knockouts on biomass formation and metabolic fluxes in Escherichia coli K12 and its implications on understanding the metabolism of Escherichia coli BL21 (DE3). BMC microbiology, 11(1):70, 2011.
- 52. B. Zhang, C.D. Skory, and S.T. Yang. Metabolic engineering of Rhizopus oryzae: Effects of overexpressing pyc and pepc genes on fumaric acid biosynthesis from glucose. Metabolic engineering, 12:512–520, 2012.
- 53. X. Zhang, K. Jantama, J.C. Moore, L.R. Jarboe, K.T. Shanmugam, and L.O. Ingram. Metabolic evolution of energy-conserving pathways for succinate production in Escherichia coli. Proceedings of the National Academy of Sciences, 106(48):20180–20185, 2009.
- 54. X. Zhang, K. Jantama, KT Shanmugam, and LO Ingram. Reengineering Escherichia coli for succinate production in mineral salts medium. Applied and environmental microbiology, 75(24):7807–7813, 2009.
- 55. Ying Zhu, Hyung-gon Mang, Qi Sun, Jun Qian, Ashley Hipps, and Jian Hua. Gene discovery using mutagen-induced polymorphisms and deep sequencing: Application to plant disease resistance. Genetics, 192(1):139–146, 2012.