Observations of SN2011fe with INTEGRAL
Abstract:
SN2011fe was detected by the Palomar Transient Factory on August 24th 2011 in M101 few hours after the explosion. From the early spectra it was immediately realized that it was a Type Ia supernova thus making this event the brightest one discovered in the last twenty years. In this paper the observations performed with the instruments on board of INTEGRAL (SPI, IBIS/ISGRI, JEM-X and OMC) before and after the maximum of the optical light as well as the interpretation in terms of the existing models of –ray emission from such kind of supernovae are reported. All INTEGRAL high-energy have only been able to provide upper limits to the expected emission due to the decay of 56Ni. These bounds allow to reject explosions involving a massive white dwarf in the sub–Chandrasekhar scenario. On the other hand, the optical light curve obtained with the OMC camera suggests that the event was produced by a delayed detonation of a CO white dwarf that produced M of 56Ni. In this particular case, INTEGRAL would have only been able to detect the early –ray emission if the supernova had occurred at a distance of 2 -3 Mpc, although the brightest event could be visible up to distances larger by a factor two. The observation of a statistically representative sample of SNIa demands sensitivities of cm-2s-1keV-1.
1 Introduction
Type Ia supernovae (SNIa) are characterized by the lack of H–lines and the presence of Si II–lines in their optical spectra during the maximum of light as well as by the presence of Fe emission features during the nebular phase. Their optical light curve displays a sudden rise to the maximum followed by a rapid decay of mag in one month and by a slowly– fading tail. A noticeable property is the spectrophotometric homogeneity of the different outbursts. Furthermore, they appear in all kinds of galaxies including ellipticals. These properties point to an exploding object that is compact, free of hydrogen, that can be activated on short and long time scales, and is able to synthesize enough 56Ni to power the light curve. The most obvious candidate is a C/O white dwarf (WD) near the Chandrasekhar’s limit in a close binary system that explodes as a consequence of mass accretion [1].
Despite their homogeneity, SNIa display some differences when observed in detail. Now it is known that there is a group of SNIa with light curves showing very bright and broad peaks, the SN1991T class, that represents 9% of all the events. There is another group with a much dimmer and narrower peak and that lacks the characteristic secondary peak in the infrared, the SN1991bg class, that represents 15% of all the events. To these categories it has been recently added a new one that contains very peculiar supernovae, the SN2002cx or SNIax class, representing % of the total. These supernovae are characterized by high ionization spectral features in the pre-maximum, like the SN1991T class, a very low luminosity, and the lack of a secondary maximum in the infrared, like the SN1991bg class. The remaining ones, which amount to , present normal behaviors and are known as Branch-normal [2]. However, even the normal ones are not completely homogeneous and show different luminosities at maximum and light curves with different decline rates [3]. This variety has recently increased with the discovery of SN2001ay, which is characterized by a fast rise and a very slow decline [4]. This diversity strongly suggests that different scenarios and burning mechanisms could be operating in the explosion.
In one dimension models, the explosion mechanism can be classified as [5, 6]: the pure detonation model (DET), the pure deflagration model (DEF), the delayed detonation model (DDT), and the pulsating delayed detonation model (PDD). An additional class are the so called Sub–Chandrasekhar’s (SCh) models in which a detonation triggered by the ignition of He near the base of a freshly accreted helium layer completely burns the white dwarf. At present, there is no basic argument to reject any of them, except the DET ones that are incompatible with the properties of the spectrum of SNIa at maximum light. Present observations also pose severe constraints to the total amount of 56Ni that can be produced by the He–layer in SCh models. The equivalent models in three dimensions also exist, but with a larger variety of possibilities (see for instance [7]).
According to the nature of the binary, progenitors can be classified as single degenerate (SD) if the companion is a normal star [8] or double degenerate (DD) if the companion is a white dwarf [9, 10]. The distinction among them is important in order to interpret the observations since, depending on the case, the white dwarf can ignite below, near or above the Chandrasekhar’s mass and the total mass ejected as well as the mass of 56Ni synthesized can be different. It is not known if both scenarios can coexist or just one is enough to account for the supernova variety. Observations of the stellar content in the interior of known SNIa remnants point towards one possible SD candidate in the case of Tycho Supernova [11], two almost certain DD candidates, SNR0509-67.5 and SNR0519-69.0 [12, 13], and the new evidence that there is not a surviving companion in SN1006 [14].
The amount and distribution of the radioactive material produced in the explosion strongly depend on how the ignition starts and how the nuclear flame propagates [15, 16]. Therefore, the detection of –rays from supernovae could provide important insight on the nature of the progenitor and especially on the explosion mechanism. The advantages of using –rays for diagnostic purposes rely on their ability to distinguish among different isotopes and on the relative simplicity of their transport modelling. In the case of close enough outbursts, less than Mpc, it would be possible to obtain high quality –ray spectra that could allow to perform detailed comparisons with theoretical predictions. However, when more realistic distances are considered, the information provided by observations decreases drastically and only some outstanding features, like the intensity of the lines and of the continuum and the line profiles, have a chance to be detected [15]. Because of the scarcity of close enough events up to now it has only been possible to place upper limits to the SN1991T [17] and SN1998bu [18] events.
2 INTEGRAL observations of SN 2011fe
SN 2011fe (RA = 14:03:05.81, Dec = +54:16:25.4; J2000) was discovered in M101 on August 24th, 2011, day after the explosion [19]. The absence of hydrogen and helium, coupled with the presence of silicon in the spectrum clearly indicated it was a SNIa. The distance of M101, 6.4 Mpc, is slightly less than the maximum distance at which current gamma-ray instruments should be able to detect an intrinsically luminous SNIa. The closeness of SN2011fe has made it possible to obtain the tightest constraints on the supernova and its progenitor system, leaving only either DD or a few cases of SD as possible progenitor systems of this supernova.
| Early period | ||
| Energy band | Upper-limit flux | Instrument |
| (keV) | (photons s-1 cm-2) | |
| 3 - 10 | JEM-X | |
| 10 - 25 | JEM-X | |
| 3 - 25 | JEM-X | |
| 60 - 172 | IBIS/ISGRI | |
| 90 - 172 | IBIS/ISGRI | |
| 150 - 172 | IBIS/ISGRI | |
| 160 - 166 | SPI | |
| 140 - 175 | SPI | |
| 814 - 846 | SPI | |
| 800 - 900 | SPI | |
| Late period | ||
| Energy band | Upper-limit flux | Instrument |
| (keV) | (photons s-1 cm-2) | |
| 505 - 525 | SPI | |
| 830 - 875 | SPI | |
| 835 - 870 | SPI | |
| 1215-1275 | SPI | |
| 1220-1270 | SPI | |
| 1225-1265 | SPI | |
INTEGRAL observed this supernova with its four instruments (SPI, ISGRI/IBIS, JEM–X, and OMC) before the peak of the light curve, from August 29th to September 12th 2011 or, equivalently, from day to day after the explosion, and after the peak, from October 7th to November 19th, 2011 or, equivalently, from day to day . The early observations were essentially constrained by the Sun, that prevented the observation just after the optical maximum where the 56Ni lines are expected to peak. The results of JEM-X, ISGRI and SPI observations, displayed in Table 1, were only upper limits.
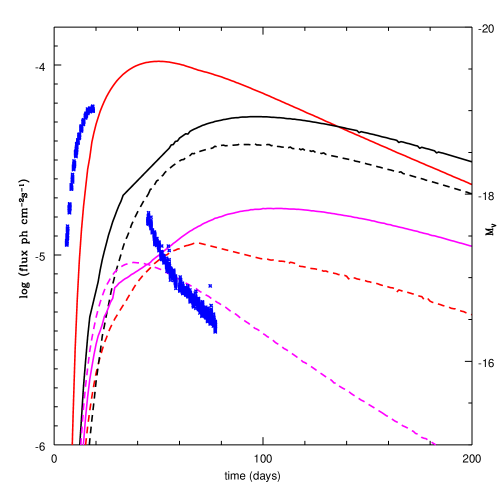
Figure 1 displays the light curve in the optical V–band obtained with the OMC. The magnitude at maximum was , thus indicating that SN2011fe was a slightly dim average SNIa. This light curve is well fitted with a delayed detonation model of a Chandrasekhar mass white dwarf igniting at g/cm3 and making the transition from deflagration to detonation at g/cm3. The corresponding decline parameter in the blue was in agreement with the Phillips relationship. The total amount of 56Ni synthesized in this way was in the range of M⊙ when the uncertainties in the values of the interstellar extinction are taken into account.
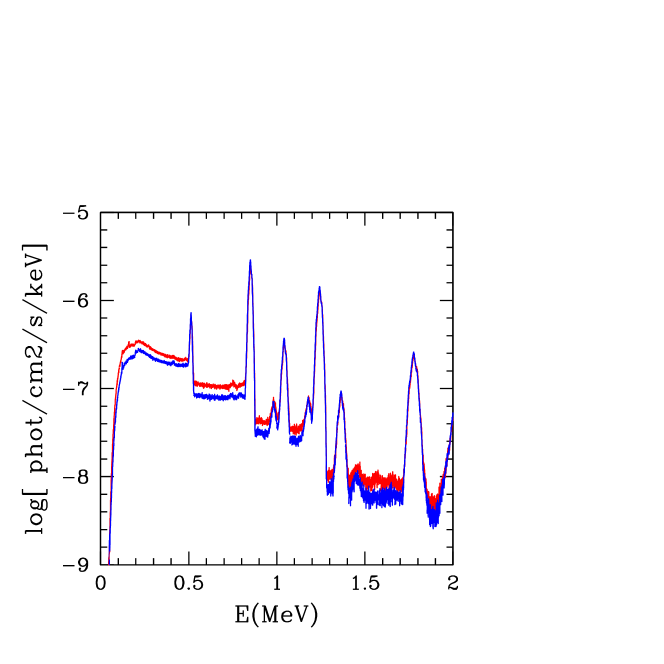
The expected gamma ray emission of the above model has been obtained with the code described in [15], which was successfully cross–checked with other independent codes [20]. Figure 1 displays the evolution with time of several important gamma ray features. The 200-540 keV band contains almost all the annihilation photons and it is the brightest feature. The 56Ni lines are characterized by their sharp rise and their relatively rapid decline as a consequence of the rapid expansion of the debris, with the corresponding increase of the transparency, and the relatively short lifetime of this isotope. The slow decline of the 812 keV line is a consequence of the overlapping with the growing 847 keV 56Co line. The 56Co lines have a more gentle growing and a slow decay as a consequence of the larger lifetime of the isotope and the increasing transparency of the envelope. Figure 2 displays the spectra 70 and 90 days after the explosion. The main characteristics, valid for almost every epoch, is the extremeley large width of the lines () as a consequence of Doppler and Compton broadening.
3 Discussion and conclusions
Besides the relative weakness of the source, the width of the lines and the rapid variation of their intensity are responsible for the non detection of SN2011fe by INTEGRAL. In the limit of weak signals [21], the significance is given by:
| (1) |
where is the effective observation time, is the effective area at the corresponding energies, is the flux (cm-2s-1) in the energy band , V is the volume of the detector and b is the specific noise rate (cm-3s-1keV-1), where it has been assumed that it is weakly dependent of the energy and time in the interval of interest. It is evident from Eq. 1 that if the photons produced by a nuclear transition are distributed over an energy band , the noise will grow as and the significance of the signal will decrease as compared with the thin line case. Table 2 displays the width that optimizes the signal to noise ratio at maximum in the DDTe case.
It is also evident from Eq. 1 that if the flux changes with time, the significance will also change since it will be a function of the total number of photons detected during the observation time. For instance, assume that the flux follows an exponential law like . The significance of the signal obtained integrating during the time interval is
| (2) |
For , it behaves as and has a maximum at in the general case. This dependence clearly shows the convenience to take a value of that maximizes the signal/noise ratio. Unfortunately, since the value of is not known a priori the optimal observing time is not known in advance [22].
| Energy (keV) | (keV) |
|---|---|
| 158 | 20 |
| 511 | 30 |
| 511 (band) | 340 |
| 812 | 35 |
| 847 | 27 |
| 1238 | 40 |
For instance, if we assume that the DDTe model (see Fig. 1) is representative of SN 2011fe, we see that at the beginning, when the emission is dominated by the 56Ni and ejecta are still opaque, there is a rapid growing of the intensity of the lines and only the last five days of the first period of observation are useful. On the contrary, when lines are dominated by the 56Co lines and matter is already transparent, the temporal behavior is more gentle, the above restriction does not apply and it is possible to follow a cumulative strategy of observation. Therefore, estimating in advance the significance of an observation demands a previous knowledge of the evolution of the shape and intensity of the line.
It is clear from the previous discussion that the detectability of a supernova not only depends on the distance but also on the subtype since the intensity of the radioactive lines is a function of the total amount of 56Ni synthesized and this quantity goes from M⊙ in the case of a superluminous SNIa to M⊙ in the case of a dim SNIax. Neglecting the last family and only taking the well classified events that appear in the catalog of the Sternberg Astronomical Institute, it turns out that to detect bright events per year it is necessary to achieve a sensitivity of the order of cm-2s-1keV-1. Of course, these figures are approximate, but they represent the frontier that allows to set up a systematic program of observation of SNIa or to consider these events as serendipitous ToO.
Acknowledgments.
This work has been supported by the MINECO-FEDER grants AYA2011-24704/ESP, AYA2011-24780/ESP, AYA2009-14648-C02-01, CONSOLIDER CSC2007-00050, by the ESF EUROCORES Program EuroGENESIS (MINECO grants EUI2009-04170), by the grant 2009SGR315 of the Generalitat de Catalunya. In parts, this work has also been supported by the NSF grants AST-0708855 and AST-1008962 to PAH. The INTEGRAL SPI project has been completed under the responsibility and leadership of CNES. We also acknowledge the INTEGRAL Project Scientist Chris Winkler (ESA, ESTEC) and the INTEGRAL personnel for their support to these observations.References
- [1] F. Hoyle, W.A. Fowler, Nucleosynthesis in Supernovae, ApJ 132 (1960) 565
- [2] W. Li, et al. Nearby supernova rates from the Lick Observatory Supernova Search - II. The observed luminosity functions and fractions of supernovae in a complete sample, MNRAS 412 (2011) 1441
- [3] W. Li, et al. Nearby supernova rates from the Lick Observatory Supernova Search - III. The rate-size relation, and the rates as a function of galaxy Hubble type and colour, MNRAS 412 (2011) 1473
- [4] E. Baron, et al. A Physical Model for SN 2001ay, a Normal, Bright, Extremely Slow Declining Type Ia Supernova, ApJ 753 (2012) 105
- [5] P. Hoeflich, et al., Maximum Brightness and Postmaximum Decline of Light Curves of Type IA Supernovae: A Comparison of Theory and Observations, ApJ bf 472 (1996) L81
- [6] W. Hillebrandt, J.C. Niemeyer, ARAA, Type IA Supernova Explosion Models 38 (2000) 191
- [7] E. Bravo, D. Garcia-Senz, Pulsating reverse detonation models of SNIa. I Detonation ignition, ApJ 695 (2009) 1244
- [8] J. Whelan, I. Iben, Binaries and Supernovae of Type I, ApJ 186 (1973) 1007
- [9] R.F. Webbink, Double white dwarfs as progenitors of R Coronae Borealis stars and Type I supernovae, ApJ 277 (1984) 355
- [10] I. Iben, A.V. Tutukov, On the evolution of close binaries with components of initial mass between 3 solar masses and 12 solar masses, ApJ 58 (1985) 661
- [11] P. Ruiz-Lapuente, et al., The binary progenitor of Tycho Brahe’s 1572 supernova, Nature 431 (2004) 1069
- [12] B.F. Schaefer, A. Pagnotta, An absence of ex-companion stars in the type Ia supernova remnant SNR 0509-67.5, Nature 481 (2012) 164
- [13] Z.I. Edwards, A. Pagnotta, B.E. Schaefer, The Progenitor of the Type Ia Supernova that Created SNR 0519-69.0 in the Large Magellanic Cloud, ApJ 747 (2012) L19
- [14] J.I. Gonzalez-Hernandez, et al., No surviving evolved companions of the progenitor of SN1006, Nature 489 (2012) 533
- [15] J.Gomez-Gomar, J. Isern, P. Jean, Prospects for Type IA supernova explosion mechanism identification with gamma rays, MNRAS 295 (1998) 1
- [16] J. Isern, E. Bravo, A. Hischmann, Detection and interpretation of -ray emission from SNIa, New Astr. Rev. 52 (2008) 377
- [17] G.G. Lichti, et al., COMPTEL upper limits on gamma-ray line emission from Supernova 1991T, AA 292 (1994) 569
- [18] R. Georgii, et al., COMPTEL upper limits for the 56Co gamma -ray emission from SN1998bu, AA 394 (2002) 517
- [19] P.E. Nugent, et al. , Supernova SN 2011fe from an exploding carbon-oxygen white dwarf star, Nature 480 (2011) 344
- [20] P.A. Milne, et al., Unified One-Dimensional Simulations of Gamma-Ray Line Emission from Type Ia Supernovae, ApJ 613 (2004) 1101
- [21] P. Jean, Etudes des performances et modelisation de spectrometres gamma pour l’Astrophysique Nucleaire, PhD Thesis, Universite Paul Sabatier, Toulouse (1996).
- [22] J. Isern, et al., Observation of SN2011fe with INTEGRAL. I. Pre-maximum phase, AA (2013), in press (arxiv 1302.3381)