The effect of fluctuations - thermal and otherwise - on the temperature dependence of thermopower in aromatic chain single-molecule junctions
Abstract
We report a theoretical study of the thermopower of single-molecule junctions, with focus on phenyl-based molecular junctions. In contrast to prior studies, thermal fluctuations of the torsional angle between the phenyl rings and variations in the position of the molecular level alignment with respect to the electrode Fermi energy were taken into account. Full thermopower histograms were obtained, and their dependence on the magnitude of the fluctuations was studied. We found that at large molecular orbital variations the thermopower becomes strongly dependent on the torsion angle and can even change sign. This results in a marked effect of fluctuations on the thermopower distribution, yielding an average thermopower at high temperatures that differs (smaller or larger) from the fluctuation-free value, depending on the strength of fluctuations. We therefore conclude that fluctuations should be taken into account both when extracting single-molecule parameters, such as the molecular level-Fermi level offset, and in predictions of the thermopower of molecular junctions.
I Introduction
Current interest in the thermopower of single-molecule junctions is focused on two interrelated directions. The first is the expectation that molecular junctions may become the basis for high-efficiency thermoelectric devices, due to their low thermal conductivity and the large variety of possible junction compositions Nitzan (2007); Dubi and Di Ventra (2011). The second is the notion that the thermoelectric response carries inherent information regarding the mechanisms dominating the electronic transport and the electronic structure of the junction (primarily the positions of the molecule’s highest occupied (HO) and lowest unoccupied (LU) molecular orbitals (MO) with respect to the electrodes’ Fermi level) Paulsson and Datta (2003); Koch et al. (2004); Segal (2005). The relation between the two directions is simple - knowing the detailed electronic properties of the junction will help design junctions with better thermoelectric performance. Against this background, the last few years have seen huge advances in the measurement of thermopower in molecular junctions Reddy et al. (2007); Baheti et al. (2008); Malen et al. (2009a, b); Tan et al. (2011); Yee et al. (2011); Widawsky et al. (2012), accompanied by a large number of theoretical studies. Murphy et al. (2008); Dubi and Di Ventra (2008); Liu and Chen (2009); Ke et al. (2009); Bergfield and Stafford (2009); Liu et al. (2009); Wang et al. (2010); Leijnse et al. (2010); Sergueev et al. (2011); Liu et al. (2011a, b); Quek et al. (2011); Stadler and Markussen (2011); Nikolic et al. (2012); Bürkle et al. (2012); Hsu et al. (2012); Balachandran et al. (2012)
The thermopower of a molecular junction (also known as the Seebeck coefficient) is defined as the (linear) voltage response to an applied temperature difference, . Most of the theoretical papers mentioned above have used the non-equilibrium Green’s function (NEGF) approach Datta (1997); Di Ventra (2008) in combination with density functional theory (DFT) to determine . Within this framework, the Kohn-Sham (KS) equations for the hybrid metal-molecule-metal (finite) electrodes are solved self-consistently using various functionals Ke et al. (2009). The KS orbitals are used to construct the Green’s functions, which are, in turn, used to calculate the junction’s transmission function, i.e., the probability of an electron arriving from the electrode with energy to cross the junction. The self-energy that describes the electrodes is calculated either phenomenologically (using a simple level-broadening form Ke et al. (2009)) or by some self-consistent scheme Ke et al. (2004). Once the transmission function is calculated, it can be used to calculate the (temperature-dependent) thermopower , as described in the following section.
In recent years, the NEGF-DFT approach has been criticized, not only because of the approximation built into the use of KS orbitals to construct the Green’s functions Di Ventra (2008) or the use of different functionals Ke et al. (2009), but because it cannot capture dynamical effects. Such effects may become very important for transport Varga (2011); Myöhänen et al. (2012); Evans and Voorhis (2009), and their role in determining the thermopower is currently not known. In addition, it has recently been shown that because of the inherent level broadening due to the self-energy, the NEGF approach ”downplays” variations in the transmission function due to, e.g., the local density of states at the molecule-electrode point of contact. As a result, fluctuations of the energy offset between the HOMO and the electrodes’ Fermi energy are overestimated Dubi (2012).
The effect of fluctuations on the thermopower in molecular junctions has been a subject of recent theoretical studies Koch et al. (2004); Walczak (2007); Galperin et al. (2008); Entin-Wohlman et al. (2010); Bürkle et al. (2012); Tan et al. (2011); Pauly et al. (2011); Sergueev et al. (2011); Entin-Wohlman and Aharony (2012); Ren et al. (2012); Hsu et al. (2012). However, neither the statistical nature (i.e. the full histogram of the thermopower) nor the effects of the variations in the molecular levels were discussed, even though all the experiments carry a significant statistical signature. In fact, even in the much more thoroughly studied field of electron transport in molecular junctions, the effect of various configurations on the statistical distribution were onlly recently discussed Reuter et al. (2012). Addressing the effect of fluctuations theoretically is critical for properly analyzing experimental results and relating them to the electronic properties of the molecular junctions. We thus conducted a theoretical study of the effect of fluctuations on the temperature-dependence of the thermopower in model single-molecule junctions composed of biphenyl (two rings) and triphenyl (three rings) molecules attached to gold electrodes.
Two sources of fluctuations were considered: (1) fluctuations in the energy offset between the Fermi energy of the electrodes and the HOMO level, and (2) thermal fluctuations of the torsion angle between the planes of the phenyl rings (the dihedral angle) Johansson and Olsen (2008); Bürkle et al. (2012). These two sources of fluctuations represent, respectively, fluctuations due to different reconstructions of the molecular junctions and thermal fluctuations within a given junction Malen et al. (2009a); Guo et al. (2011). Other sources of fluctuations, such as fluctuations in the molecule-electrode coupling may (and probably do) exist, and were discussed in past literature Dubi and Di Ventra (2011). However, here we focus on the above sources of fluctuations, which have been experimentally proven to existGuo et al. (2011) and to bare importance of the thermopowerMalen et al. (2009a).
The main result reported here is that due to fluctuations, the average thermopower can deviate substantially (higher or lower) from its bare, fluctuation free value. The full thermopower histogram is presented, and exhibits similarity to experimental results. The important conclusion that may be drawn from these findings is that in considerations of the thermopower of a molecular junction the full distribution of must be used to extract information on the molecular junction.
II Molecular junctions: model and calculation
In this work, we considered phenyl-based molecular junctions. Such junctions are prototypical molecular junctions whose conductance appears to be dominated by the torsion angle between the phenyl rings. Venkataraman et al. (2006); Mishchenko et al. (2010, 2011) Note that the torsion angle can be adjusted by attaching to the rings different alkyl chains of different lengths Vonlanthen et al. (2009); Mishchenko et al. (2010, 2011); Bürkle et al. (2012). The equilibrium torsion angle is bistable at and , with an energy barrier of about eV between them (when the molecule is in the junction) Sergueev et al. (2011), 111The energy barrier between the two stable states was calculated to be as be as small as eV for free biphenyl molecules Johansson and Olsen (2008), but we take here the higher limit as a ”worse-case”. A smaller barrier would make the conclusions of this paper even stronger. The thermopower of biphenyl molecular junctions was recently studied in detail with the NEGF-DFT method Sergueev et al. (2011); Bürkle et al. (2012). Sergueev et al.Sergueev et al. (2011) studied the effects of inelastic (electron-phonon) scattering on the thermopower for the two stable torsion angles. Although they did take into consideration thermal fluctuations of the torsion angle, they investigated only a single anchor geometry between the molecule and the electrodes. Burkle et al.Bürkle et al. (2012) considered different anchor geometries and different end-groups as well as different angles, but did not include the temperature dependence of the fluctuations in their study. Neither of these groups took into account the fluctuations of the HOMO level or the full thermopower distribution.
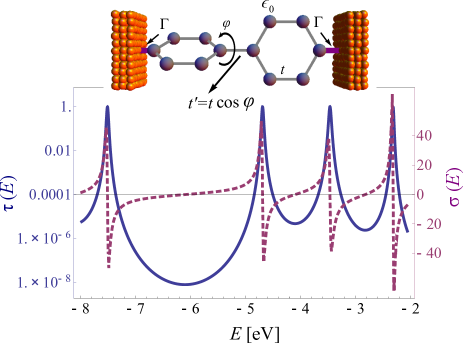
To address the above-described deficiencies, we apply the -orbital tight-binding (TB) model introduced in Ref. Viljas et al. (2008) and parametrized by Burkle et al.Bürkle et al. (2012). This model uses the transmission function from the full NEGF-DFT calculation as a fitting curve for a TB description of the biphenyl junction with different anchoring geometries. In the TB model, the molecule is described by a -orbital at every molecule location with an on-site energy and a hopping term between orbitals belonging to the same phenyl ring. The inter-ring hopping is given by , where is the torsion angle. In the wide-band approximation, the self-energy of the electrodes is characterized by a level broadening . The TB model is schematically depicted in the top panel of Fig. 1, and the parameterization from Ref. Bürkle et al. (2012) for different end-groups is shown in Table 1. We focus here on the TT1 (top) binding geometry, as the differences between the different geometries are rather minor.
| S-TT1 | -4.0 | -1.9 | 0.96 |
|---|---|---|---|
| NH2-TT1 | -4.30 | -2.29 | 0.6 |
| CN-TT1 | -6.10 | -2.0 | 0.14 |
Once the tight-binding Hamiltonian is parametrized (for a given torsion angle ), we evaluate the retarded and advanced Green’s functions , from which the transmission function is calculated by . The thermopower can be calculated from by , where , is the absolute value of the electron charge, is the Fermi function, the Boltzmann constant, and is the chemical potential Paulsson and Datta (2003); Di Ventra (2008); Dubi and Di Ventra (2011). At low temperatures, the expression for simplifies to , where and .
In Fig. 1 we plot the transmission function (solid blue line) and the logarithmic derivative (dashed purple line) as a function of energy for the CN-TT1 configuration, which has the smallest level broadening. The Fermi energy for Au electrodes is taken at eV Bürkle et al. (2012) (even though there is ambiguity of eV in this parameter Sergueev et al. (2011); Balachandran et al. (2012)). The resonances at the HOMO and LUMO levels may be seen in the figure, with the resonance in close to them.
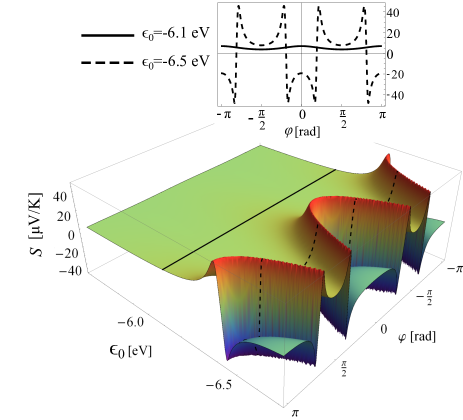
In Fig. 2 (left panel) a 3D-map of the thermopower (at K) is plotted as a function of energy , which determines the position of the HOMO level and the energy difference between the HOMO level and the Fermi energy (which is kept constant) and torsion angle (measured from the equilibrium value ) . The thermopower is calculated using the full integral form and not with the low-temperature form. For eV, we observe an increasingly strong dependence of on the torsion angle. This strong dependence is evident from the upper panel of Fig. 2, showing a plot of as a function of for two values of the energy offset, eV (solid line, the value taken from Ref. Bürkle et al. (2012)) and eV, for which the thermopower changes dramatically as a function of angle and even changes sign. The origin of this behavior can be understood from the observation that pushing to lower values is equivalent to raising the Fermi level from its bare value. From Fig. 1 we see that eV falls just below the resonance value at which the thermopower changes sign. Thus, pushing down is equivalent to pushing the Fermi level closer to this resonance, where thermopower exhibits strong sensitivity to the torsion angle.
III Fluctuation-averaged thermopower
The strong sensitivity of to the torsion angle begins to evolve within eV of the bare value of . However, the value of (or, more physically, the energy offset between the HOMO with respect to the Fermi energy) is known to vary substantially between different reconstructions of the same junction Malen et al. (2009a). Defining as the range of variations in (i.e., changes on a scale between realizations), we estimate to lie between a low of eV (extracted from transition voltage spectroscopy measurementGuo et al. (2011)) and a high of eV, as extracted from thermopower measurements Malen et al. (2009a) (although this may be an overestimate Dubi (2012)). Thus, taking into account fluctuations of both and is essential in the calculation of the temperature dependence of the thermopower.
To take both the variations in and the thermal fluctuations of into account, we calculate the average thermopower as a statistical average, taking from a uniform distribution , where are the bare values taken from Table 1. It is reasonable to take a uniform distribution of , since the variations in are due to junction reconstruction and are not thermal in origin. The phases are drawn from a thermal distribution , where is taken phenomenologically to be a cosine function with two minima at and , with an energy barrier eV between them. Formally, the average thermopower is thus:
| (1) |
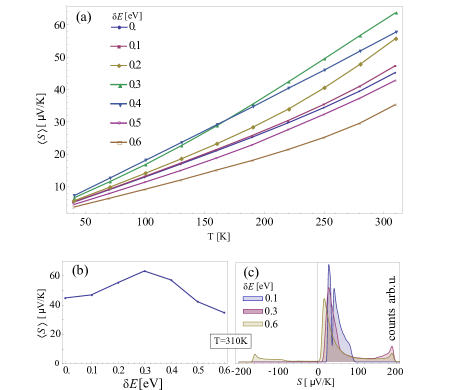
In Fig. 3(a), we plot the average thermopower as a function of the temperature, for the energy variation range eV (which are well within the experimentally relevant values Guo et al. (2011); Malen et al. (2009a)), calculated for a CN-TT1 biphenyl molecular junction. The influence of the fluctuations can best be seen in Fig. 3(b), where the average thermopower at K is plotted as a function of the energy variation range . The average thermopower is not homogeneous in fluctuation strength, because as the fluctuations in become large, there are more frequent realizations for which is such that the Fermi energy is close to the transmission resonance, and thus the thermopower becomes strongly angle dependent (Fig. 2). At a certain fluctuation strength, the thermopower can even change sign with the torsion angle (for certain realizations), giving rise to negative thermopower values, which then tend to reduce the average thermopower (hence the reduction at large and the non-monotonicity). This phenomenon can be seen in Fig. 3(c), where the full thermopower histogram is plotted for and eV. For eV, the histogram shows substantial weight on negative values of . Note the histograms have a well-defined double-peak structure. Such structures, as well as sign-change of thermopower within the same junction, have been observed experimentally Reddy et al. (2007); Malen et al. (2009a); Baheti et al. (2008).
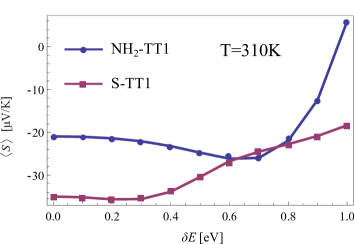
Out of all the configurations studied in Ref. Bürkle et al. (2012), in the CN-TT1 configuration of the biphenyl junction the molecule is most weakly coupled to the electrodes, as manifested by the smallest of all values of (see Table 1). Thus, the CN-TT1 configuration has the sharpest transmission resonance and thermopower line-shape and, as a result, the strongest dependence of the thermopower on the torsion angle close to the resonance (Fig. 2). However, the deviation of the average thermopower from the fluctuation-free value due to fluctuations in and is not limited to junctions exhibiting sharp resonance. In Fig. 4 we plot the average thermopower at K as a function of for the NH2-TT1 and S-TT1 configuration biphenyl molecular junctions, with and eV, respectively. Raising up to eV (corresponding to a variation in the HOMO-fermi energy of eV), we find for these junctions a strong dependence of on , including non-monotonic behavior and even a change of sign of at large .
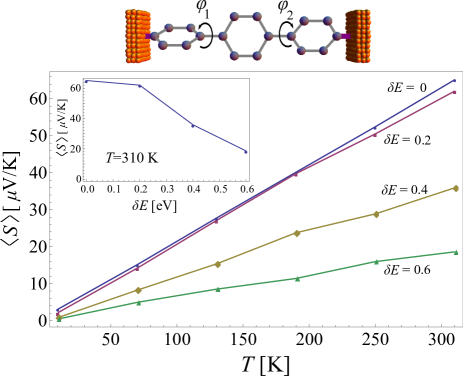
Finally, we calculate the temperature dependence of a triphenyl molecule in the CN-TT1 configuration, depicted in the upper panel of Fig. 5. The molecular junction is now characterized by two torsion angles, and . To calculate the transmission and from it the thermopower, we use the same TB parametrization as that of the biphenyl junction, under the assumption that the hopping element, the orbital level and the coupling to the electrodes should not depend (or very weakly depend) on the number of phenyl rings. We allow the two torsion angles and to thermally fluctuate around their equilibrium values, and the average is averaged over the fluctuations of and the torsion angles.
In Fig. 5, is plotted as a function of temperature for an energy variation range of eV. Here we used the low-temperature form for the thermopower calculation. This is a good approximation, noting that the thermopower in Fig. 3 is almost linear in temperature, pointing that even room temperature is within the low-temperature regime (since the molecular energy scales are still much larger than the temperature).
A monotonic reduction of with is found, as seen in the inset, where we plot as a function of at K. Here we stress that for eV (a variation range of of eV), the value of is V/K, which is of its value without fluctuations. If, for instance, we were to use this value of to calculate the position of the HOMO level without taking fluctuations into account, the resulting HOMO level would deviate by eV with respect to its real position.
IV Summary
In summary, we calculated the thermopower of phenyl-based molecular junctions. Using a DFT-based TB parametrization Bürkle et al. (2012), we calculated the thermopower for four types of junctions: three biphenyl junctions with different end groups and a tri-phenyl junction with a CN end-group. As opposed to previous calculations, we calculated the full thermopower distribution taking into account both variations in the molecular orbitals (due to junction reconstruction) and thermal variations in the torsion angle between the phenyl-rings.
Our calculations show that the thermopower histogram strongly depends on the magnitude of the fluctuations (characterized by the range of variations of the molecular orbital level ). The fluctuation-averaged thermopower can increase or decrease as a function of the magnitude of fluctuations, due to the appearance of realizations in which the molecular orbitals lie close to a transmission resonance. In these realizations, the thermopower changes sign with the phenyl ring torsion angle, leading to the appearance of additional peaks with a negative sign in the thermopower histogram and an overall reduction in the average thermopower.
Our main message here is that fluctuations, both thermal and from other sources (e.g. HOMO position due to junction reconstruction), must be taken into account in calculations of thermopower of molecular junctions, if these calculations are to be compared to experimental data, or if the experimental data are to be used to extract relevant junction parameters. From the experimental side, since a major source of fluctuations is variations in the molecular level, it is highly desirable to find an experimental way to ”pin” the molecular levels and reduce fluctuations. To this end, further research into the origin of these fluctuations should be carried out.
The author wishes to thank Dr. Y. Miller. This research was funded by a BGU start-up grant.
References
- Nitzan (2007) A. Nitzan, Science 317, 759 (2007).
- Dubi and Di Ventra (2011) Y. Dubi and M. Di Ventra, Reviews of Modern Physics 83, 131 (2011).
- Paulsson and Datta (2003) M. Paulsson and S. Datta, Phys. Rev. B 67, 241403 (2003).
- Koch et al. (2004) J. Koch, F. von Oppen, Y. Oreg, and E. Sela, Phys. Rev. B 70, 195107 (2004).
- Segal (2005) D. Segal, Phys. Rev. B 72, 165426 (2005).
- Reddy et al. (2007) P. Reddy, S. Jang, R. Segalman, and A. Majumdar, Science 315, 1568 (2007).
- Baheti et al. (2008) K. Baheti, J. Malen, P. Doak, P. Reddy, S. Jang, T. Tilley, A. Majumdar, and R. Segalman, Nano letters 8, 715 (2008).
- Malen et al. (2009a) J. Malen, P. Doak, K. Baheti, T. Tilley, A. Majumdar, and R. Segalman, Nano letters 9, 3406 (2009a).
- Malen et al. (2009b) J. Malen, P. Doak, K. Baheti, T. Tilley, R. Segalman, and A. Majumdar, Nano letters 9, 1164 (2009b).
- Tan et al. (2011) A. Tan, J. Balachandran, S. Sadat, V. Gavini, B. Dunietz, S. Jang, and P. Reddy, Journal of the American Chemical Society (2011).
- Yee et al. (2011) S. Yee, J. Malen, A. Majumdar, and R. Segalman, Nano letters (2011).
- Widawsky et al. (2012) J. R. Widawsky, P. Darancet, J. B. Neaton, and L. Venkataraman, Nano Letters 12, 354 (2012).
- Murphy et al. (2008) P. Murphy, S. Mukerjee, and J. Moore, Phys. Rev. B 78, 161406 (2008).
- Dubi and Di Ventra (2008) Y. Dubi and M. Di Ventra, Nano Letters 9, 97 (2008).
- Liu and Chen (2009) Y.-S. Liu and Y.-C. Chen, Phys. Rev. B 79, 193101 (2009).
- Ke et al. (2009) S.-H. Ke, W. Yang, S. Curtarolo, and H. U. Baranger, Nano Letters 9, 1011 (2009).
- Bergfield and Stafford (2009) J. P. Bergfield and C. A. Stafford, Nano Letters 9, 3072 (2009).
- Liu et al. (2009) Y.-S. Liu, Y.-R. Chen, and Y.-C. Chen, ACS Nano 3, 3497 (2009).
- Wang et al. (2010) R.-Q. Wang, L. Sheng, R. Shen, B. Wang, and D. Y. Xing, Phys. Rev. Lett. 105, 057202 (2010).
- Leijnse et al. (2010) M. Leijnse, M. R. Wegewijs, and K. Flensberg, Phys. Rev. B 82, 045412 (2010).
- Sergueev et al. (2011) N. Sergueev, S. Shin, M. Kaviany, and B. Dunietz, Phys. Rev. B 83, 195415 (2011).
- Liu et al. (2011a) Y.-S. Liu, B. C. Hsu, and Y.-C. Chen, The Journal of Physical Chemistry C 115, 6111 (2011a).
- Liu et al. (2011b) Y.-S. Liu, H.-T. Yao, and Y.-C. Chen, The Journal of Physical Chemistry C 115, 14988 (2011b).
- Quek et al. (2011) S. Y. Quek, H. J. Choi, S. G. Louie, and J. B. Neaton, ACS Nano 5, 551 (2011).
- Stadler and Markussen (2011) R. Stadler and T. Markussen, The Journal of Chemical Physics 135, 154109 (2011).
- Nikolic et al. (2012) B. Nikolic, K. Saha, T. Markussen, and K. Thygesen, Journal of Computational Electronics 11, 78 (2012).
- Bürkle et al. (2012) M. Bürkle, L. A. Zotti, J. K. Viljas, D. Vonlanthen, A. Mishchenko, T. Wandlowski, M. Mayor, G. Schön, and F. Pauly, Phys. Rev. B 86, 115304 (2012).
- Hsu et al. (2012) B. C. Hsu, C.-Y. Lin, Y.-S. Hsieh, and Y.-C. Chen, Applied Physics Letters 101, 243103 (2012).
- Balachandran et al. (2012) J. Balachandran, P. Reddy, B. D. Dunietz, and V. Gavini, The Journal of Physical Chemistry Letters 3, 1962 (2012).
- Datta (1997) S. Datta, Electronic Transport in Mesoscopic Systems (Cambridge University Press, 1997).
- Di Ventra (2008) M. Di Ventra, Electrical Transport in Nanoscale Systems (Cambridge University Press, 2008).
- Ke et al. (2004) S.-H. Ke, H. U. Baranger, and W. Yang, Phys. Rev. B 70, 085410 (2004).
- Varga (2011) K. Varga, Phys. Rev. B 83, 195130 (2011).
- Myöhänen et al. (2012) P. Myöhänen, R. Tuovinen, T. Korhonen, G. Stefanucci, and R. van Leeuwen, Phys. Rev. B 85, 075105 (2012).
- Evans and Voorhis (2009) J. S. Evans and T. V. Voorhis, Nano Letters 9, 2671 (2009).
- Dubi (2012) Y. Dubi, arXiv:1211.4671 (2012).
- Walczak (2007) K. Walczak, Physica B: Condensed Matter 392, 173 (2007).
- Galperin et al. (2008) M. Galperin, A. Nitzan, and M. A. Ratner, Molecular Physics 106, 397 (2008).
- Entin-Wohlman et al. (2010) O. Entin-Wohlman, Y. Imry, and A. Aharony, Phys. Rev. B 82, 115314 (2010), URL http://link.aps.org/doi/10.1103/PhysRevB.82.115314.
- Pauly et al. (2011) F. Pauly, J. K. Viljas, M. Bürkle, M. Dreher, P. Nielaba, and J. C. Cuevas, Phys. Rev. B 84, 195420 (2011).
- Entin-Wohlman and Aharony (2012) O. Entin-Wohlman and A. Aharony, Phys. Rev. B 85, 085401 (2012), URL http://link.aps.org/doi/10.1103/PhysRevB.85.085401.
- Ren et al. (2012) J. Ren, J.-X. Zhu, J. E. Gubernatis, C. Wang, and B. Li, Phys. Rev. B 85, 155443 (2012), URL http://link.aps.org/doi/10.1103/PhysRevB.85.155443.
- Reuter et al. (2012) M. G. Reuter, M. C. Hersam, T. Seideman, and M. A. Ratner, Nano Letters 12, 2243 (2012).
- Johansson and Olsen (2008) M. P. Johansson and J. Olsen, Journal of Chemical Theory and Computation 4, 1460 (2008).
- Guo et al. (2011) S. Guo, J. Hihath, I. Diez-Perez, and N. Tao, Journal of the American Chemical Society 133, 19189 (2011).
- Venkataraman et al. (2006) L. Venkataraman, J. E. Klare, C. Nuckolls, M. S. Hybertsen, and M. L. Steigerwald, Nature 442, 904 (2006).
- Mishchenko et al. (2010) A. Mishchenko, D. Vonlanthen, V. Meded, M. Buּˆrkle, C. Li, I. V. Pobelov, A. Bagrets, J. K. Viljas, F. Pauly, F. Evers, et al., Nano Letters 10, 156 (2010).
- Mishchenko et al. (2011) A. Mishchenko, L. A. Zotti, D. Vonlanthen, M. Bֳ¼rkle, F. Pauly, J. C. Cuevas, M. Mayor, and T. Wandlowski, Journal of the American Chemical Society 133, 184 (2011).
- Vonlanthen et al. (2009) D. Vonlanthen, A. Mishchenko, M. Elbing, M. Neuburger, T. Wandlowski, and M. Mayor, Angewandte Chemie International Edition 48, 8886 (2009), ISSN 1521-3773.
- Viljas et al. (2008) J. K. Viljas, F. Pauly, and J. C. Cuevas, Phys. Rev. B 77, 155119 (2008).