Critical correlations in an ultracold Bose gas revealed by means of a temporal Talbot-Lau interferometer
Abstract
We study experimentally the critical correlation in an ultra-cold Bose gas with a temporal Talbot-Lau (TL) interferometer. Near the critical temperature, we observe a bi-modal density distribution in an ultra-cold Bose gas after the application of the TL interferometer. The measured fraction of the narrower peak in the density distribution displays a clear peak within the critical regime. The peak position agrees with the critical temperature calculated with the finite-size and interaction corrections. The critical exponents are extracted from the peak and they agree with the critical exponents for the correlation length.
pacs:
05.70.Jk, 64.60.F-, 67.85.-d.
Near the second-order phase transition Zinn-Justin (2002); Chaikin and Lubensky (2000); Privman et al. (1991) from a normal fluid to a superfluid characterized by a complex order parameter, the diverging spatial correlation length around the critical temperature is the driving force behind various critical phenomena. There have been enormous experimental efforts to study the critical phase transition to superfluid in liquid helium Greywall and Ahlers (1973); Ahlers (1973); Adriaans et al. (1994). One of the endeavors was even carried out in space to get rid of the deviation caused by gravity Lipa et al. (2003). Many critical phenomena, which had long eluded direct experimental study, have now been studied experimentally with ultra-cold Bose Greiner et al. (2002); Simon et al. (2011); Zhang et al. (2012); Hung et al. (2011) and Fermi gases Ku et al. (2012). In particular, the second-order phase transition from a normal state to a superfluid state has been studied in a landmark experiment Donner et al. (2007), where the critical behavior in the correlation length was revealed by detecting the interference of two released atomic clouds. This experiment demonstrates that the spatial correlation in a system can enhance the interference effect, which in turn can be used to detect spatial correlation. Recently, there are also intensive theoretical studies on the critical behavior with cold atoms Kato et al. (2008); Campostrini and Vicari (2009); Zhou and Ho (2010); Diehl et al. (2010); Hazzard and Mueller (2011); Fang et al. (2011).
In this Letter we study experimentally the spatial correlation in an ultra-cold Bose gas with a temporal Talbot-Lau (TL) interferometer. In such an interferometer, the interference effect between the correlated atoms reported in Ref. Donner et al. (2007) is greatly enhanced because all atoms in the Bose gas are involved. With this TL interferometer, we explore how the spatial correlation in an ultra-cold atomic gas varies as it undergoes the phase transition from a thermal gas to a Bose-Einstein condensate (BEC). At the critical temperature, we observe a bi-modal density distribution after the application of the TL interferometer. When the fraction of the narrower density distribution is measured, we find a clear peak in the critical regime and the peak position agrees well with the critical temperature calculated for this Bose gas by including the finite-size and interaction effects. We have also extracted the critical exponents from the measured peak and they are very close to the theoretical critical exponents for correlation length, suggesting that the fraction measured in our experiment is proportional to the correlation length.
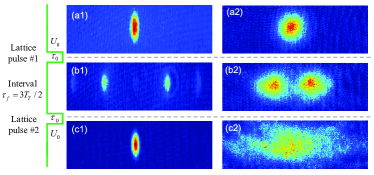
The temporal TL interferometer for ultra-cold atoms.—The TL interferometer has been widely used to reveal the interference property for different systems Cronin and Pritchard (2009). Here we use a temporal TL interferometer Cahn et al. (1997); Deng et al. (1999) to experimentally study the phase transition to a BEC. Our TL interferometer (Fig. 1) consists of two optical lattice pulses separated by a time interval equal to the odd times of half a Talbot time Cahn et al. (1997); Deng et al. (1999) with being the laser wavelength, the atomic mass and the Planck’s constant. In our experiment, the wavelength nm, the interval , the pulse width s, and the lattice depth with being the recoil energy of an atom absorbing one lattice photon. The lattice depth is calibrated experimentally by the Kapitza-Dirac scattering. The ultra-cold atoms of 87Rb were prepared in a magnetic trap with axial frequency 20 Hz and radial frequency 220 Hz Xiong et al. (2011). The TL interferometer was applied onto the ultra-cold atomic gas along the axial direction. The time-of-flight (TOF) images are obtained with the standard absorption imaging method after switching off the magnetic field and 30 ms free expansion.
During the first lattice pulse, the atomic gas is divided into hundreds of disk-shaped atomic gases that are physically separated due to the strength of the pulse. After the pulse, these disk-shaped atomic gases start to merge and interfere for a given time. The second lattice pulse again divides it into hundreds of disk-shaped atomic gases, leading to a second interference. For an initial atomic gas without correlation, the interference is in fact for each individual atom itself. The overall interference pattern is a simple addition of the interference intensities for all the individual atoms in the gas. Such a simple addition does not apply for an atomic gas with spatial correlation larger than the spatial period of the pulsed lattice. Due to the correlation, one should instead sum up first the interference wave functions for the correlated atoms within the correlation length, then square the amplitude of the summed wave function to obtain an enhanced interference. This enhancement suggests that the TL interferometer would be powerful for detecting the spatial correlation among atoms.
Our TL interferometer is effectively an interferometer for atoms around zero momentum and with spatial correlation larger than the spatial period of the pulsed optical lattices. To clearly see this, we turn to the momentum space, where the experimental observation is made, and focus on atoms with momenta very close to zero. For these atoms, after the first optical lattice pulse, significant proportion of atoms will be transferred to the momentum around (, ) with almost no atoms left at zero momentum; after the second optical lattice pulse, the atoms with momentum around will be brought back to the momentum around Edwards et al. (2010). This effect is verified and illustrated experimentally with a pure condensate in the left column of Fig. 1.
With this in mind, it is straightforward to see how our interferometer will affect a thermal atomic cloud without correlation: a very small fraction of atoms that are in the state of momentum zero are similarly transferred away and brought back to momentum zero by our interferometer; for majority of the atoms with non-zero momenta, they will not be brought back to their original momentum states. The end result is an atomic cloud with much wider distribution in momentum space (see the right column of Fig. 1). For thermal atomic cloud, because of the lack of correlation between different momentum states, it is expected that there is a trivial mapping before and after the TL interferometer. Both experiment and theoretical simulation show that the momentum distribution is still a Gaussian distribution after the TL interferometer.
Far below the critical temperature which comprises both condensate and thermal atoms, after the application of the TL interferometer, we expect a bi-modal density distribution because the condensate will still lead to a narrower central peak as experimentally shown in Fig. 2(b5).
When the system is close to the critical temperature, there is strong spatial correlation between atoms, which will enhance the interference as reported in Ref.Donner et al. (2007). As our TL interferometer is essentially an interferometer for atoms around momentum zero, this enhancement is expected to increase the population around momentum zero, causing the momentum distribution around zero to deviate from the Gaussian distribution after the application of the TL interferometer. Such a deviation from the Gaussian should be bigger for stronger correlation. In a sense, the existence of an order parameter for the correlated atoms within the critical regime makes these atoms have similar behavior to a condensate after the application of the TL interferometer. This physical picture will lead to a bi-modal density distribution after the application of the TL interferometer, similarly to the system far below the critical temperature.
Within the critical regime marked by the Ginzburg temperature , i.e. , the correlation length diverges near the critical temperature as Zinn-Justin (2002); Chaikin and Lubensky (2000); Privman et al. (1991)
| (1) | |||||
| (2) |
where the critical exponents . This is for the infinite system in the thermodynamic limit. For the finite system in our experiment, the correlation length no longer diverges. Nevertheless, the correlation is still the strongest at the critical temperature and the correlation length should have a peak around . Within the critical regime, this implies that the deviation from the Gaussian distribution after the TL interferometer is the largest at .
Observation of the critical phase transition.—With the above expectations, we have surveyed the ultra-cold atomic gases with the TL interferometer over a wide range of temperatures with particular attention paid to the range where the critical phase transition from a thermal cloud to a BEC occurs. The results for five typical temperatures are shown in Fig. 2. The system temperature is expressed in terms of , the critical temperature of the corresponding ideal Bose gas without the finite-size correction Pethick and Smith (2002). is the geometric average of the harmonic trapping frequencies and is the total particle number.

Shown in the first row of the figure are TOF images before the application of the TL interferometer. The corresponding integrated density distributions are shown as dotted blue lines in the third row. There is a clear bi-modal distribution at temperature (Fig. 2(a5)) and a minor bi-modal distribution at temperature (Fig. 2(a4)). There are no obvious condensate fraction at three other higher temperatures. However, after the application of the TL interferometer, a clear bi-modal (i.e., non-Gaussian) distribution emerges at (Fig. 2(b3)). In contrast, at a temperature well above the critical temperature (), and temperatures slightly lower () and slightly above (), there are no obvious bi-modal structures after the application of the TL interferometer. This shows that the emergence of the bi-modal distribution at is the result of the diverging correlation length near the critical temperature.
To quantify the observed critical behavior, we use the fraction of atoms in the central peak of the bi-modal structure after the TL pulses for different temperatures. For each density distribution obtained after the TL interferometer, we fit it along the direction of the TL pulses with a bi-Gaussian function, and compute the fraction of the central narrow peak with , where is the area under the broad peak and is the total area in the bi-modal structure. Note that it is an assumption that the non-Gaussian distribution of momentum observed near is bi-modal. This assumption is reasonable as indicated in Fig. 2(b3) (see Supplemental Material for further discussions).
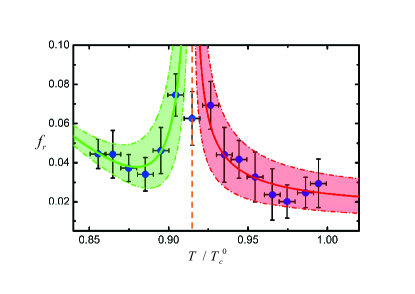
In Fig. 3, we show how this fraction changes with temperature. Near the critical temperature, a clear peak around is seen. We also notice a small dip in the peak, which may due to the uncertainty of the temperature calibration which is about . Because the central peak after the TL interferometer physically originates from the spatial interference of the atoms, within the critical regime, it is expected that the larger the correlation length, the larger the fraction . Hence, this peak implies the critical phase transition from a thermal cloud to a BEC.
As the correlation length diverges at the critical temperature, this peak position can be regarded as the critical temperature of the system. Above this critical temperature, the fraction increases with decreasing temperature, very similar to what was observed with the method of the matter-wave interference Donner et al. (2007). Below this critical temperature, we see decreases with decreasing system temperature within the critical regime.
From the peak in Fig. 3, we are able to determine the critical temperature . We find , indicating a negative shift from the critical temperature of the ideal Bose gas. The negative shift is due to the finite-size and interaction corrections of the critical temperature. The simultaneous consideration of the finite-size and interaction corrections to the critical temperature Giorgini et al. (1996); Xiong et al. (2002) gives a negative shift of about 0.08 agreeing well with our experimental result . The correction to the critical temperature also agrees with previous experiments Ensher et al. (1996); Gerbier et al. (2004); Smith et al. (2011a, b). These agreements further confirm the observation of the critical phase transition in this work. It is worth to point out that we have computed the Ginzburg temperature Giorgini et al. (1996). The result is that , which agrees with the peak width in Fig. 3.
Blow the critical temperature and within the critical regime, there is a decrease of . This is because that the fraction has two origins, the condensate fraction that has infinite coherent length and the correlated thermal fraction that obeys Eq.(2). Within the critical regime, the contribution from the correlated thermal fraction dominates, causing the fraction to decrease. In fact, we measured the condensate fraction without the TL interferometer. The results agree with the theoretical result by taking into account the finite-size and interaction corrections Giorgini et al. (1996); Xiong et al. (2002, 2001). At , just outside the critical regime and where the fraction starts to increase, our experiment shows that the condensate fraction without interferometer is about 0.08 which is of the order of in Fig.3. We emphasize that this understanding of the whole system consisting of two parts, condensate and correlated thermal atoms, is phenomenological in the spirit of two-fluid model for liquid helium. A more rigorous theory is needed to fully understand the strongly correlated quantum many-body state just below the critical temperature and how it responds to an interferometer.
Discussion and outlook.—Within the critical regime, it is clear that the fraction is a monotonic function of the correlation length. It is natural to fit the data on the right side of the peak with and the left side with . The additional term for the left side is to account for the condensate fraction which appears below the critical temperature. Rigorously speaking, the correlation length should display a smooth evolution within the critical regime due to the finite-size characteristic of our experiment. Similarly to Ref. Donner et al. (2007), because of the uncertainty of the temperature calibration, we do not discuss the finite-size effect to the correlation length in this work.
From the data fitting, we get and . The uncertainties correspond to a confidence level. These two critical exponents are very close to , the theoretical value of the correlation length’s critical exponent for the universality class of three-dimensional XY model Burovski et al. (2006); Yukalov and Yukalova (2007). If we assume that and the theoretical value of the critical exponent is exact, we have . This experimental result indicates that the fraction near the peak in Fig. 3 is proportional to the correlation length.
This encouraging indication is supported by a phenomenological theory (see Supplemental Material). However, we still do not have a rigorous theory how a strongly correlated system responds to an interferometer as the action of an interferometer can no longer be regarded as a small perturbation. This is different from known measurements on critical systems, for example, the heat capacity measurement on liquid helium, which can be regarded as a perturbation and have negligible effects on the systems.
In summary, we have studied the critical behavior of interacting ultra-cold Bose gases with a temporal TL interferometer. A peak in the fraction of the narrower peak of the density distribution was clearly observed across the phase transition from a thermal gas to a BEC. This experimental study of the ultra-cold atomic gas within the critical regime opens the way to relevant theoretical studies of critical dynamics, which has many open problems Zinn-Justin (2002); Chaikin and Lubensky (2000); Privman et al. (1991). It also gives a new method to measure the critical temperature. We expect that the temporal TL interferometer be used to study a wide range of the critical phase transitions, such as the quantum phase transition from superfluid to Mott insulator for cold atoms in an optical lattice Greiner et al. (2002), ultra-cold Fermi gas Ku et al. (2012) and the quantum magnetism with the cold atoms and molecules as a quantum simulator Sachdev (2008); Jo et al. (2009); Simon et al. (2011); Gorshkov et al. (2011).
Acknowledgements.
This work was supported by the NBRP of China (2011CB921500, 2012CB921300), the NSF of China (61078026,11175246, 10825417), and the RFDP of China (20110001110091).References
- Zinn-Justin (2002) J. Zinn-Justin, Quantum Field Theory and Critical Phenomena (Oxford University Press, 2002).
- Chaikin and Lubensky (2000) P. M. Chaikin and T. C. Lubensky, Principles of Condensed Matter Physics (Cambridge University Press, 2000).
- Privman et al. (1991) V. Privman, P. C. Hohenberg, and A. Aharony, in Phase transitions and critical phenomena, edited by C. Domb and J. L. Lebowitz (Academic Press, 1991), vol. 14.
- Greywall and Ahlers (1973) D. Greywall and G. Ahlers, Phys. Rev. A 7, 2145 (1973).
- Ahlers (1973) G. Ahlers, Phys. Rev. A 8, 530 (1973).
- Adriaans et al. (1994) M. J. Adriaans, D. R. Swanson, and J. A. Lipa, Physica B 194, 733 (1994).
- Lipa et al. (2003) J. A. Lipa, J. A. Nissen, D. A. Stricker, D. R. Swanson, and T. C. P. Chui, Phys. Rev. B 68, 174518 (2003).
- Greiner et al. (2002) M. Greiner, O. Mandel, T. Esslinger, T. W. Hänsch, and I. Bloch, Nature 415, 39 (2002).
- Simon et al. (2011) J. Simon, W. S. Bakr, R. Ma, M. E. Tai, P. M. Preiss, and M. Greiner, Nature 472, 307 (2011).
- Zhang et al. (2012) X. Zhang, C.-L. Hung, S.-K. Tung, and C. Chin, Science 335, 1070 (2012).
- Hung et al. (2011) C.-L. Hung, X. Zhang, N. Gemelke, and C. Chin, Nature 470, 236 (2011).
- Ku et al. (2012) M. J. H. Ku, A. T. Sommer, L. W. Cheuk, and M. W. Zwierlein, Science 335, 563 (2012).
- Donner et al. (2007) T. Donner, S. Ritter, T. Bourdel, A. Ottl, M. Köhl, and T. Esslinger, Science 315, 1556 (2007).
- Kato et al. (2008) Y. Kato, Q. Zhou, N. Kawashima, and N. Trivedi, Nature Phys. 4, 617 (2008).
- Campostrini and Vicari (2009) M. Campostrini and E. Vicari, Phys. Rev. Lett. 102, 240601 (2009).
- Zhou and Ho (2010) Q. Zhou and T.-L. Ho, Phys. Rev. Lett. 105, 245702 (2010).
- Diehl et al. (2010) S. Diehl, M. Baranov, A. J. Daley, and P. Zoller, Phys. Rev. Lett. 104, 165301 (2010).
- Hazzard and Mueller (2011) K. R. A. Hazzard and E. J. Mueller, Phys. Rev. A 84, 013604 (2011).
- Fang et al. (2011) S. Fang, C.-M. Chung, P. N. Ma, P. Chen, and D.-W. Wang, Phys. Rev. A 83, 031605 (2011).
- Cronin and Pritchard (2009) A. D. Cronin and D. E. Pritchard, Rev. Mod. Phys. 81, 1051 (2009).
- Cahn et al. (1997) S. B. Cahn, A. Kumarakrishnan, U. Shim, T. Sleator, P. R. Berman, and B. Dubetsky, Phys. Rev. Lett. 79, 784 (1997).
- Deng et al. (1999) L. Deng, E. W. Hagley, J. Denschlag, J. E. Simsarian, M. Edwards, C. W. Clark, K. Helmerson, S. L. Rolston, and W. D. Phillips, Phys. Rev. Lett. 83, 5407 (1999).
- Xiong et al. (2011) W. Xiong, X. Yue, Z. Wang, X. Zhou, and X. Chen, Phys. Rev. A 84, 043616 (2011).
- Edwards et al. (2010) M. Edwards, B. Benton, J. Heward, and C. W. Clark, Phys. Rev. A 82, 063613 (2010).
- Pethick and Smith (2002) C. J. Pethick and H. Smith, Bose-Einstein Condensation in Dilute Gases (Cambridge University Press, 2002).
- Giorgini et al. (1996) S. Giorgini, L. P. Pitaevskii, and S. Stringari, Phys. Rev. A 54, R4633 (1996).
- Xiong et al. (2002) H. Xiong, S. Liu, G. Huang, and Z. Xu, Phys. Rev. A 65, 033609 (2002).
- Xiong et al. (2001) H. Xiong, S. Liu, G. Huang, Z. Xu, and C. Zhang, J. Phys. B 34, 3013 (2001).
- Ensher et al. (1996) J. R. Ensher, D. S. Jin, M. R. Matthews, C. E. Wieman, and E. A. Cornell, Phys. Rev. Lett. 77, 4984 (1996).
- Gerbier et al. (2004) F. Gerbier, J. H. Thywissen, S. Richard, M. Hugbart, P. Bouyer, and A. Aspect, Phys. Rev. Lett. 92, 030405 (2004).
- Smith et al. (2011a) R. P. Smith, R. L. D. Campbell, N. Tammuz, and Z. Hadzibabic, Phys. Rev. Lett. 106, 250403 (2011a).
- Smith et al. (2011b) R. P. Smith, N. Tammuz, R. L. D. Campbell, M. Holzmann, and Z. Hadzibabic, Phys. Rev. Lett. 107, 190403 (2011b).
- Burovski et al. (2006) E. Burovski, J. Machta, N. Prokof’ ev, and B. Svistunov, Phys. Rev. B 74, 132502 (2006).
- Yukalov and Yukalova (2007) V. I. Yukalov and E. P. Yukalova, Eur. Phys. J. B 55, 93 (2007).
- Sachdev (2008) S. Sachdev, Nature Phys. 4, 173 (2008).
- Jo et al. (2009) G.-B. Jo, Y.-R. Lee, J.-H. Choi, C. A. Christensen, T. H. Kim, J. H. Thywissen, D. E. Pritchard, and W. Ketterle, Science 325, 1521 (2009).
- Gorshkov et al. (2011) A. V. Gorshkov, S. R. Manmana, G. Chen, J. Ye, E. Demler, M. D. Lukin, and A. M. Rey, Phys. Rev. Lett. 107, 115301 (2011).