X-ray selected galaxy clusters in the Pan-STARRS Medium-Deep Survey††thanks: Some of the data presented herein were obtained at the W.M. Keck Observatory, which is operated as a scientific partnership among the California Institute of Technology, the University of California and the National Aeronautics and Space Administration. The Observatory was made possible by the generous financial support of the W.M. Keck Foundation.
Abstract
We present the results of a pilot study for the extended MACS survey (eMACS), a comprehensive search for distant, X-ray luminous galaxy clusters at . Our pilot study applies the eMACS concept to the 71 deg2 area extended by the ten fields of the Pan-STARRS1 (PS1) Medium Deep Survey (MDS). Candidate clusters are identified by visual inspection of PS1 images in the g,r, i, and z bands in a arcmin2 region around X-ray sources detected in the ROSAT All-Sky Survey (RASS). To test and optimize the eMACS X-ray selection criteria, our pilot study uses the largest possible RASS database, i.e., all RASS sources listed in the Bright and Faint Source Catalogs (BSC and FSC) that fall within the MDS footprint. We apply no additional constraints regarding X-ray flux, spectral hardness ratio, or photon statistics and lower the redshift threshold to to extend the probed luminosity range to poorer systems. Scrutiny of PS1/MDS images for 41 BSC and 200 FSC sources combined with dedicated spectroscopic follow-up observations results in a sample of 11 clusters with estimated or spectroscopic redshifts of .
In order to assess and quantify the degree of point source contamination of the observed RASS fluxes, we examine archival Chandra data obtained in targeted and serendipitous observations of six of the 11 clusters found. As expected, the diffuse emission from all six systems is contaminated by point sources to some degree, and for half of them AGN emission dominates. X-ray follow-up observations will thus be crucial in order to establish robust cluster luminosities for eMACS clusters.
Although the small number of distant X-ray luminous clusters in the MDS does not allow us to make firm predictions for the over 20,000 deg2 of extragalactic sky covered by eMACS, the identification of two extremely promising eMACS cluster candidates at (both yet to be observed with Chandra) in such a small solid angle is encouraging. Representing a tremendous gain over the presently known two dozen such systems from X-ray, optical, and SZ cluster surveys combined, the sample of over 100 extremely massive clusters at expected from eMACS would be invaluable for the identification of the most powerful gravitational lenses in the Universe, as well as for in-depth and statistical studies of the physical properties of the most massive galaxy clusters out to .
keywords:
Galaxy clusters: general; X-rays: galaxies: clusters1 Introduction
Massive galaxy clusters ( M⊙) play a central role in extragalactic astronomy. Containing vast amounts of dark and luminous matter, they are rewarding targets for studies of, e.g., galaxy evolution in dense environments, intra-cluster gas dynamics, or the properties of dark matter (e.g., Edge et al. 2002; Markevitch & Vikhlinin 2007; Bradač et al. 2008; Ma et al. 2008, 2010; Korngut et al. 2011; Ma & Ebeling 2011; Oguri et al. 2012; Owers et al. 2012). Thanks to the very high mass surface density of their cores, massive clusters also represent extremely powerful gravitational lenses that allow the detection and study of faint and distant galaxies out to redshifts far beyond the reach of man-made telescopes (e.g., Limousin et al. 2007; Ebeling et al. 2009; Richard et al. 2011; Coe et al. 2012). In addition, statistical samples of massive clusters constitute highly sensitive probes of cosmological parameters already at (e.g., Allen et al. 2008; Mantz et al. 2010), much more so than low-mass clusters which provide comparable leverage only at much higher redshift.
It follows that the availability of well selected samples of massive clusters, in particular at intermediate to high redshifts, is vital to many key topics of astrophysical and cosmological research, and much progress has been made in this regard in recent years. From X-ray detections listed in the ROSAT All-Sky Survey (RASS) Bright Source Catalogue (BSC; Voges et al. 1999), the Massive Cluster Survey (MACS; Ebeling, Edge & Henry 2001) compiled an X-ray selected sample of over 120 very X-ray luminous clusters at (Ebeling et al. 2007, 2010; Mann & Ebeling 2012) within a solid angle of over 22,000 deg2, defined by , . Increasing the number of such clusters known by over a factor of 30 over previous samples, MACS has enabled countless in-depth as well as statistical studies of massive clusters and of the distant Universe behind them (e.g., Allen et al. 2008; Smith et al. 2009; Swinbank et al. 2010; Coe et al. 2013). More recently, surveys exploiting the Sunyaev-Zel’dovich (SZ) effect (Sunyaev & Zel’dovich 1972) have begun to probe the same extreme area of mass-redshift space, adding additional clusters out to [Planck, South Pole Telescope (SPT)]. X-ray follow-up has proven critical though for SZ cluster surveys in order to eliminate false positives caused by complex correlated noise patterns as well as unrelated radio sources. Again, the RASS has been invaluable in this regard: “SZ candidates with no detection at all in [the] RASS are almost certainly false” (Planck Collaboration 2013).
We here present results from a pilot study for the extended Massive Cluster Survey (eMACS), a new, very large-area cluster survey that combines X-ray selection with optical confirmation in its quest for the most massive clusters at . In Sections 2 and 3 we briefly introduce the X-ray and optical databases underlying eMACS. Section 4 provides an overview of the eMACS project, followed by a discussion of the importance of contamination from X-ray point sources in Section 5. The design of our pilot study as well as our results are presented in Sections 6 and 7, respectively. We examine available Chandra data for the clusters in our sample in Section 8, briefly discuss the relevance of cluster velocity dispersions in Section 9, and close with a summary of our findings and their implications for future work (Section 10). Throughout we adopt the concordance CDM cosmology with , , and km s-1 Mpc-1.
2 X-ray source catalogues from the RASS
X-ray sources detected in the RASS are catalogued in two separate lists, the Bright Source Catalogue (BSC) and the Faint Source Catalogue (FSC). The former contains almost 19,000 sources that meet the criteria LH and (LH is the likelihood of detection, and is the number of net source photons); the latter comprises approximately 106,000 additional detections down to LH and . Since exposure time is not constant in the RASS, but varies from less than 100 s (for some 3 per cent of the sky) to over 10,000 seconds in the immediate vicinity of the ecliptic poles, the criteria used to separate FSC and BSC sources do not correlate with source flux. As a result, intrinsically bright sources can be found in both catalogs, which makes the much larger FSC a database of enormous promise for surveys of distant, X-ray luminous clusters.
3 Pan-STARRS
| MDS field centre | RASS statistics | |||||
|---|---|---|---|---|---|---|
| Name | Description | R.A. (J2000) Dec | (s) | (BSC) | (FSC) | |
| MD01 | XMM-LSS / VVDS | 02 23 30 | 04 15 00 | 3 | 10 | |
| MD02 | CDFS/GOODS-S | 03 32 24 | 27 48 00 | 0 | 4 | |
| MD03 | IFA/Lynx | 08 42 22 | 44 19 00 | 4 | 8 | |
| MD04 | COSMOS | 10 00 00 | 02 12 00 | 4 | 27 | |
| MD05 | Lockman Hole | 10 47 40 | 58 05 00 | 7 | 22 | |
| MD06 | NGC 4258 | 12 20 00 | 47 07 00 | 7 | 27 | |
| MD07 | DEEP2 Field 1 | 14 14 49 | 53 05 00 | 5 | 39 | |
| MD08 | ELAIS-N1 | 16 11 09 | 54 57 00 | 6 | 50 | |
| MD09 | SA22 / VVDS | 22 16 45 | 00 17 00 | 3 | 4 | |
| MD10 | DEEP2 Field 3 | 23 29 15 | 00 26 00 | 2 | 9 | |
Pan-STARRS (Kaiser et al. 2002) is a wide-field imaging facility on the summit of Haleakala (Hawai’i). At present, it consists of Pan-STARRS1 (PS1), a single 1.8-m telescope with a 7 deg2 field of view, a gigapixel camera with on-chip guiding capabilities, and a , , , , filter set (Tonry et al. 2012). PS1 began operations in 2010 March and has since embarked on several survey programmes, two of which are of particular interest for extragalactic astronomy: the Medium Deep Survey (MDS), covering the 10 fields listed in Table 1 and reaching exposure times of several hours in each passband, and the “3” survey111A detailed description of the survey is provided by Chambers et al. (in preparation)., a 3-year survey of the entire sky visible from Hawaii.
4 eMACS
The eMACS project aims to expand the MACS cluster survey to higher redshift and lower X-ray fluxes by combining the two large-area imaging data sets introduced in the preceding sections: the RASS and the PS1 “3” survey.
Our strategy for the identification of galaxy clusters at from these data sets is brute force: we select all X-ray sources listed in the RASS BSC and FSC that fall within our study area, and then examine PS1 images in the , , , and bands in a arcmin2 region around the X-ray source position. Candidate clusters at intermediate to high redshift () are readily identifiable as pronounced overdensities of faint, red galaxies. In order to prevent seemingly blank fields from erroneously being classified as potentially very distant clusters, we also query the NASA Extragalactic Database (NED) for known celestial objects within 2 arcmin radius of the respective X-ray source, a process that eliminates large numbers of active galactic nuclei (AGN) and quasi-stellar objects (QSOs). Further details of the eMACS cluster selection strategy are provided by Ebeling et al. (in preparation).
Clusters selected in the process described above are scrutinized again prior to inclusion in the spectroscopic follow-up phase of eMACS. To limit such targeted follow-up to the most promising candidates without sacrificing completeness, only systems estimated to be at are selected. While the primary goal of spectroscopic observations is the measurement of the cluster redshift, secondary goals include an assessment of the cluster velocity dispersion (we aim to secure redshifts of at least 10 cluster members) and the spectroscopic identification of potential AGN and QSOs in the cluster vicinity.
5 Point-source contamination
With X-ray point sources outnumbering galaxy clusters 100:1 per solid angle, contamination from AGN and QSOs poses a problem for all X-ray cluster surveys. Although optical evidence of an overdensity of galaxies at the location of an X-ray source strongly suggests a cluster ID, the possibility of severe contamination from point sources, or in fact of a misidentification, always exists.
A simple probabilistic argument can be made to illustrate the relevance of cluster mass in this context. The comoving space density of clusters of low X-ray luminosity ( erg s-1) at is about Mpc-3 (e.g., Mullis et al. 2004), almost 10 times higher than that of very X-ray luminous AGN ( erg s-1) at (Miyaji, Hasinger & Schmidt 2000). Hence, if the X-ray luminosity implied by the redshift of a distant, but optically poor cluster of galaxies near a RASS source approaches or exceeds erg s-1, we are likely dealing with either a chance coincidence or a blend of point-like and cluster emission. This picture changes dramatically for very rich and massive clusters whose space density at is only a few Mpc-3, about two orders of magnitudes lower than that of comparably X-ray luminous QSOs. A spatial coincidence of a RASS X-ray source with an optically rich cluster at can thus be taken as almost certainly physical in nature. A quantitative example of this argument is discussed in detail by Zenn & Ebeling (2010).
Although our focus on extremely massive clusters thus mitigates the risk of misidentifications, two caveats remain. For one, a cluster’s optical richness is only loosely correlated with X-ray luminosity or mass, and hence significant contamination from X-ray point sources can never be ruled out from RASS data alone. Secondly, highly evolved (i.e., fully relaxed) clusters can appear deceivingly poor in the optical waveband, in particular in shallow images. Spatial coincidences between a RASS source and a seemingly lone, giant, distant elliptical galaxy must thus not be dismissed but scrutinized further until the presence of a massive cool-core cluster can be firmly ruled out.
6 An eMACS pilot study
Our pilot study explores the validity of the eMACS survey strategy by applying it to PS1 data for the ten fields of the MDS. At a limiting magnitude of 26.3 (5) for the band, the MDS is significantly deeper than the projected limit of the survey (). Our pilot study thus does not aim to test the efficiency or reliability of optical cluster confirmations obtained by eMACS based on PS1- images. Instead, we use MDS data to eliminate any uncertainties caused by the limited depth of the survey’s images, thus allowing us to assess whether the faintest RASS sources, comprising no more than a handful of X-ray photons, indeed constitute credible detections that can be used to identify massive galaxy clusters to redshifts approaching .
A grand total of 41 BSC and 200 FSC sources fall within 1.5 degrees (radius) of the MDS field centres listed in Table 1. The average RASS exposure time varies greatly between MDS fields (from a mere 50 to over 1,000 s), and in fact even within a given field. Since the log–log distribution, i.e., the number of RASS X-ray sources of a given flux, increases strongly with decreasing source flux (e.g., Ebeling et al. 1998; Voges et al. 1999), the total projected surface density of RASS sources varies dramatically too (Table 1).
The results of applying the eMACS cluster selection strategy (outlined in Section 4) to RASS sources in our study area are described in the following section.
7 Results
We subject each of the 241 RASS sources that fall within the footprint of the PS1 MDS to the screening process described in Section 4. Since the depth of the MDS is easily sufficient to reveal massive clusters out to as pronounced overdensities of galaxies of similar colour, the results of this screening process are binary in nature: a given RASS source is classified either as a massive cluster at a measured or estimated redshift in excess of — or not. Although we record plausible non-cluster identifications for statistical purposes (see below), we are not concerned at all about classifying RASS sources as of “unknown origin”, since our goal is not the identification of optical counterparts to all RASS sources, but only the identification of extremely massive and distant clusters.
Based on entries listed in NED, we tentatively identify 96 of the 241 RASS sources within the PS1 MD fields as QSOs or AGN, and eight as bright stars. The distribution of offsets between the nominal RASS positions of these 96 X-ray sources and the location of the adopted optical counterpart is shown in Fig 1. The width of the distribution is in excellent agreement with the pixel size of 45″, chosen for the RASS as an approximation of the size of the point-spread function of the ROSAT Position-Sensitive Proportional Counter (PSPC) in survey mode.

27 BSC and FSC sources are classified as likely galaxy clusters. Of these, 12 have literature redshifts. For an additional six without cluster redshifts NED provides a spectroscopic redshift for the brightest cluster galaxy (BCG) which we adopt as the likely cluster redshift. Another five cluster candidates have estimated or photometric literature redshifts. To the remaining four we assign a crude redshift estimate based on their optical appearance. This first iteration of our cluster compilation process results in a list of 11 clusters known or estimated to be at Entries in this list that do not have secure spectroscopic redshifts are selected for spectroscopic follow-up observations, described in more detail in the Appendix.
For all five clusters observed by us we find the measured redshift to confirm our estimate of ; three systems are found to lie at . At the time of this writing, two clusters (with estimated redshifts of and 0.65, respectively) still await spectroscopic confirmation. Basic properties of all 11 clusters are listed in Table 2 where we assign eMACS names to all systems with . In the field of one system (RXJ1613.7+5542) we find a foreground broad-line AGN superimposed on the cluster core. Although we cannot quantify what fraction of the RASS flux can be attributed to this AGN, we expect it to contribute significantly and thus mark this cluster as contaminated in Table 2. The positions and redshifts of all individual galaxies successfully observed during our spectroscopic follow-up can be found in Table 3 where we also list velocity dispersions for all five clusters.
| FSC/ | ||||||||||
|---|---|---|---|---|---|---|---|---|---|---|
| Name | Other name | R.A. & Dec (J2000) | BSC | RASS | CXO | ref | ||||
| eMACS J0840.2+4421 | 08 40 14.0 44 21 53 | F | 15 | 1.13 | 0.6393 | 14.4 | 1310 | (1) | ||
| RXJ0959.0+0255 | MaxBCG J149.94873+00.81880 | 09 59 02.8 02 55 37 | F | 14 | 0.53 | 0.3494 | 1.9 | 590 | (1) | |
| eMACS J1057.5+5759 | SL J1057.5+5759 | 10 57 35.0 57 59 35 | B | 28 | 0.76 | 0.5978 | 8.5 | 860 | (1) | |
| RXJ1411.3+5212 | 3C 295, MACS J1411.3+5212 | 14 11 21.2 52 12 50 | B | 51 | 1.07 | 0.4600 | 6.7 | 10.1 | 1570 | (2) |
| eMACS J1419.2+5326 | RCS J141910+5326.2 | 14 19 15.2 53 26 44 | F | 13 | 0.27 | 0.6384 | 3.6 | 3.2 | 1020 | (1) |
| RXJ1610.7+5406 | WHL J161040.5+540630 | 16 10 46.5 54 06 55 | F | 8 | 0.11 | 0.3375a | 0.4 | 0.5 | (590) | (3) |
| RXJ1611.5+5417 | WHL J161135.9+541634 | 16 11 34.7 54 17 04 | F | 28 | 0.37 | 0.3381 | 1.2 | 2.3 | (810) | (3) |
| RXJ1613.7+5542 | WHL J161342.1+554155 | 16 13 42.3 55 42 02 | F | 34 | 0.39 | 0.3512 | 1.4 | Cont. | (590) | (1) |
| eMACS J1614.1+5404 | 16 14 06.4 54 04 09 | F | 7 | 0.11 | (0.65 ) | 1.7 | ||||
| RXJ1614.2+5442 | RX J1614.2+5442 | 16 14 15.1 54 42 47 | B | 60 | 0.82 | 0.331 | 2.6 | Cont. | (4) | |
| eMACS J1616.7+5545 | SpARCS J161641+554513 | 16 16 43.9 55 45 55 | F | 28 | 0.34 | 1.161 | 16.2 | 3.3 | (920) | (5) |
Note. Redshift references: (1) this work, (2) Mann & Ebeling (2012), (3) Trichas et al. (2010), (4) Edge et al. (2003), (5) Demarco et al. (2010); redshifts in parentheses are photometric estimates. Point-source corrected X-ray luminosities are listed where suitable Chandra data are available; we use the column also to qualitatively mark two clusters as contaminated by AGN emission based on optical or X-ray evidence (see also Sections 7 and 8). a BCG redshift.
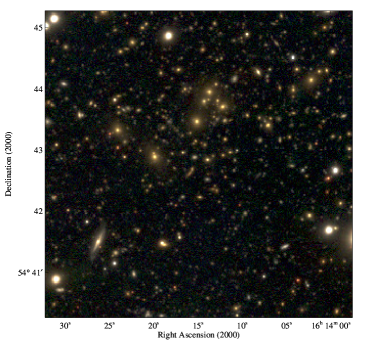
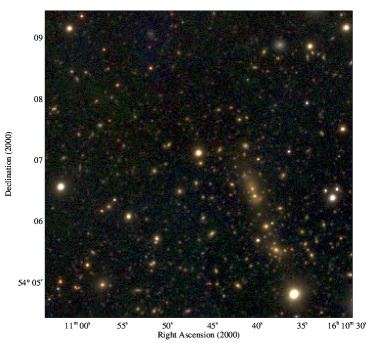
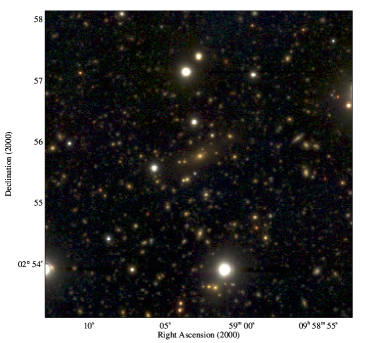
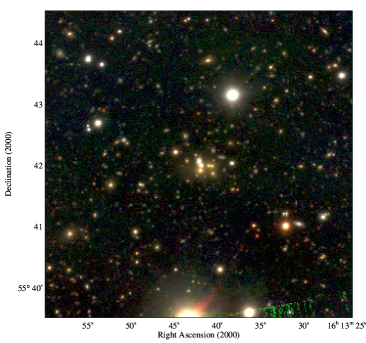
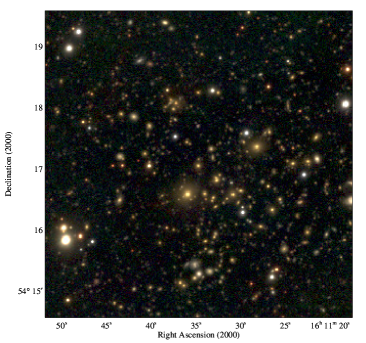
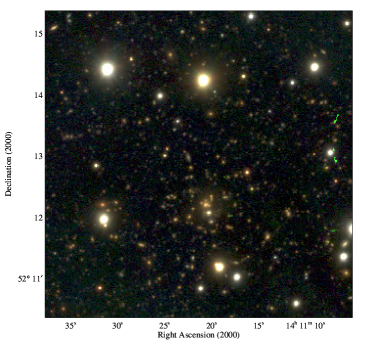
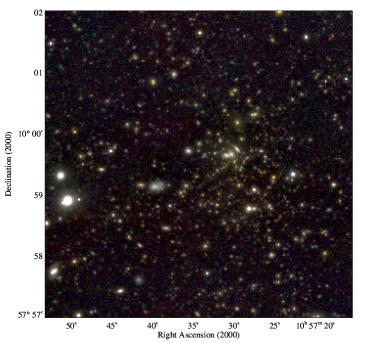
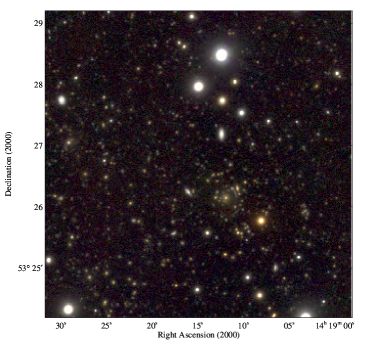
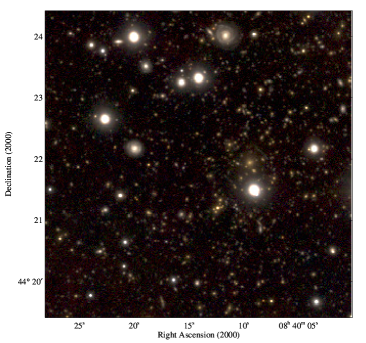
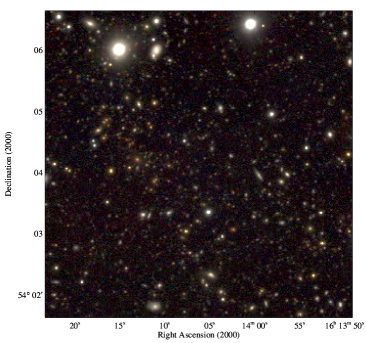
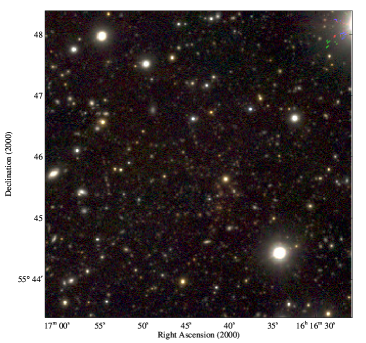
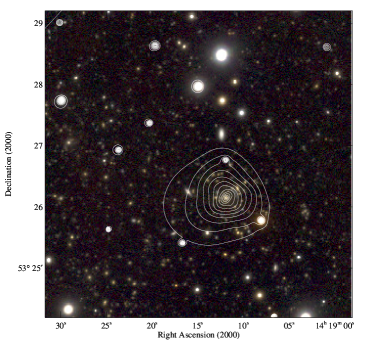
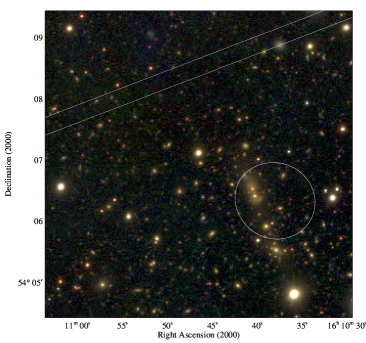
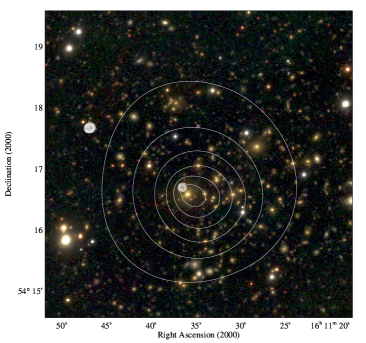
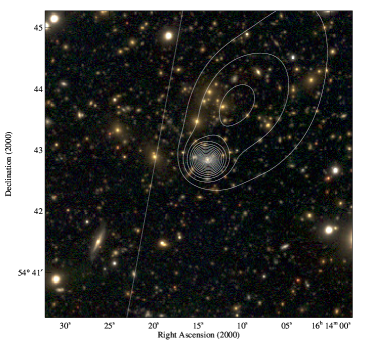
From top to bottom and left to right: eMACS J1057.5+5759 (, ), eMACS J1419.2+5326 (, ), eMACS J0840.2+4421 (, ), eMACS J1614.1+5404 (, ), and eMACS J1616.7+5545 (, ).
8 X-ray follow-up observations
As discussed in Section 5, contamination from X-ray point sources affects all X-ray cluster surveys, although its impact is (statistically) less severe for collections of extremely massive clusters. For individual RASS-discovered systems, however, the presence and degree of point-source contamination can be quantified only by X-ray follow-up observations. The facility of choice for this purpose is the Chandra Observatory, whose 0.5″on-axis resolution allows the unambiguous identification (and removal) of point sources even in relatively short observations.
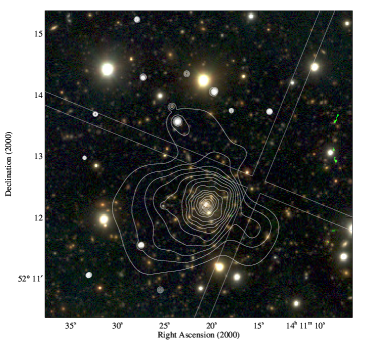
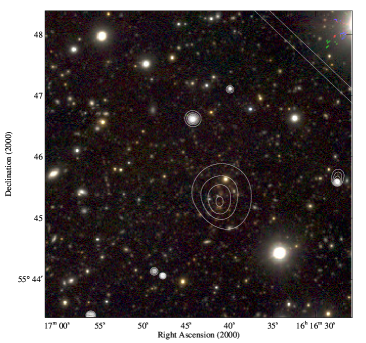
For six of the 11 clusters detected in our eMACS pilot project, Chandra data are already available. One of them is RXJ1411.3+5212, the well studied cluster around the powerful radio source 3C 295 (Allen et al. 2001). RXJ1610.7+5406, RXJ1611.5+5417, and RXJ1614.2+5442 were serendipitously observed during a shallow Chandra survey of AGN in the European Large-Area ISO Survey North 1 (ELAIS-N1) field (MD08). The remaining two clusters, eMACS J1419.2+5326 and eMACS J1616.7+5545, are previously identified, optically selected clusters for which high-resolution Chandra observations were awarded to the original discoverers. X-ray/optical overlays for all six clusters are shown in Fig. 4.
Of the five clusters observed with Chandra, two are found to feature point-source corrected luminosities that fall significantly below the RASS estimates (see Table 2). For a third one (RXJ1614.2+5442) the coverage of the cluster by the existing (serendipitous) Chandra data is insufficient to allow a reliable flux measurement; the data show clearly though that the RASS flux is dominated by a bright point source (Fig. 4). Of the two clusters at that have archival Chandra data, the most distant one (eMACS J1616.7+5545 at ) is found to be a blend of a bright, unrelated QSO and a moderately X-ray luminous cluster. Chandra observations also confirm eMACS J1419.2+5326 at as intrinsically X-ray luminous; however, it too is significantly contaminated by several X-ray point sources. Of the three point sources closest to the core of eMACS J1419.2+5326, one is a star, and the other two are background QSOs (see Fig. 4 and Table 3). Again, the contaminating point sources are thus projected onto the cluster, as assumed in the probabilistic argument put forward in Section 5.
Figure 2 shows offsets of, on average, almost 40″ (corresponding to over 160 kpc at and over 220 kpc at ) between the position of a RASS X-ray source and the location of the BCG or, more generally, the cluster core. The reasons for such misalignments, which are much larger than those observed for true X-ray point sources (Fig. 1), are threefold. For one, the intrinsically extended emission from clusters, in particular of unrelaxed systems, causes larger positional uncertainties, even if, at the resolution of the RASS, the extent of the emission is usually not resolved at . The two other causes of the X-ray / optical offsets apparent in Fig. 2 are illustrated by Fig. 4. In most cases (RXJ1411.3+5212, eMACS J1419.2+5326, RXJ1614.2+5442, and eMACS J1616.7+5545), blends of X-ray point sources and the cluster emission are responsible for the observed X-ray / optical misalignment. For very faint RASS sources, however, similarly large offsets can simply be the result of exceedingly poor photon statistics in the RASS (RXJ1610.7+5406, eight net RASS photons).
9 Cluster velocity dispersions
As pointed out in the previous section, a significant distance between a RASS source from the BCG of its presumed cluster counterpart may be indicative of the presence of contaminating X-ray point sources. Point-source contamination can, however, be significant also for clusters that show only small X-ray / optical offsets.
Cluster velocity dispersions could, in principle, be used as an alternative way to flag systems that are unlikely to be as X-ray luminous (or massive) as suggested by their RASS flux since, for virialized systems, the dispersion of the radial velocities of cluster galaxies is well correlated with cluster mass (Carlberg et al. 1996). However, most clusters, in particular at moderate to high redshift, are still growing and often observed before, during, or after significant merger events (e.g., Mann & Ebeling 2012). For such systems, the observed velocity dispersion can be boosted well beyond the virial value. In addition, observational biases (viewing angle, unrepresentative sampling) can lead to either over- or underestimates of the virial mass. As a result, cluster velocity dispersions should be used with great caution when mass estimates are sought for individual clusters.
We list in Table 2 velocity dispersions, , based on galaxy redshifts obtained either from the literature or from our own measurements, as tabulated in Table 3. For systems with fewer than 10 redshifts, the listed values should be considered rough estimates. We find velocity dispersions ranging from approximately 600 km for several moderately X-ray luminous clusters at to over 1500 km for the very X-ray luminous 3C 295 cluster (MACS J1411.3+5212).
Unsurprisingly, we find the values listed in Table 2 to be poorly correlated with cluster X-ray luminosity. Indeed, the 12 most distant MACS clusters (all of them confirmed to be massive systems at ) currently have measured velocity dispersions between 750 and over 1,600 km s-1. This wide range of velocity dispersions encompasses all of the values listed in Table 2 for cluster detections in the same redshift range from our eMACS pilot study. We conclude that velocity dispersions may allow the elimination of some low-mass systems from a sample of eMACS candidate clusters; serious disadvantages of velocity dispersions are that they are expensive to obtain and noisy as predictors of X-ray luminosity (or mass).
10 Summary and Discussion
Our eMACS pilot study conducted within the 71 deg2 of the PS1 MDS confirms the premise of the eMACS project that even the faintest sources from the RASS BSC and FSC catalogues can be used to successfully identify distant, X-ray luminous clusters. X-ray follow-up observations with Chandra, however, also confirm that contamination from X-ray point sources is common and often severe at such low flux levels. This is a particular concern at the highest redshifts probed by eMACS, where clusters of low to moderate mass can masquerade as exceptionally X-ray luminous by virtue of being blended with nearby, X-ray bright point sources222SpARCS J161641+554513 at provides a striking example of this effect. . While focusing on the optically richest candidates helps to prevent misidentifications, the ubiquity of X-ray luminous QSOs makes high-resolution follow-up with Chandra a necessity if accurate cluster luminosities are to be established.
Since point-source contamination and blends in the RASS can only boost but never lower the RASS flux of eMACS cluster candidates, we interpret as a de facto upper limit to the true cluster flux and adopt erg s-1 as a luminosity requirement that must be met by any eMACS cluster candidate selected from the FSC or BSC at a measured or estimated redshift of . Of the 11 clusters from our pilot-study sample, four meet this requirement. It is clear though from simple scaling arguments (four eMACS candidates in 71 deg2 imply a yield of over 1,000 such clusters within the full eMACS solid angle of over 20,000 deg2) that the majority of the clusters thus selected can not conceivably be as X-ray luminous as suggested by their RASS fluxes. Consistent with this expectation, Chandra observations of two of the four eMACS candidate clusters identified in our pilot study333We note that the Chandra observations for both of these clusters were awarded as the result of these systems’ independent discovery in optical cluster surveys. indeed found bright X-ray point sources in the immediate vicinity of either cluster, resulting in point-source corrected luminosities that fall well short of the eMACS target of erg s-1.
To reduce the prohibitively (and erroneously) large number of seemingly eMACS-like clusters created by the superposition of unrelated X-ray point sources, we investigate optical cluster properties in search of an additional selection criterion; our aim being to identify the clusters among our candidates that have the highest probability of truly being as X-ray luminous as implied by their RASS fluxes. The data collected in our pilot study and presented in Figs. 2 and 4, as well as in Table 3, prove instructive in this regard. Adopting a threshold of km s-1 for the cluster velocity dispersion eliminates clusters of low to moderate mass, but cannot discriminate between genuinely massive clusters and poorer systems whose velocity dispersion is boosted by ongoing mergers or infall along our line of sight444An example of such orientation bias for an evolving cluster is RCS J141910+5326.2 (eMACS J1419.2+5326) at which features a velocity dispersion of over 1,000 km s-1 but falls well short of eMACS X-ray luminosity requirements.. A complementary criterion is provided by the offset between the RASS source position and the position of the BCG. For all but the least significant RASS detections, offsets exceeding 300 kpc at the cluster redshift point to the likely presence of contaminating X-ray point sources. Finally, a third screening criterion can be obtained by simple visual inspection. Imaging data obtained for MACS (e.g., Ebeling et al. 2007, 2010), or of the PS1/MD images of the five eMACS candidate clusters at shown in Fig. 2, show that, at the extreme end of the cluster mass function probed by MACS and eMACS, optical richness becomes a powerful discriminator between truly X-ray luminous clusters and intrinsically poorer systems. RCS J141910+5326.2 and eMACS J0840.2+4421, both at , differ dramatically in this regard (Fig. 2), the former appearing highly compact and optically poor compared to the latter. However, just like velocity dispersion, optical richness too is an unreliable indicator of mass, in the sense that it fails to select highly evolved cool-core clusters (note the unimpressive appearance of the cluster around 3C 295 in Fig. 2). A more robust predictor of cluster mass than optical richness, traditionally understood to be the number of cluster galaxies above a certain magnitude threshold, is the total stellar mass in cluster galaxies (Andreon 2012). However, the respective correlation is presently not well calibrated at high cluster masses.
We conclude that the only reliable way of eliminating impostors from the list of eMACS candidate clusters at is a Chandra snapshot observation. Since performing Chandra observations of all candidates would be prohibitively expensive, the most promising targets need to be selected using velocity dispersions, X-ray / optical offsets, and optical appearance. Applying these criteria retroactively to RCS J141910+5326.2 and SpARCS J161641+554513 (the two eMACS candidates already observed with Chanda) we find both of them to appear at best moderately rich in the optical and to exhibit X-ray / optical offsets that strongly suggest contamination from X-ray point sources – as confirmed by Chandra.
By contrast, eMACS J1057.5+5759 appears as optically rich as the most massive MACS clusters and features only a small X-ray / optical offset. eMACS J0840.2+4421 exhibits an optical morphology suggestive of a very massive, relaxed cluster and a commensurately high velocity dispersion of over 1,300 km s-1. The sizeable offset of 340 kpc between its BCG and the RASS X-ray position, however, suggests the presence of a contaminating X-ray point source to the east of the cluster.
Although the solid angle covered by our pilot study is too small to allow a meaningful extrapolation to the over 20,000 deg2 surveyed by eMACS proper, the discovery of eMACS J0840.2+4421 and eMACS J1057.5+5759 bode well for the eMACS sample being compiled from RASS and PS1 data. Establishing robust, point-source corrected X-ray luminosities with Chandra for both of these systems would provide an important first test of the eMACS survey strategy.
Acknowledgements
HE gratefully acknowledges financial support from NASA/ADP grant NNX11AB04G. We thank Matthew Zargursky for developing code to merge and display PS1/MD imaging data during the early phase of this project. The authors wish to recognize and acknowledge the very significant cultural role and reverence that the summit of Mauna Kea has always had within the indigenous Hawaiian community. We are most fortunate to have the opportunity to conduct observations from this mountain.
The Pan-STARRS1 Surveys (PS1) have been made possible through contributions of the Institute for Astronomy, the University of Hawaii, the Pan-STARRS Project Office, the Max-Planck Society and its participating institutes, the Max Planck Institute for Astronomy, Heidelberg and the Max Planck Institute for Extraterrestrial Physics, Garching, The Johns Hopkins University, Durham University, the University of Edinburgh, Queen’s University Belfast, the Harvard-Smithsonian Center for Astrophysics, the Las Cumbres Observatory Global Telescope Network Incorporated, the National Central University of Taiwan, the Space Telescope Science Institute, and the National Aeronautics and Space Administration under Grant No. NNX08AR22G issued through the Planetary Science Division of the NASA Science Mission Directorate and the University of Maryland.
Appendix A Spectroscopic follow-up observations
Five clusters from the sample listed in Table 2 that lacked secure spectroscopic redshifts prior to our project were targeted in dedicated follow-up observations from Mauna Kea. Spectra of galaxies presumed to be cluster members based on their colour in PS1 images, as well as of objects that might be the source of contaminating point-like X-ray emission, were obtained with the DEIMOS spectrograph (Faber et al. 2003) on the Keck-2 10m telescope. We used the 600 l/mm grism and the GG455 blocking filter to collect low-resolution spectra from 4500Å to 9000Å. Exposure times ranged from s for clusters at to for our most distant targets at . All cluster redshifts thus obtained are listed in Table 2; the individual redshifts measured by us in the four cluster fields are tabulated in Table 3. Also listed in Table 3 are the resulting velocity dispersions.
| Galaxy | R.A. & Dec (J2000) | Galaxy | R.A. & Dec (J2000) | ||
| eMACSJ0840.2+4421-g01 | 08 40 09.35 44 21 54.1 | 0.6384 | eMACSJ0840.2+4421-g17 | 08 40 12.66 44 23 55.7 | 0.6317 |
| eMAC,J0840.2+4421-g02 | 08 40 11.17 44 22 11.6 | 0.6518 | eMACSJ0840.2+4421-g18 | 08 40 01.56 44 24 35.9 | 0.6416 |
| eMACSJ0840.2+4421-g03 | 08 40 12.08 44 21 17.9 | 0.6351 | eMACSJ0840.2+4421-g19 | 08 39 59.04 44 23 39.1 | 0.6416 |
| eMACSJ0840.2+4421-g04 | 08 40 05.67 44 22 43.2 | 0.6476 | eMACSJ0840.2+4421-g20 | 08 39 58.40 44 22 55.3 | 0.6250 |
| eMACSJ0840.2+4421-g05 | 08 40 12.50 44 21 06.1 | 0.6303 | eMACSJ0840.2+4421-g21 | 08 40 03.63 44 20 04.5 | 0.6388 |
| eMACSJ0840.2+4421-g06 | 08 40 18.63 44 21 05.8 | 0.6406 | eMACSJ0840.2+4421-g22 | 08 39 56.54 44 21 04.1 | 0.5677 |
| eMACSJ0840.2+4421-g07 | 08 40 10.31 44 22 46.0 | 0.6430 | eMACSJ0840.2+4421-g23 | 08 39 56.91 44 22 02.6 | 0.3533 |
| eMACSJ0840.2+4421-g08 | 08 40 07.77 44 22 23.8 | 0.6370 | eMACSJ0840.2+4421-g24 | 08 40 11.56 44 19 09.7 | 0.6490 |
| eMACSJ0840.2+4421-g09 | 08 40 12.96 44 21 41.6 | 0.6459 | eMACSJ0840.2+4421-g25 | 08 40 14.01 44 19 33.0 | 0.6402 |
| eMACSJ0840.2+4421-g10 | 08 40 01.53 44 22 35.5 | 0.6448 | eMACSJ0840.2+4421-g26 | 08 40 11.08 44 20 05.2 | 0.6427 |
| eMACSJ0840.2+4421-g11 | 08 40 00.24 44 23 13.4 | 0.6424 | eMACSJ0840.2+4421-g27 | 08 40 15.40 44 20 16.9 | 0.6432 |
| eMACSJ0840.2+4421-g12 | 08 40 07.22 44 22 14.1 | 0.6408 | eMACSJ0840.2+4421-g28 | 08 40 11.47 44 20 17.1 | 0.6305 |
| eMACSJ0840.2+4421-g13 | 08 40 13.66 44 23 54.0 | 0.6322 | eMACSJ0840.2+4421-g29 | 08 40 16.65 44 18 33.0 | 0.6410 |
| eMACSJ0840.2+4421-g14 | 08 40 01.90 44 23 40.5 | 0.6423 | eMACSJ0840.2+4421-g30 | 08 40 14.87 44 21 02.1 | 0.6359 |
| eMACSJ0840.2+4421-g15 | 08 40 01.19 44 23 59.9 | 0.6285 | eMACSJ0840.2+4421-g31 | 08 40 22.11 44 19 14.4 | 0.6485 |
| eMACSJ0840.2+4421-g16 | 08 40 00.84 44 24 07.1 | 0.6282 | eMACSJ0840.2+4421-g32 | 08 40 07.29 44 22 41.8 | 0.6333 |
| eMACSJ0840.2+4421 | |||||
| RXJ0959.0+0255-g01 | 09 59 02.72 02 54 29.0 | 0.3304 | RXJ0959.0+0255-g23 | 09 59 22.85 02 53 10.1 | 0.3471 |
| RXJ0959.0+0255-g02 | 09 59 01.73 02 53 36.1 | 0.3517 | RXJ0959.0+0255-g24 | 09 58 37.12 02 57 05.2 | 0.3522 |
| RXJ0959.0+0255-g03 | 09 58 41.58 03 02 02.9 | 0.3322 | RXJ0959.0+0255-g25 | 09 58 33.79 03 03 00.6 | 0.3319 |
| RXJ0959.0+0255-g04 | 09 59 00.48 02 55 43.8 | 0.3499 | RXJ0959.0+0255-g26 | 09 58 31.80 02 59 54.7 | 0.2109 |
| RXJ0959.0+0255-g05 | 09 59 00.75 02 56 03.9 | 0.3458 | RXJ0959.0+0255-g27 | 09 58 40.39 03 00 53.0 | 0.4959 |
| RXJ0959.0+0255-g06 | 09 59 07.33 02 55 14.6 | 0.3478 | RXJ0959.0+0255-g28 | 09 58 41.21 02 56 40.6 | 0.6107 |
| RXJ0959.0+0255-g07 | 09 59 12.32 02 55 52.3 | 0.3534 | RXJ0959.0+0255-g29 | 09 58 44.68 02 58 21.7 | 0.7030 |
| RXJ0959.0+0255-g08 | 09 58 56.88 02 56 20.4 | 0.3464 | RXJ0959.0+0255-g30 | 09 58 45.46 02 56 38.2 | 0.7094 |
| RXJ0959.0+0255-g09 | 09 59 13.26 02 51 17.6 | 0.2297 | RXJ0959.0+0255-g31 | 09 58 50.61 02 57 40.9 | 0.5082 |
| RXJ0959.0+0255-g10 | 09 59 22.14 02 52 37.8 | 0.3462 | RXJ0959.0+0255-g32 | 09 58 54.75 02 57 57.5 | 0.6449 |
| RXJ0959.0+0255-g11 | 09 59 16.87 02 52 52.3 | 0.3477 | RXJ0959.0+0255-g33 | 09 58 51.50 02 56 07.0 | 0.3512 |
| RXJ0959.0+0255-g12 | 09 59 25.07 02 52 59.0 | 0.3468 | RXJ0959.0+0255-g34 | 09 59 05.36 02 53 45.4 | 0.3493 |
| RXJ0959.0+0255-g13 | 09 59 19.04 02 52 41.4 | 0.3318 | RXJ0959.0+0255-g35 | 09 59 01.69 02 55 47.9 | 0.3486 |
| RXJ0959.0+0255-g14 | 09 58 40.26 02 57 52.4 | 0.2205 | RXJ0959.0+0255-g36 | 09 59 03.53 02 55 21.8 | 0.2115 |
| RXJ0959.0+0255-g15 | 09 58 31.77 02 58 58.6 | 0.3334 | RXJ0959.0+0255-g37 | 09 59 18.53 02 54 02.9 | 0.4945 |
| RXJ0959.0+0255-g16 | 09 58 38.21 02 59 36.1 | 0.4269 | RXJ0959.0+0255-g38 | 09 59 06.36 02 54 20.4 | 0.3513 |
| RXJ0959.0+0255-g17 | 09 58 36.30 02 58 12.5 | 0.3552 | RXJ0959.0+0255-g39 | 09 59 11.60 02 55 24.8 | 0.4240 |
| RXJ0959.0+0255-g18 | 09 58 50.42 02 56 05.9 | 0.3504 | RXJ0959.0+0255-g40 | 09 59 07.67 02 52 22.4 | 0.3513 |
| RXJ0959.0+0255-g19 | 09 58 54.84 02 59 32.8 | 0.3493 | RXJ0959.0+0255-g41 | 09 59 09.58 02 51 47.2 | 0.3066 |
| RXJ0959.0+0255-g20 | 09 58 51.81 02 59 17.0 | 0.2821 | RXJ0959.0+0255-g42 | 09 58 36.16 02 57 26.5 | 0.4977 |
| RXJ0959.0+0255-g21 | 09 58 57.01 02 57 19.7 | 0.3477 | RXJ0959.0+0255-g09s | 09 59 13.67 02 51 12.9 | 0.6099 |
| RXJ0959.0+0255-g22 | 09 59 21.07 02 54 40.6 | 0.3478 | |||
| RXJ0959.0+0255 | |||||
| eMACSJ1057.5+5759-g01 | 10 57 31.01 57 59 45.5 | 0.6015 | eMACSJ1057.5+5759-g19 | 10 57 39.63 57 56 55.1 | 0.5987 |
| eMACSJ1057.5+5759-g02 | 10 57 30.48 58 00 16.5 | 0.5951 | eMACSJ1057.5+5759-g20 | 10 57 16.83 57 56 42.7 | 0.5994 |
| eMACSJ1057.5+5759-g03 | 10 57 29.99 57 59 15.4 | 0.5920 | eMACSJ1057.5+5759-g21 | 10 57 24.99 57 55 45.7 | 0.5969 |
| eMACSJ1057.5+5759-g04 | 10 57 36.47 57 59 13.1 | 0.5899 | eMACSJ1057.5+5759-g22 | 10 57 10.78 57 55 46.6 | 0.5961 |
| eMACSJ1057.5+5759-g05 | 10 57 33.82 57 58 14.8 | 0.5927 | eMACSJ1057.5+5759-g23 | 10 57 08.15 57 54 23.3 | 0.7634 |
| eMACSJ1057.5+5759-g06 | 10 57 19.17 57 58 12.1 | 0.5998 | eMACSJ1057.5+5759-g24 | 10 57 28.98 57 52 59.9 | 0.5756 |
| eMACSJ1057.5+5759-g07 | 10 57 41.00 58 00 53.8 | 0.6050 | eMACSJ1057.5+5759-g25 | 10 57 32.59 57 58 55.4 | 0.5965 |
| eMACSJ1057.5+5759-g08 | 10 57 30.90 58 00 48.4 | 0.5975 | eMACSJ1057.5+5759-g26 | 10 57 32.92 58 03 44.2 | 0.7464 |
| eMACSJ1057.5+5759-g09 | 10 57 27.65 57 57 13.6 | 0.5958 | eMACSJ1057.5+5759-g27 | 10 57 27.81 58 04 12.9 | 0.6023 |
| eMACSJ1057.5+5759-g10 | 10 57 36.96 57 56 05.3 | 0.5973 | eMACSJ1057.5+5759-g28 | 10 57 37.85 58 04 19.2 | 0.6018 |
| eMACSJ1057.5+5759-g11 | 10 57 29.90 58 00 00.8 | 0.5928 | eMACSJ1057.5+5759-g29 | 10 58 03.43 58 05 14.0 | 0.5991 |
| eMACSJ1057.5+5759-g12 | 10 57 32.09 58 00 28.0 | 0.5960 | eMACSJ1057.5+5759-g30 | 10 57 56.01 58 06 01.3 | 0.6527 |
| eMACSJ1057.5+5759-g13 | 10 57 22.75 57 58 25.0 | 0.5954 | eMACSJ1057.5+5759-g31 | 10 57 43.52 58 04 56.4 | 0.6465 |
| eMACSJ1057.5+5759-g14 | 10 57 25.90 57 58 54.0 | 0.5988 | eMACSJ1057.5+5759-g32 | 10 57 32.73 58 02 09.9 | 0.6035 |
| eMACSJ1057.5+5759-g15 | 10 57 34.46 58 02 18.6 | 0.6328 | eMACSJ1057.5+5759-g01s | 0.6051 | |
| eMACSJ1057.5+5759-g16 | 10 57 22.56 58 02 31.6 | 0.7453 | eMACSJ1057.5+5759-g12s | 1.0993 | |
| eMACSJ1057.5+5759-g17 | 10 57 12.29 57 56 38.2 | 0.6328 | eMACSJ1057.5+5759-g14s | 0.6089 | |
| eMACSJ1057.5+5759-g18 | 10 57 35.70 57 56 31.9 | 0.5967 | |||
| eMACSJ1057.5+5759 | |||||
Galaxy redshifts obtained with Keck-II/DEIMOS during our eMACS pilot study. Galaxy R.A. & Dec (J2000) Galaxy R.A. & Dec (J2000) eMACSJ1419.2+5326-x1 14 19 16.79 53 25 26.4 1.0907a eMACSJ1419.2+5326-g22 14 19 30.88 53 26 10.0 0.6347 eMACSJ1419.2+5326-x2 14 19 12.27 53 26 48.6 2.0027a eMACSJ1419.2+5326-g23 14 19 35.17 53 27 29.0 0.6361 eMACSJ1419.2+5326-g01 14 19 12.13 53 26 11.6 0.6380 eMACSJ1419.2+5326-g24 14 19 32.04 53 27 38.9 0.6359 eMACSJ1419.2+5326-g02 14 19 10.92 53 26 20.8 0.6468 eMACSJ1419.2+5326-g25 14 19 38.95 53 28 40.4 0.6415 eMACSJ1419.2+5326-g03 14 19 20.67 53 27 23.2 0.6303 eMACSJ1419.2+5326-g26 14 19 33.72 53 28 36.2 0.6450 eMACSJ1419.2+5326-g04 14 19 10.51 53 25 18.1 0.6391 eMACSJ1419.2+5326-g27 14 19 38.67 53 27 45.3 0.6374 eMACSJ1419.2+5326-g05 14 19 14.16 53 26 27.9 0.644 eMACSJ1419.2+5326-g28 14 19 22.00 53 28 15.9 0.5571 eMACSJ1419.2+5326-g06 14 19 08.00 53 25 22.4 0.6462 eMACSJ1419.2+5326-g29 14 19 34.79 53 29 21.5 0.6308 eMACSJ1419.2+5326-g08 14 19 21.15 53 26 36.3 0.7220 eMACSJ1419.2+5326-g30 14 19 46.23 53 29 12.0 0.6348 eMACSJ1419.2+5326-g09 14 19 21.62 53 25 46.6 0.6430 eMACSJ1419.2+5326-g31 14 19 43.27 53 29 17.5 0.6410 eMACSJ1419.2+5326-g10 14 19 26.86 53 24 50.8 0.6377 eMACSJ1419.2+5326-g32 14 19 48.11 53 27 11.2 0.6746 eMACSJ1419.2+5326-g11 14 19 10.95 53 25 40.4 0.6411 eMACSJ1419.2+5326-g33 14 19 54.72 53 30 35.7 0.6389 eMACSJ1419.2+5326-g12 14 18 55.51 53 25 21.9 0.6408 eMACSJ1419.2+5326-g34 14 19 50.90 53 30 17.2 0.6326 eMACSJ1419.2+5326-g13 14 18 42.64 53 25 27.4 0.6455 eMACSJ1419.2+5326-g35 14 19 53.49 53 30 29.8 0.6426 eMACSJ1419.2+5326-g14 14 18 46.66 53 25 51.7 0.6409 eMACSJ1419.2+5326-g36 14 19 51.89 53 30 27.3 0.6349 eMACSJ1419.2+5326-g15 14 18 41.97 53 25 29.2 0.6451 eMACSJ1419.2+5326-g37 14 19 49.05 53 30 21.8 0.6278 eMACSJ1419.2+5326-g16 14 18 37.07 53 27 40.9 0.6808 eMACSJ1419.2+5326-g38 14 19 50.30 53 30 11.7 0.6310 eMACSJ1419.2+5326-g17 14 18 41.84 53 23 48.0 0.6411 eMACSJ1419.2+5326-g39 14 18 33.61 53 23 00.5 0.4673 eMACSJ1419.2+5326-g18 14 19 04.45 53 23 59.1 0.5743 eMACSJ1419.2+5326-g23s 0.6334 eMACSJ1419.2+5326-g19 14 19 29.10 53 25 22.6 0.6351 eMACSJ1419.2+5326-g09s 0.1942 eMACSJ1419.2+5326-g20 14 19 34.53 53 25 45.4 0.6319 eMACSJ1419.2+5326-g06s 0.7675 eMACSJ1419.2+5326-g21 14 19 33.90 53 25 11.3 0.6779 eMACSJ1419.2+5326 RXJ1613.7+5542-g1 16 13 42.25 55 42 04.6 0.1071† RXJ1613.7+5542-g7 16 13 41.32 55 43 43.5 0.2656 RXJ1613.7+5542-g2 16 13 42.09 55 41 55.7 0.3528 RXJ1613.7+5542-g7 16 13 32.57 55 43 50.7 0.3498 RXJ1613.7+5542-g3 16 13 28.28 55 41 59.7 0.3497 RXJ1613.7+5542-g8 16 13 33.40 55 43 04.5 0.5099 RXJ1613.7+5542-g4 16 13 50.58 55 42 21.5 0.3532 RXJ1613.7+5542-g1s 0.3530 RXJ1613.7+5542-g5 16 13 32.08 55 41 14.4 0.3498 RXJ1613.7+5542-g3s 0.3498 RXJ1613.7+5542-g6 16 13 40.66 55 41 53.1 0.3578 RXJ1613.7+5542-g7s 0.3501 RXJ1613.7+5542 a QSO / type-1AGN (broad emission lines).
References
- Allen et al. (2001) Allen, S. W. et al. 2001, MNRAS, 324, 842
- Allen et al. (2008) Allen S. W., Rapetti D. A., Schmidt R. W., Ebeling H., Morris R. G., Fabian A. C., 2008, MNRAS, 383, 879
- Andreon (2012) Andreon S., 2012, A&A, 548, 83
- Bradač et al. (2008) Bradač, M., Allen, S. W., Treu, T., Ebeling H., Massey R., Morris R.G., von der Linden A., Applegate D., 2008, ApJ, 687, 959
- Carlberg et al. (1996) Carlberg R.G., Yee H.K.C., Ellingson E., Abraham R., Gravel P., Morris S., Pritchet C.J., 1996, ApJ, 462, 32
- Coe et al. (2013) Coe D. et al., 2013, ApJ, 762, 32
- Demarco et al. (2010) Demarco R. et al. 2010, ApJ, 711, 1185
- Ebeling et al. (1998) Ebeling, H., Edge, A. C., Böhringer, H., Allen S.W., Crawford C.S., Fabian A.C., Voges W., Huchra J.P., 1998, MNRAS, 301, 881
- Ebeling, Edge, & Henry (2001) Ebeling H., Edge A.C., Henry J.P., 2001, ApJ, 553, 668
- Ebeling et al. (2007) Ebeling H., Barrett E., Donovan D., Ma C.-J., Edge A.C., van Speybroeck L., 2007, ApJ, 661, L33 Rengelink R., Courtney N.J.D., 2003, MNRAS, 339, 913
- Ebeling et al. (2009) Ebeling, H., Ma, C. J., Kneib, J.-P., Jullo E., Courtney N.J.D., Barrett E., Edge A.C., Le Borgne J.-F., 2009, MNRAS, 395, 1213
- Ebeling et al. (2010) Ebeling H., Edge A. C., Mantz A., Barrett E., Henry J. P., Ma C. J., van Speybroeck L., 2010, MNRAS, 407, 83
- Edge et al. (2002) Edge, A.C., Wilman, R.J., Johnstone, R.M., Crawford C.S., Fabian A.C., Allen S.W., 2002, MNRAS, 337, 49
- Edge et al. (2003) Edge A. C., Ebeling H., Bremer M., Röttgering H., van Haarlem M. P., Rengelink R., Courtney N. J. D., 2003, MNRAS, 339, 913
- Faber et al. (2003) Faber S. M. et al. 2003, Proc. SPIE, 4841, 1657
- Kaiser et al. (2002) Kaiser N. et al., 2002, Proc. SPIE, 4836, 154
- Korngut et al. (2011) Korngut P.M., et al. 2011, ApJ, 734, 10
- Limousin et al. (2007) Limousin M. et al. 2007, ApJ, 668, 643
- Ma & Ebeling (2011) Ma C.-J., Ebeling H., 2011, MNRAS, 410, 2593
- Ma et al. (2008) Ma C.-J., Ebeling H., Donovan D., Barrett E., 2008, ApJ, 684, 160
- Ma et al. (2010) Ma C.-J., Ebeling H., Marshall P., Schrabback T., 2010, MNRAS, 406, 121
- Mann & Ebeling (2012) Mann A. W., Ebeling H., 2012, MNRAS, 420, 2120
- Mantz et al. (2010) Mantz A., Allen S. W., Rapetti D., Ebeling H., 2010, MNRAS, 406, 1759
- Markevitch & Vikhlinin (2007) Markevitch, M., & Vikhlinin, A. 2007, Phys Rep, 443, 1
- Miyaji et al. (2000) Miyaji, T., Hasinger, G., & Schmidt, M. 2000, A&A, 353, 25
- Mullis et al. (2004) Mullis, C. R., Vikhlinin, A., Henry, J. P., et al. 2004, ApJ, 607, 175
- Oguri et al. (2012) Oguri, M., Bayliss, M. B., Dahle, H., Sharon K., Gladders M.D., Natarajan P., Hennawi J.F., Koester H.P., 2012, MNRAS, 420, 3213
- Owers et al. (2012) Owers, M. S., Couch, W. J., Nulsen, P. E. J., & Randall, S. W., 2012, ApJ, 750, L23
- Planck (2012) Planck Collaboration, 2013, A&A, 550, 130
- Richard et al. (2011) Richard J., Kneib J.-P., Ebeling H., Stark D. P., Egami E., Fiedler A. K., 2011, MNRAS, 414, L31
- Smith et al. (2009) Smith G. P., et al., 2009, ApJ, 707, L163
- Sunyaev & Zeldovich (1972) Sunyaev R. A., Zeldovich Y. B., 1972, Comments Astrophys. Space Phys., 4, 173
- Swinbank et al. (2010) Swinbank A. M., et al., 2010, Nat., 464, 733
- Tonry et al. (2012) Tonry J. L., et al., 2012, ApJ, 750, 99
- Trichas et al. (2010) Trichas M. et al., 2010, MNRAS, 405, 2243
- Voges et al. (1999) Voges W. et al., 1999, A&A, 349, 389
- Zenn & Ebeling (2010) Zenn A. R., Ebeling H., 2010, A&A, 524, A30