Temperature-dependent optical conductivity of layered LaSrFeO4
Abstract
Compounds with intermediate-size transition metals such as Fe or Mn are close to the transition between charge-transfer systems and Mott-Hubbard systems. We study the optical conductivity of insulating layered LaSrFeO4 in the energy range eV from 15 K to 250 K by the use of spectroscopic ellipsometry in combination with transmittance measurements. A multipeak structure is observed in both and . The layered structure gives rise to a pronounced anisotropy, thereby offering a means to disentangle Mott-Hubbard and charge-transfer absorption bands. We find strong evidence that the lowest dipole-allowed excitation in LaSrFeO4 is of Mott-Hubbard type. This rather unexpected result can be attributed to Fe - O hybridization and in particular to the layered structure with the associated splitting of the level. In general, Mott-Hubbard absorption bands may show a strong dependence on temperature. This is not the case in LaSrFeO4, in agreement with the fact that spin-spin and orbital-orbital correlations between nearest neighbors do not vary strongly below room temperature in this compound with a high-spin configuration and a Néel temperature of K.
pacs:
71.20.Be, 71.27.+a, 75.47.Lx, 78.20.-eI Introduction
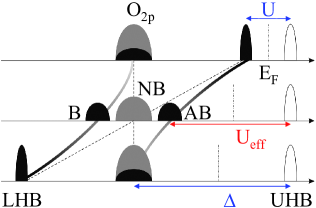
Many transition-metal compounds with a partially filled shell show charge localization and insulating behavior. Typically, this is driven by the large on-site Coulomb repulsion , which splits the conduction band into a lower and an upper Hubbard band (LHB and UHB). According to the Zaanen-Sawatzky-Allen scheme,ZSA one distinguishes between two kinds of correlated insulators, depending on the relative size of and the charge-transfer (CT) energy between the transition-metal band and the highest occupied ligand level, e.g. oxygen . In a CT insulator with , the charge gap is formed between O and the UHB. In contrast, Mott-Hubbard (MH) insulators show , and the states closest to the Fermi level predominantly have transition-metal character (see Fig. 1). This character is decisive for a quantitative description of doped compounds. For instance in a hole-doped CT system such as the high- cuprates, the mobile carriers predominantly have oxygen character.
Early transition-metal compounds are typically classified into the group of MH insulators, whereas late ones are identified as being of CT type.zaanen90 ; mizokawa1996 ; matsuno ; olalde ; arima1993 With increasing atomic number, increases whereas decreases,zaanen90 ; arima1993 which reflects the decreasing spatial extension of the orbitals and the increasing electronegativity of the transition-metal ions, respectively. However, the character of oxides with intermediate size transition-metal ions, in particular Mn3+, has been discussed controversially. On the basis of optical data, both LaMnO3 and LaSrMnO4 have been interpreted either as of CT typearima1993 ; arima1995 ; tobe2001 ; moritomo1995 ; lee07 or of MH type,jung1995 ; quijada2001 ; kovaleva2004a ; kim04 ; kim06 ; goessling08 while recently a dual nature of the optical gap has been proposed.moskvin This controversy arises due to the strong hybridization between Mn and O states (see Fig. 1). Early on, Mizokawa and Fujimorimizokawa1996 pointed out that in LaMnO3, but that the highest occupied O band shows a large admixture of character. Goessling et al.goessling08 emphasized that the symmetry of the highest occupied, strongly hybridized band is determined by the band, which is essential for the optical selection rules and thus for a quantitative analysis of the optical data. They suggested that the manganites can be viewed as effective Mott-Hubbard systems, where is strongly renormalized by hybridization (see Fig. 1). This scenario is supported by recent measurements on transition-metal difluorides F2 using x-ray emission spectroscopy.olalde Due to the element selectivity of this technique, the contribution of the transition-metal LHB to the highest occupied states can be revealed even for .
At first sight, the situation is more transparent in the case of the ferrites FeO3 with trivalent Fe ions. Compared to the manganites, the stability of the high-spin state of Fe3+ gives rise to a comparably large energy of MH excitations of roughly , where denotes the intra-atomic Hund exchange. Indeed these compounds commonly are identified as CT systems.arima1993 ; arima1995 ; mizokawa1996 ; pisarev09 However, the case of layered LaSrFeO4 is still under discussion. It shows the same Fe3+ configuration and has also been interpreted as a CT insulator based on optical reflectivity data measured up to 36 eV at room-temperature with in-plane polarization of the electric field.moritomo1995 In contrast, Omata et al. omata1994XAS conclude from their resonant photoemission data that the valence band in LaSrFeO4 is formed by a mixture of Fe and O states. Thus they characterize LaSrFeO4 as an intermediate type CT and MH insulator, but they also mention that the states at the valence band edge mainly show O character. Here, we address the optical conductivity of LaSrFeO4. The anisotropy of of this layered structure provides the key to disentangle MH excitations and CT excitations. Neglecting hybridization, a MH excitation refers to an electron transfer between neighboring Fe sites and , , whereas a CT excitation refers to a transfer from O to Fe , . In the presence of hybridization, this distinction between MH and CT excitations is still a valid classification scheme since the hybridized states retain their original symmetry and thus follow the same selection rules. As discussed by Goessling et al.goessling08 for the case of LaSrMnO4, MH excitations only contribute to , i.e. for polarization of the electric field within the 2D layer, but not to . This reflects that Fe - Fe hopping between adjacent FeO2 layers is negligible. On the contrary, CT excitations are observed in both, and , as each Fe site is surrounded by an oxygen octahedron. We find a clear anisotropy of the lowest dipole-allowed excitations in LaSrFeO4, which suggests that they are of Mott-Hubbard type. We propose that this is driven by Fe - O hybridization and by the layered structure, the associated crystal-field splitting of the level pulls the lowest MH absorption band below the onset of CT excitations.
Additionally, we address the temperature dependence of the spectral weight. In general, CT and MH excitations show different spin and orbital selection rules. The spectral weight of MH excitations is expected to be strongly affected by a change of the nearest-neighbor spin-spin and orbital-orbital correlation functions.khaliullin2004a ; khaliullinrev ; oles2005 ; kovaleva2004a ; goessling08 ; lee2005a ; fang2003 ; goesslingTi ; reul In agreement with theoretical expectations, the spectral weight of the lowest absorption band in LaMnO3, LaSrMnO4, and VO3 changes by a factor of 2 - 3 due to the ordering of spins (and orbitals).kovaleva2004a ; goessling08 ; reul This clearly demonstrates the (effective) MH character of these systems. However, the behavior of the MH insulators YTiO3 and SmTiO4 is still puzzling in this context.goesslingTi In YTiO3, the spectral weight of the lowest MH excitation is expected to change by 25 % between the paramagnetic and the ferromagnetic state.oles2005 However, the increase around the ordering temperature amounts to only 5 %, while, at the same time, larger changes are observed up to 300 K.goesslingTi Due to the three-dimensional character of the magnetic order, these larger changes far above can not be explained by a change of the spin-spin correlations. In the G-type antiferromagnet SmTiO3, spin ordering is expected to suppress the spectral weight of the lowest MH excitation by about 50 % for all crystallographic directions,oles2005 but the observed effects are again much smaller and show even the wrong sign along and .goesslingTi This behavior has been attributed to small changes of the orbital occupation.goesslingTi It is important to quantify the possible strength of other effects such as excitonic contributions, the thermal expansion of the lattice or bandstructure effects. In this context, layered LaSrFeO4 with its stable state is an interesting candidate for a reference system. Long-range antiferromagnetic spin order sets in at K,soubeyroux ; omata94TN ; qureshi thus one expects only very small changes of the spin-spin and orbital-orbital correlation functions below room temperature. Thus far, not much is known about the optical spectra of LaSrFeO4. Room temperature data has been obtained by the means of diffuse reflectance on powdered samplesomata1996optics and by reflectivity measurements on single crystals,moritomo1995 ; tajima but only for in-plane polarization of the electric field.
The paper is organized as follows. The experimental details are described in Sec. II, followed in Sec. III by a short description of the crystal structure and the electronic structure. A discussion of the expected multiplet splitting of MH and CT absorption bands is given in Sec. IV. Finally, in Sec. V we present our experimental data (Sec. V.1) together with a discussion of the peak assignment (Sec. V.2) and an analysis of the temperature dependence of the MH excitations (Sec. V.3).
II Experiment
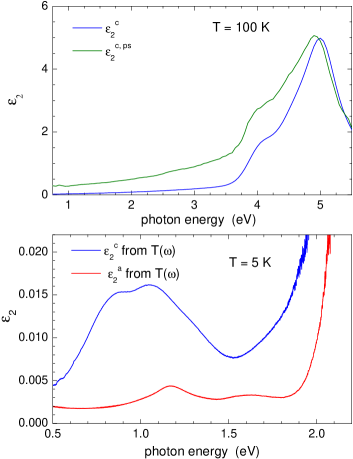
Single crystals of LaSrFeO4 have been grown using the floating-zone method.qureshi The purity, stoichiometry, and single-phase structure of the crystals was checked by neutron diffraction and by x-ray diffraction. Typical dimensions of crystals used in this study are a few mm along all three crystallographic axes. Ellipsometric data in the energy range eV was obtained using a rotating-analyzer ellipsometer (Woollam VASE) equipped with a retarder between polarizer and sample. The angle of incidence was . The ellipsometric measurements have been performed from 15 K to 250 K in a UHV cryostat with mbar. Window effects of the cryostat have been corrected using a standard Si wafer. Ellipsometry is a self-normalizing technique and does not require reference measurements, furthermore it yields the complex dielectric function directly without a Kramers-Kronig transformation. These are two significant advantages over conventional reflection measurements. Ellipsometry is particularly suited to determine the precise temperature dependence of the optical spectral weight.kovaleva2004a ; goessling08 ; goesslingTi ; reul Measurements of the ellipsometric angles and have been performed on a polished surface in two different orientations, with the axis perpendicular to the plane of incidence. We obtain the two non-vanishing, complex entries and of the dielectric tensor for tetragonal symmetry by fitting the measured data of both orientations simultaneously with a series of Gaussian oscillators for and a Kramers-Kronig consistent line shape for . In the analysis, we have taken into account a finite surface roughness since ellipsometry is a surface-sensitive technique. The properties of the surface can be determined reliably in a frequency range where the investigated bulk sample is transparent, i.e., . To determine the suitable energy range, we employed a Fourier-transform spectrometer (Bruker IFS 66/v) and performed infrared transmittance measurements between 0.5 eV and 2.5 eV on a single crystal polished to a thickness of 39 m. We used the observed interference fringes to determine the refractive index , which in turn allowed us to determine from the transmittance, see bottom panel of Fig. 2. These data show only very weak parity- and spin-forbidden local crystal-field excitations between 0.5 eV and 2.0 eV, thus is a valid approximation below 2 eV. Using this result for the analysis of the low-energy ellipsometry data yields a surface roughness with a thickness of approx. 6 nm.
In the top panel of Fig. 2 we compare our result for with the so-called pseudo-dielectric function . Aspnesaspnes proposed that the latter may serve as a reasonable approximation for the former under certain conditions. The main advantage of the pseudo-dielectric function is that it can be determined directly from the data measured for a single orientation. Figure 2 shows that the overall features are well reproduced, but large discrepancies are observed below the onset of strong absorption at about 3.5 eV, where shows a spurious background. As far as Fe3+ compounds are concerned, a similar feature has been discussed in BiFeO3.pisarev09 In the case of LaSrFeO4, the transmittance data prove that this background is an artefact present only in but not in .
III Structure, spins, and orbitals
The compound LaSrFeO4 crystallizes in the single-layered structure of K2NiF4 with tetragonal symmetry I4/mmm. The Fe3+ ions are octahedrally coordinated by oxygen ions, building perfect FeO2 square planes with 180∘ Fe-O-Fe bonds. The lattice constants at room temperature are Å and Å.qureshi Nominally, there are five electrons in the shell per Fe site. In the high-spin ground state, these five electrons yield a total spin of 5/2. Antiferromagnetic order has been observed below K.soubeyroux ; qureshi Our crystals do not exhibit any evidence for an additional magnetic phase transition.qureshi In cubic approximation, the level is split into the lower-lying and the higher-lying levels. The magnitude of the splitting Dq is mainly determined by the Fe - O bond lengths, it can be estimated to be roughly 10 Dq = 1.0 - 1.5 eV in LaSrFeO4.goessling08 ; galuza1998 The FeO6 octahedra show a sizeable tetragonal distortion with Fe - O bond lengths of 1.9354 Å in the plane and 2.1486 Å perpendicular to it at 10 K.qureshi Therefore, the manifold is split into the lower-lying doublet ( and ) and the higher-lying (or ) level. At the same time, the level splits into () and (), where the energy of the former is significantly reduced compared to the energy of the latter. In LaSrMnO4, these splittings have been determined from optical data, yielding eV and eV.goessling08 For LaSrFeO4, we expect a similar value of but a smaller value of , since is enhanced in LaSrMnO4 due to the additional Jahn-Teller splitting of the singly occupied level, which is evident from the larger value of . We emphasize that the pronounced elongation of the octahedra in LaSrFeO4 gives rise to a sizeable value of , even in the absence of a Jahn-Teller contribution. Our results below yield eV.
IV Charge-transfer and Mott-Hubbard excitations
First, we focus on the physics of CT excitations. These result from the transfer of an electron from a ligand O orbital into a Fe orbital, . Pisarev et al.pisarev09 present a detailed theoretical analysis of the CT excitations for undistorted FeO6 octahedra. The highest occupied O states are of non-bonding character with symmetry , , , and . Their relative energies are determined by, e.g., the different Madelung energies of and orbitals and by the - overlap.pisarev09 The level is expected to be the highest in energy. Quantum-chemistry calculationspisarev09 for LaFeO3 predict that , , and are lower by 0.8 eV, 1.8 eV, and 3 eV, respectively. The lowest unoccupied states are the anti-bonding and orbitals with hybrid Fe - O character, and these are split by = 10 Dq.
According to the parity selection rule, the even-even (from type to type) transitions from the level at the top of the O band to the unoccupied and orbitals are forbidden. Additionally, the matrix elements for transitions from to levels vanish for a single octahedron, thus only and transitions give rise to strong absorption. In summary, the onset of CT excitations is governed by the dipole-forbidden transition , followed by the strong dipole-allowed transitions and . The next transition is roughly 2 eV higher in energy due to the splitting between and on the one hand and between and states on the other hand. Thus in cubic approximation there are only two strong excitations in the energy range relevant to us. For the layered structure of LaSrFeO4, we have to expect additional splittings. However, the large splitting of the level is not important for the lowest CT excitations, which correspond to an electron transfer into the level.
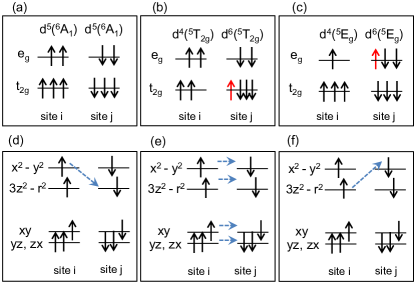
We now address the MH excitations, which result from the transfer of an electron between neighboring Fe sites and via the or bonding of the ligand O orbital, . Starting from the cubic approximation, the initial state has symmetry, corresponding to the - fold degenerate high-spin state (see Fig. 3 (a)). According to the orbital selection rule, there is no overlap between and orbitals on neighboring sites due to the undistorted 180∘ bonds in LaSrFeO4. From the [] initial state one can reach the final states [] (corresponding to an electron transfer between orbitals, see Fig. 3(b)) and [] (transfer between orbitals, see Fig. 3(c)). All reachable and states have total spin . The spectral weight of these transitions therefore strongly depends on the nearest-neighbor spin-spin correlations,khaliullin2004a ; khaliullinrev ; oles2005 favoring antiparallel alignment of spins on neighboring sites (see Fig. 3), as given in the antiferromagnetically ordered state below K. Since the orbital quantum number is preserved in the transition (cf. Figs. 3b) and 3c)), both excitations have approximately the same energy.10Dq As a consequence, only one MH peak is expected in the optical spectra in the cubic approximation.
However, deviations from cubic symmetry play an important role in the tetragonal structure of LaSrFeO4. First of all, the matrix elements for MH excitations between different FeO2 layers can be neglected, thus MH excitations do not contribute to . Second, lifting the degeneracy in particular of the level enhances the number of observable absorption bands in . An splitting on the order of 1 eV is expected due to the elongation of the FeO6 octahedra, as discussed in Sec. III. In the following, we neglect the much smaller spitting within the levels. We will show that is crucial in order to pull the lowest MH absorption band below the onset of CT excitations.
| 0 |
The matrix elements for nearest-neighbor Fe - Fe transitions are summarized in Table 1. Due to the undistorted 180∘ bonds of LaSrFeO4, these hopping process conserve the orbital character. The single exception is the finite overlap between on site and on a neighboring site. One thus expects three different MH peaks (referred to as MH1, MH2, and MH3 in the following) in with energy separation : (1) The electron transfer from to (MH1, see Fig. 3(d)). (2) The excitation from any orbital on site to an orbital of the same type on the neighboring site (MH2, see Fig. 3(e)). This excitation is expected at an energy of above MH1. The individual contributions have approximately the same energy because the orbital quantum number is preserved.10Dq (3) The excitation from to (MH3, see Fig. 3(f)). This excitation is expected at an energy of above MH1.
We use the matrix elements of Table 1 to calculate the relative spectral weight of the MH peaks. Summing up the individual contributions we find that the spectral weight of MH1 and MH3 is identical, whereas the spectral weight of MH2 is expected to be 3.8 times larger.
V Results
V.1 Experimental data
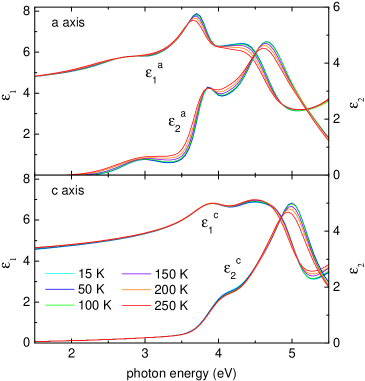
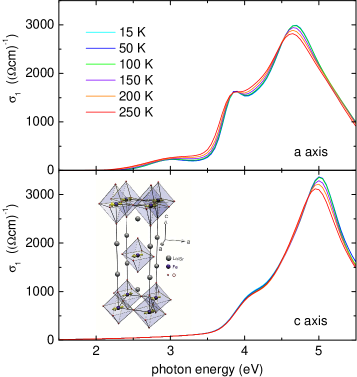
Figure 4 displays the dielectric function () from 1.5 eV to 5.5 eV as obtained from the ellipsometric measurements. The real part of the optical conductivity is shown in Fig. 5. Overall, our data agree with the room-temperature data of reported in Refs. [moritomo1995, ; tajima, ]. Thus far, data for has not been reported. We find a striking anisotropy. Both and show a strong absorption band at 4 - 5.5 eV. However, in we find an additional peak at 3 eV and the shoulder at 3.8 eV is much more pronounced. In the following we argue that the latter two features correspond to MH excitations.
V.2 Peak assignment
The observed absorption bands can be assigned to MH and CT excitations. The role played by local crystal-field (i.e., valence-conserving ) excitations can be neglected in our analysis of the ellipsometry data. In LaSrFeO4 they are forbidden both by parity and by the spin selection rule. Accordingly, they show a very small spectral weight with typical valuesrueckamp ; figgis of cm. Their signatures are visible in the transmittance data below the charge gap, see lower panel of Fig. 2.
A first tool to distinguish CT and MH excitations is the spectral weight. In transition-metal oxides, typical values of are of a few 1000 cm for CT excitations but only a few 100 cm for MH excitations.arima1993 ; goesslingTi ; goessling08 ; reul The difference is due to the fact that the matrix elements are of first order in the Fe - O hopping amplitude for CT excitations and of second order for MH excitations. To disentangle CT excitations and MH excitations, we further make use of the observed anisotropy. In layered LaSrFeO4, MH excitations do not contribute to since the interlayer Fe - Fe hopping is strongly suppressed.
The strong absorption band observed at 4 - 5 eV in clearly has to be attributed to CT excitations. Our analysis of the ellipsometric data uses three Gaussian oscillators to describe the line shape, see Fig. 6. This does not imply the existence of three microscopically different excitations since the line shape of the absorption band is not necessarily Gaussian but reflects bandstructure effects. The analysis of the -axis data requires three very similar oscillators, in particular with a similar spectral weight. The peak energies differ by up to 0.4 eV for the two crystallographic directions, which most probably reflects the different on-site energies of apical and in-plane O ions. We attribute this band at 4 - 5 eV to the two strong dipole-allowed CT excitations and (in cubic approximation, see discussion in Sec. IV). The splitting between these two excitations is expected to be about 1 eV according to quantum-chemistry calculations for LaFeO3.pisarev09 In LaSrFeO4, the next higher-lying peak is observed at about 7 eV in the in-plane data of Refs. [moritomo1995, ; tajima, ]. This large energy difference to the peak at 5 eV supports our interpretation that both and contribute to the absorption band between 4 and 5 eV. Note that both excitations correspond to a transfer to a state, and that the crystal-field splitting of the level is expected to be only small, about 0.2 eV (see Sec. III). Moreover, the matrix elements for transitions into the manifold do not differ very strongly between and , even for an elongated octahedron, in contrast to the matrix elements for transitions into the orbital. The similar spectral weights along and between 4 eV and 5 eV therefore support our assignment.
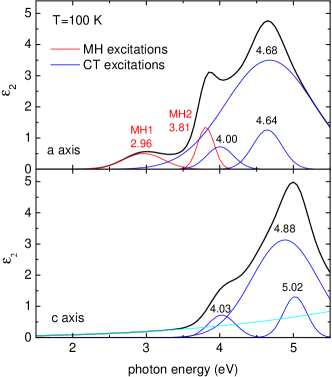
The -axis data show two additional features at 3.0 eV and 3.8 eV, see Figs. 5 and 6. For the feature at 3.0 eV, both its lower spectral weight with eV) peaking at about 250 cm and the observed anisotropy support an interpretation in terms of a MH excitation. Moreover, the splitting between the two lowest MH excitations is expected to be roughly eV (see Fig. 3), in very good agreement with the difference of 0.8 eV between the observed peak energies of 3.0 and 3.8 eV. The third MH excitation is expected roughly above the lowest one, i.e., within the strong CT band. As far as the relative spectral weight is concerned, we roughly expect a factor of 3.8 between the two lowest MH excitations, see Sec. IV. Experimentally, the spectral weight of MH1 and MH2 is rather similar. However, our simple estimate does not take into account hybridization effects and is based on a local approach.
At first sight, it is unexpected that the lowest absorption band is of MH type because the configuration is stabilized by the intra-atomic Hund exchange . In cubic approximation, a first rough estimate of the MH excitation energy yields with eV. This is much larger than in the manganites, for which we expect . However, MH1 in the layered structure of LaSrFeO4 corresponds to a transfer from to , thus it is lower in energy than in cubic approximation. In comparison, the lowest MH excitation in LaSrMnO4 requires the opposite transfer from to , raising the excitation energy to . In LaSrMnO4, this MH excitation is observed at eV.goessling08 We thus expect MH1 in LaSrFeO4 at about (MH1), i.e., roughly at 3 - 4 eV. Here, we neglect the slight increase of from Mn to Fe, but we also neglect that the 3d4 and 3d6 states relevant for the MH1 excitation both are Jahn-Teller active (cf. Fig. 3d)), which reduces (MH1). Moreover, these estimates neglect the effect of hybridization depicted schematically in Fig. 1. Therefore, the assignment of the peak at 3.0 eV to MH1 appears feasible.
However, we also have to discuss alternative scenarios. As discussed in Sec. IV, the lowest CT excitation is dipole-forbidden and expected at about 0.8 eV below the lowest dipole-allowed CT excitation. Firstly, the spectral weight of the peak at 3 eV is too large for a dipole-forbidden excitation, and secondly, we expect only a modest anisotropy of this excitation. Possibly, this dipole-forbidden excitation may explain the small but finite values of between 2 eV and 3.5 eV. In a further scenario, the peak at 3.0 eV may be interpreted as a CT exciton. Note that this peak is lying at about 0.5 eV below the CT absorption edge and that a truly bound state with such a large binding energy is very unlikely. Again, it is not obvious why such an exciton should show a pronounced anisotropy. Moreover, an exciton with such a large binding energy is expected to show a larger spectral weight and a smaller line width.
Summarizing this section, we have found strong evidence that the lowest dipole-allowed absorption band in LaSrFeO4 is of MH type, which is made possible by the strong splitting caused by the layered structure and by the Fe - O hybridization. We want to add that in LaSrFeO4 the energy of the lowest dipole-forbidden CT excitation may be comparable to the energy of MH1. Furthermore, the MH excitation from at site to a orbital on a neighboring site is lower in energy than MH1, but the matrix element for this excitation vanishes (cf. Table I). We emphasize that our results do not disagree with the common interpretation that non-layered ferrites belong to the class of CT insulators. The different character can be explained by the absence of a large in the non-layered compounds. Pisarev et al.pisarev09 studied the optical properties of a series of different ferrites with trivalent Fe ions. Many of these compounds show a shoulder in the vicinity of the onset of strong CT absorption, which has been attributedpisarev09 to the parity-forbidden excitation . The peak observed at 3.0 eV in LaSrFeO4 is much too strong for such a dipole-forbidden excitation. However, our results suggest that MH excitations may not be neglected for a quantitative analysis of the non-layered ferrites, they may for instance provide a better explanation for a shoulder close to the absorption edge than the dipole-forbidden excitation discussed above.
V.3 Temperature dependence
As discussed in the introduction, the temperature dependence of the spectral weight of MH excitations has attracted considerable interest in different transition-metal compounds because it allows to study the temperature dependence of nearest-neighbor spin-spin and orbital-orbital correlations.khaliullin2004a ; khaliullinrev ; oles2005 ; kovaleva2004a ; goessling08 ; lee2005a ; fang2003 ; goesslingTi ; reul In LaSrFeO4 we expect that the temperature dependence of these correlations is only small below 300 K. Actually, the spin-spin correlations change only gradually even above the ordering temperature due to the two-dimensional character.goessling08 This ferrite thus may serve as a reference compound to study the role of other effects such as the thermal expansion of the lattice or bandstructure effects.
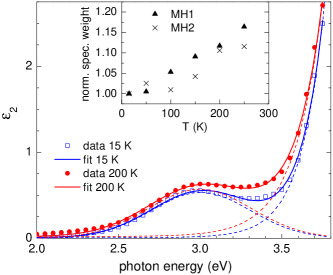
As expected, the MH excitations at 3.0 eV and 3.8 eV show only a modest temperature dependence, see top panel of Fig. 5. According to the fit using Gaussian oscillators (cf. Fig. 6), the spectral weight of MH2 at 3.8 eV changes only by about 10 % between 5 K and 250 K, see inset of Fig. 7. At the same time, the peak width increases by about 15 %, and the peak frequency decreases by about 1 %. For the peak MH1 at 3.0 eV, a quantitative analysis is more challenging. Both the spectral weight and the width of the Gaussian oscillator depicted in Fig. 6 increase strongly with temperature, while the frequency of the oscillator increases by about 1 % from 5 K to 250 K. As mentioned above, there is not necessarily a one-to-one correspondence between the Gaussian oscillators and the microscopic excitations with different line shapes, which is corroborated by the unexpected behavior of the oscillator parameters such as the hardening of the frequency with increasing temperature. This gives clear evidence that the change of MH1 is covered by the temperature-induced smearing of the much stronger CT excitations. To determine the temperature dependence of MH1 more reliably, we separate MH1 from the higher-lying excitations by fitting in the range 0.75 - 3.75 eV simultaneously by an exponential function and a Gaussian oscillator (see Fig. 7). The former accounts for the CT band edge and its shift with temperature, the latter describes the remaining spectral weight below the CT edge. With this procedure we find an increase of the spectral weight of MH1 of merely 15 % between 15 K and 250 K, see inset of Fig. 7. Obviously, also this value has to be taken with care, since it depends strongly on the line shape assumed for the onset of the CT absorption band. In fact, we expect the opposite trend, namely a reduction of spectral weight with increasing temperature as the axis lattice constant increases from 3.8709(1) Å to 3.8744(1) Å between 10 K and room temperature.qureshi An increased Fe - O distance should result in a reduction of the Fe - O overlap which in turn should reduce the spectral weight of both MH and CT excitations.
We have to conclude that an accurate determination of the temperature dependence of the spectral weight of the MH excitations is a difficult task in LaSrFeO4 due to the overlap with the much stronger CT excitations. A clear separation of strong CT excitations and weaker MH excitations is an obvious prerequisite in order to reliably determine the spectral weight of the latter. However, it can safely be concluded that the thermal expansion of the lattice has only a modest impact on the spectral weight of MH excitations below room temperature.
VI Summary and conclusions
We present a detailed analysis of the optical conductivity of layered LaSrFeO4 for temperatures
ranging from 15 K to 250 K in a broad frequency range from 0.5 eV to 5.5 eV.
Both the anisotropy and the different spectral weight allow us to disentangle Mott-Hubbard and charge-transfer
excitations. We arrive at a consistent assignment of all absorption bands and find strong evidence that the lowest
dipole-allowed excitation is of Mott-Hubbard type. Remarkably, this result is in agreement with previous
studies of non-layered ferrites which have been identified as charge-transfer insulators.
The difference can be explained by the large splitting of the orbital in the layered structure,
which partially compensates the large intra-atomic exchange contribution and pulls the lowest Mott-Hubbard excitation
below the onset of charge-transfer excitations.
Acknowledgement
It is a pleasure to acknowledge fruitful discussions with D.I. Khomskii. This work was supported by the DFG via SFB 608 and BCGS.
References
- (1)
- (2)
- (3) J. Zaanen, G.A. Sawatzky, and J.W. Allen, Phys. Rev. Lett. 55, 418 (1985).
- (4) J. Zaanen and G.A. Sawatzky, J. Solid State Chem. 88, 8 (1990).
- (5) P. Olalde-Velasco, J. Jiménez-Mier, J.D. Denlinger, Z. Hussain, and W.L. Yang, Phys. Rev. B 83, 241102(R) (2011).
- (6) J. Matsuno, Y. Okimoto, M. Kawasaki, and Y. Tokura, Phys. Rev. Lett. 95, 176404 (2005).
- (7) T. Mizokawa and A. Fujimori, Phys. Rev. B 54, 5368 (1996).
- (8) T. Arima, Y. Tokura, and J.B. Torrance, Phys. Rev. B 48, 17006 (1993).
- (9) T. Arima, and Y. Tokura, J. Phys. Soc. Jpn. 64, 2488 (1995).
- (10) Y. Moritomo, T. Arima and Y. Tokura, J. Phys. Soc. Jpn. 64, 4117 (1995).
- (11) K. Tobe, T. Kimura, Y. Okimoto, and Y. Tokura, Phys. Rev. B 64, 184421 (2001).
- (12) Y.S. Lee, T. Arima, S. Onoda, Y. Okimoto, Y. Tokunaga, R. Mathieu, X.Z. Yu, J.P. He, Y. Kaneko, Y. Matsui, N. Nagaosa, and Y. Tokura, Phys. Rev. B 75, 144407 (2007).
- (13) J. H. Jung, K. H. Kim, D. J. Eom, T. W. Noh, E. J. Choi, J. Yu, Y. S. Kwon, and Y. Chung, Phys. Rev. B 55, 15489 (1997).
- (14) M. A. Quijada, J. R. Simpson, L. Vasiliu-Doloc, J. W. Lynn, H. D. Drew, Y. M. Mukovskii, and S. G. Karabashev, Phys. Rev. B 64, 224426 (2001).
- (15) N. N. Kovaleva, A. V. Boris, C. Bernhard, A. Kulakov, A. Pimenov, A. M. Balbashov, G. Khaliullin, and B. Keimer, Phys. Rev. Lett. 93, 147204 (2004).
- (16) M.W. Kim, P. Murugavel, Sachin Parashar, J.S. Lee, and T.W. Noh, New J. Phys. 6, 156 (2004).
- (17) M.W. Kim, S.J. Moon, J.H. Jung, Jaejun Yu, Sachin Parashar, P. Murugavel, J.H. Lee, and T.W. Noh, Phys. Rev. Lett. 96, 247205 (2006).
- (18) A. Gössling, M.W. Haverkort, M. Benomar, Hua Wu, D. Senff, T. Möller, M. Braden, J. A. Mydosh, and M. Grüninger, Phys. Rev. B 77, 035109 (2008).
- (19) A.S. Moskvin, A.A. Makhnev, L.V. Nomerovannaya, N.N. Loshkareva, and A.M. Balbashov, Phys. Rev. B, 82, 035106 (2010).
- (20) R.V. Pisarev, A.S. Moskvin, A.M. Kalashnikova, and Th. Rasing, Phys. Rev. B 79, 235128 (2009).
- (21) T. Omata, K. Ueda, H. Hosono, T. Miyazaki, S. Hasegawa, H. Ueda, and H. Kawazoe, Phys. Rev. B, 49, 10200 (1994).
- (22) G. Khaliullin, P. Horsch, and A. M. Oleś, Phys. Rev. B 70, 195103 (2004).
- (23) G. Khaliullin, Prog. Theor. Phys. Suppl. 160, 155 (2005).
- (24) A. M. Oles, G. Khaliullin, P. Horsch, and L. F. Feiner, Phys. Rev. B 72, 214431 (2005).
- (25) J.S. Lee, M.W. Kim, and T.W. Noh, New J. Phys. 7, 147 (2005).
- (26) Z. Fang, N. Nagaosa, and K. Terakura, Phys. Rev. B 67, 035101 (2003).
- (27) A. Gössling, R. Schmitz, H. Roth, M. W. Haverkort, T. Lorenz, J. A. Mydosh, E. Müller-Hartmann, and M. Grüninger, Phys. Rev. B 78, 075122 (2008).
- (28) J. Reul, A.A. Nugroho, T.T.M. Palstra, and M. Grüninger, Phys. Rev. B 86, 125128 (2012).
- (29) J. L. Soubeyroux, P. Courbin, L. Fournes, D. Fruchart, and G. le Flem, J. Solid State Chem. 31, 313 (1980).
- (30) T. Omata, K. Ueda, H. Hosono, M. Katada, N. Ueda, and H. Kawazoe, Phys. Rev. B 49, 10194 (1994).
- (31) N. Qureshi, H. Ulbrich, Y. Sidis, A. Cousson, and M. Braden, arXiv:1301.2106, to be publ. in Phys. Rev. B.
- (32) T. Omata, H. Ikawa, S. Fijitsu, N. Ueda, H. Hosono, and H. Kawazoe, Solid State Comm. 97, 411 (1996).
- (33) S. Tajima, H. Ishii, T. Nakahashi, T. Takagi, S. Uchida, M. Seki, S. Suga, Y. Hidaka, M. Suzuki, T. Murakami, K. Oka, and H. Unoki, J. Opt. Soc. Am. B 6, 475 (1989).
- (34) D.E. Aspnes, J. Opt. Soc. Am. 70, 1275 (1980).
- (35) A. I. Galuza, A. B. Beznosov, and V. V. Eremenko, Low Temp. Phys. 24, 965, (1998).
- (36) Here we neglect that the value of 10 Dq(3dn) depends on the number of electrons.
- (37) W.A. Harrison, Elementary Electronic Structure, revised edition, (World Scientific, Singapore, 2011).
- (38) R. Rückamp, E. Benckiser, M.W. Haverkort, H. Roth, T. Lorenz, A. Freimuth, L. Jongen, A. Möller, G. Meyer, P. Reutler, B. Büchner, A. Revcolevschi, S.-W. Cheong, C. Sekar, G. Krabbes, and M. Grüninger, New J. Phys. 7, 177 (2005).
- (39) B.N. Figgis and M.A. Hitchman, Ligand Field Theory and Its Applications (Wiley-VCH, 2000).